United States
Securities and Exchange Commission
Washington, D.C. 20549
FORM 6-K
REPORT OF FOREIGN PRIVATE ISSUER
PURSUANT TO RULE 13a-16 OR 15d-16 UNDER
THE SECURITIES EXCHANGE ACT OF 1934
For the month of August 2023
Commission File Number 132-02847
INTER & Co, INC.
(Exact name of registrant as specified in its charter)
N/A
(Translation of Registrant’s executive offices)
Av Barbacena, 1.219, 22nd Floor
Belo Horizonte, Brazil, ZIP Code 30 190-131
Telephone: +55 (31) 2138-7978
(Address of principal executive office)
Indicate by check mark whether the registrant files or will file annual reports under cover of Form 20-F or Form 40-F.
Form 20-F ☒ Form 40-F ☐
Indicate by check mark if the registrant is submitting the Form 6-K in paper as permitted by Regulation S-T Rule 101(b)(1):
Yes ☐ No ☒
Indicate by check mark if the registrant is submitting the Form 6-K in paper as permitted by Regulation S-T Rule 101(b)(7):
Yes ☐ No ☒
EXHIBIT INDEX
| | | | | | | | |
| Exhibit No. | | Description of Exhibit |
| | |
| 99.1 | | |
| | |
| | |
SIGNATURE
Pursuant to the requirements of the Securities Exchange Act of 1934, the registrant has duly caused this report to be signed on its behalf by the undersigned, thereunto duly authorized.
| | | | | | | | | | | |
| | | |
| INTER & Co, INC. |
| By: | /s/ Santiago Horacio Stel |
| | Name: | Santiago Horacio Stel |
| | Title: | Senior Vice President of Finance and Risks |
Date: August 14, 2023
2Q23
Earnings Release
August 14th, 2023
CEO Letter | “A quarter of records” 2Q23 Highlights Activation Rate 52.2% +68bps QoQ Total Gross Revenue R$1.9bn +33% YoY NIM 2.0 9.5% +0.9 p.p. QoQ Efficiency Ratio 53% -9.0p.p. YoY Net Income
R$64mm Vs 16mm 2Q22 I could not be more excited to present our 2Q23 results, which have a symbolism that transcends the pure financial performance. It shows Inter at an inflection point, that enabled us to deliver a “quarter of records” in financial and operational metrics, as well as in the innovation front. We delivered an impressive set of of top and bottom-line figures. These record figures weren’t by a few percentage points, but by a wide margin, for example with our pretax income reaching R$ 80 million. We achieved this financial performance by continuing our disciplined financial management that spans across several fronts. On the revenue side, we kept fostering a strongly diversified business model, with a very high component of fee income, which this quarter went back to growing more than 10% QoQ. On expenses, if you recall, in January we announced our target of 30% efficiency ratio by 2027. When we announced this target, we were running at 73%, and in two quarters we were able to reach an impressive 53%, meaning we are a few years ahead of the performance we expected. On the NIM front, we had an impressive expansion, reaching 9.5%. This improvement is a result of our ROE-driven underwriting approach, which is changing our credit mix while improving our use of regulatory capital. I’m thrilled with the pace clients continue to choose us for their transactional life, with another 1 million new clients selecting us this quarter. Additionally, we increased ~70bps in activation, reaching 52.2%. On the innovation side, we launched our 7th vertical: Loyalty. We think this front has immense potential, as it provides our clients with flexibility to choose between miles, cashback and many other options, while allowing us to increase monetization through cross-selling, reduce churn and increase engagement. In summary, I could not be happier with this quarter. It marks an inflection point in our history, one in which all our cylinders pushing in the right direction. We have a fortress balance sheet, a unique deposit franchise, a loan portfolio with strong ROE potential, one of the highest fee income streams among Brazilian banks, and a client base the size of several countries combined. I want to close by thanking our employees and our clients, which make this quarter of records possible. As CEO I’m truly convinced that we are still at day 1 and the best is yet to come. João Vitor Menin Inter&Co CEO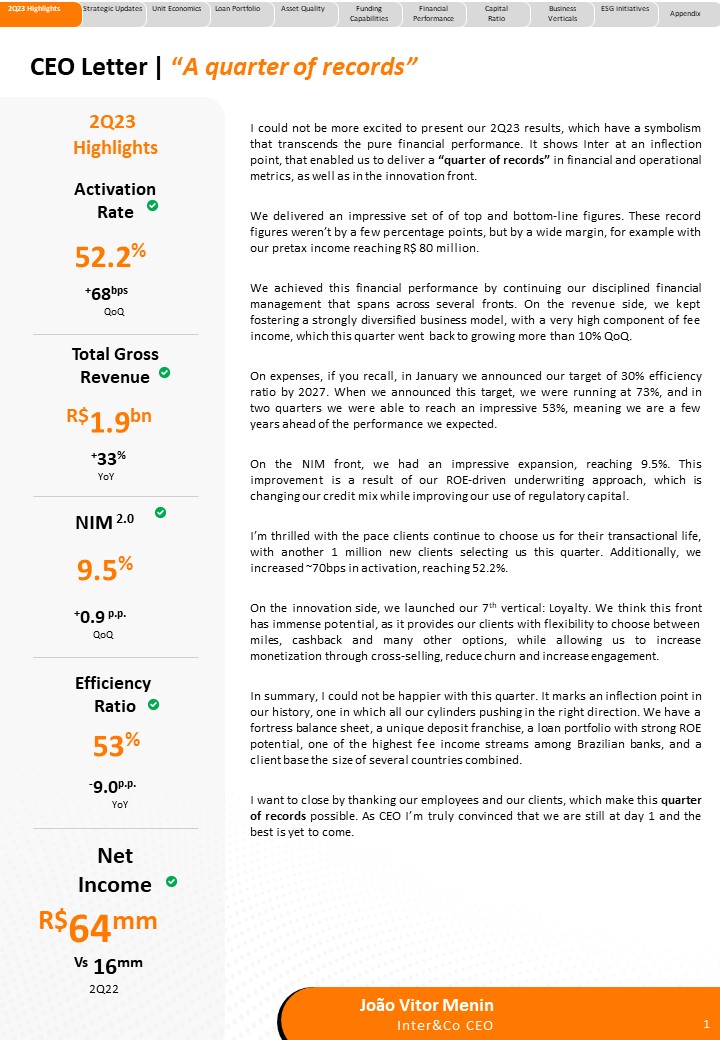
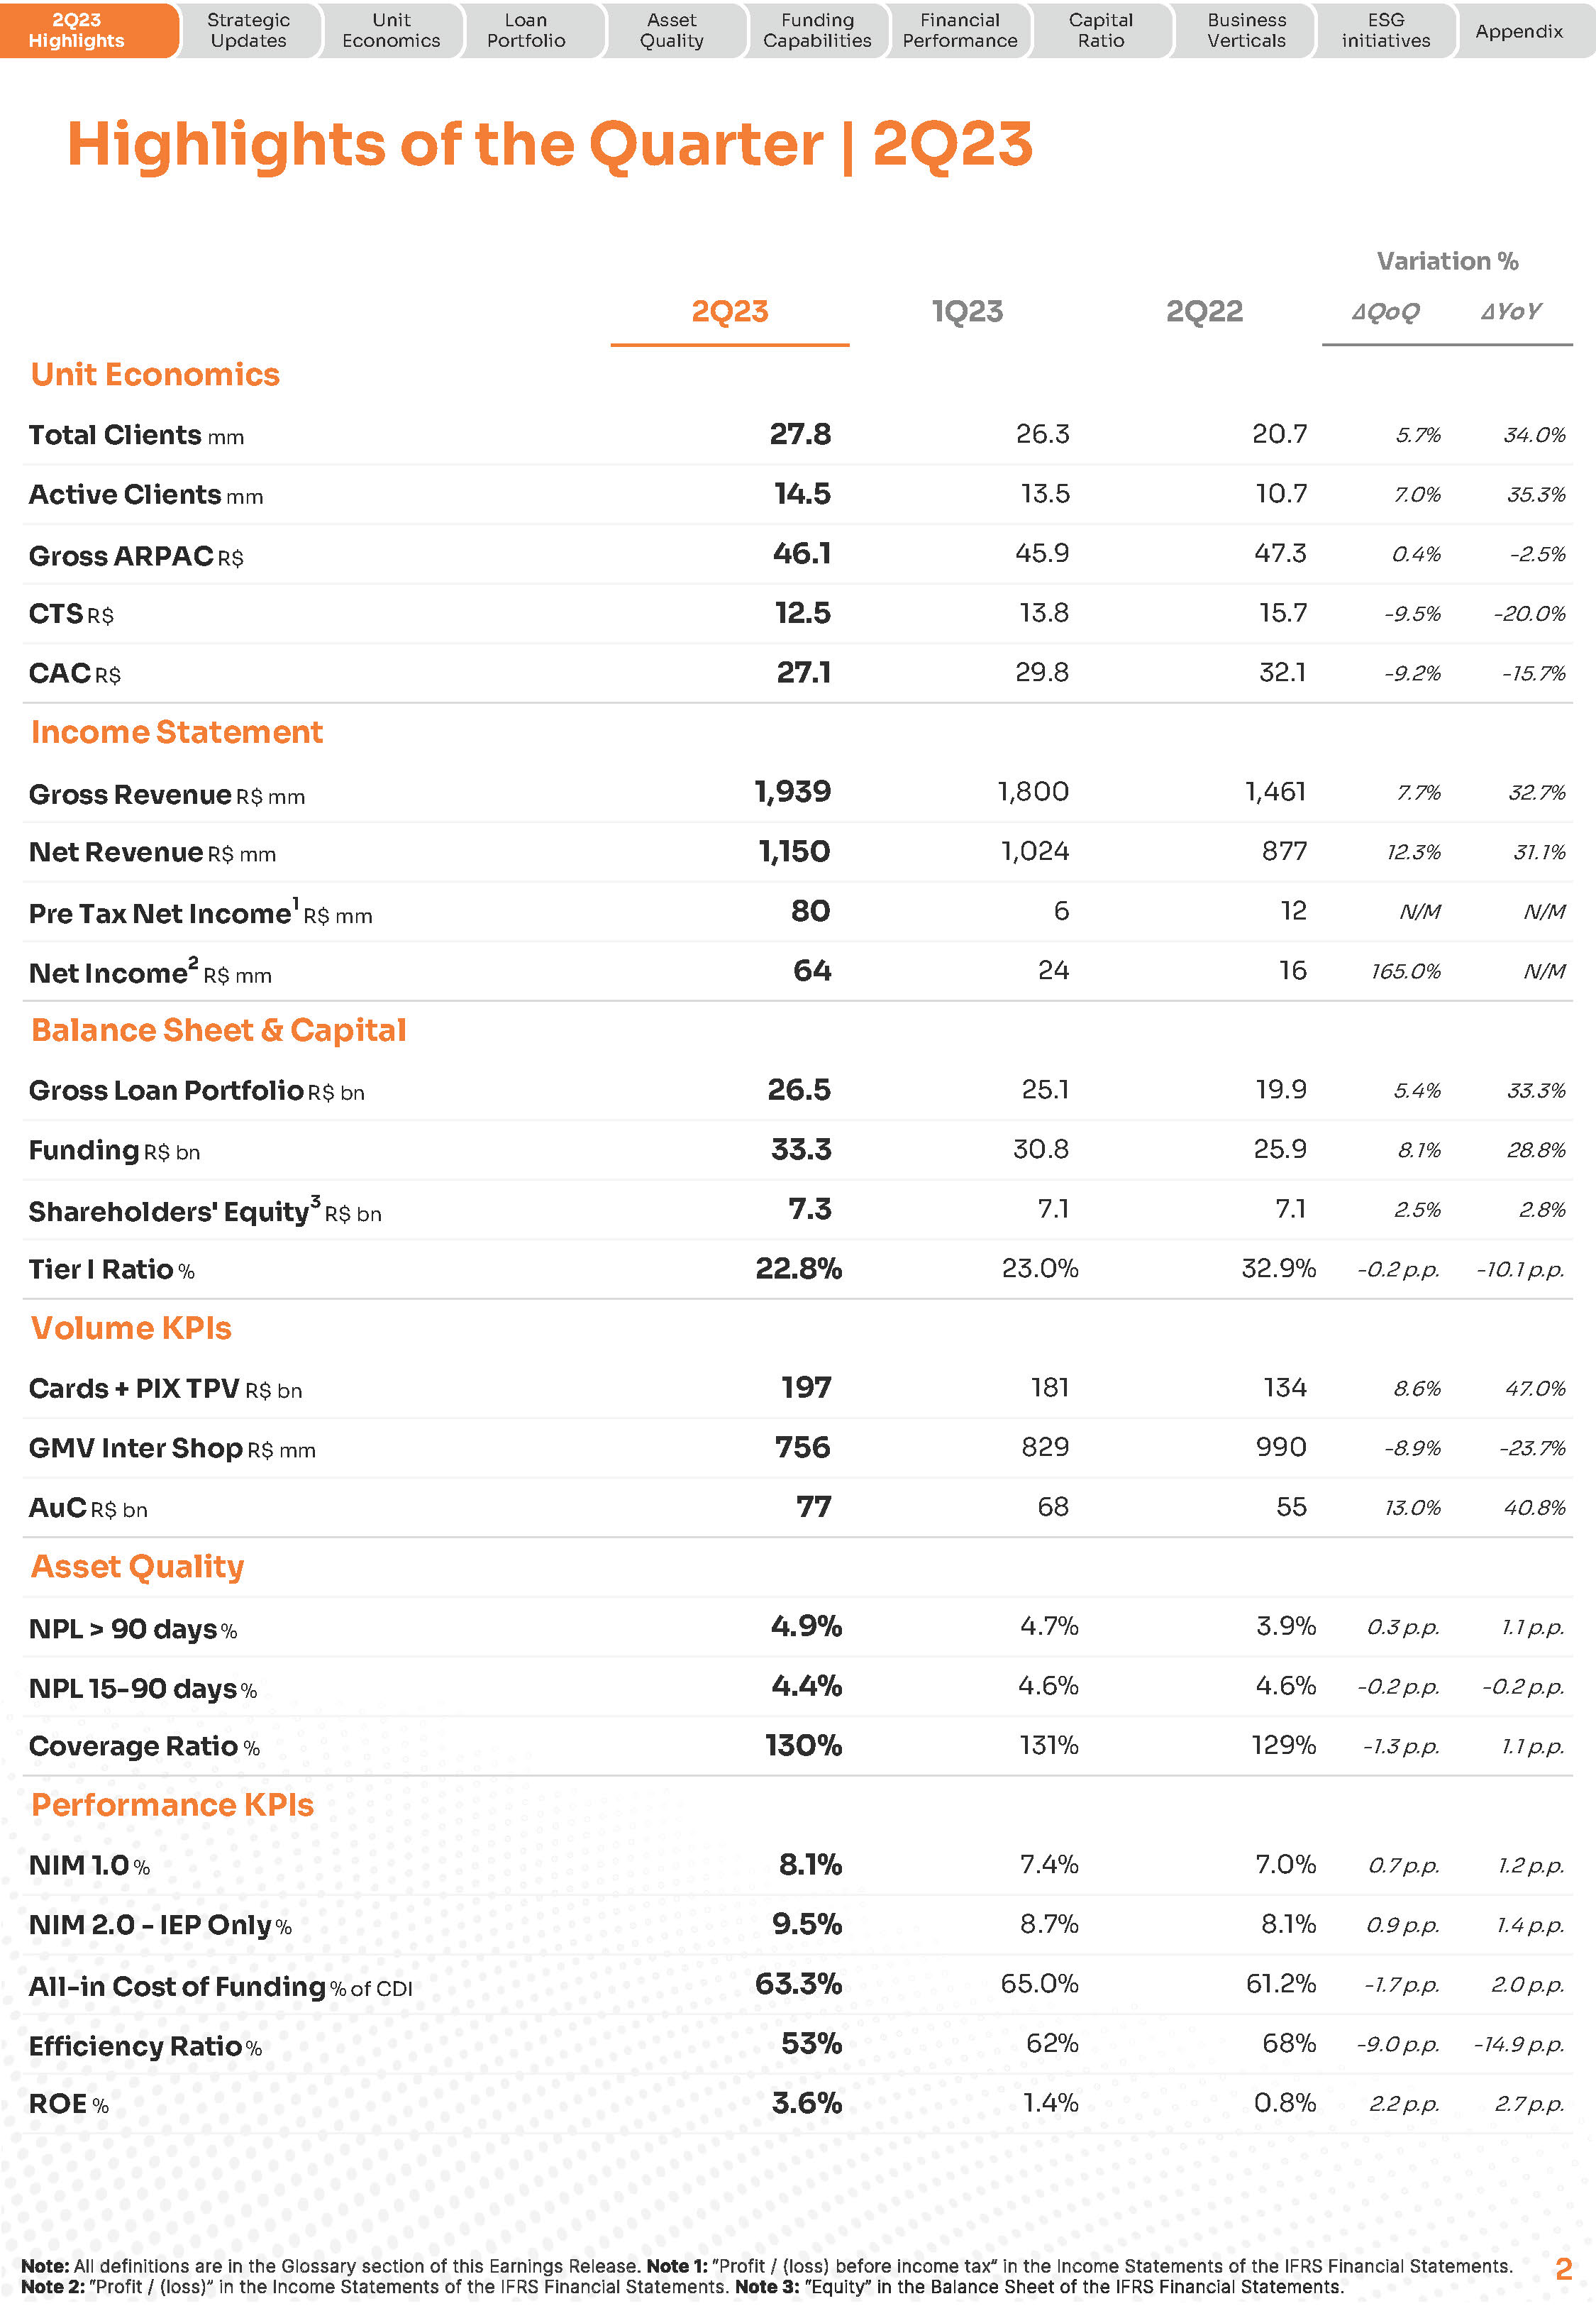
Highlights of the Quarter | 2Q23 Variation % 2Q23 1Q23 2Q22 ∆QoQ ∆YoY
Unit Economics Total Clients mm 27.8 26.3 20.7 5.7% 34.0% Active Clients mm 14.5 13.5 10.7 7.0% 35.3% Gross ARPAC R$ 46.1 45.9 47.3 0.4% -2.5% CTS R$ 12.5 13.8 15.7 -9.5% -20.0% CAC R$ 27.1 29.8 32.1 -9.2% -15.7% Income Statement
Gross Revenue R$ mm 1,939 1,800 1,461 7.7% 32.7% Net Revenue R$ mm 1,150 1,024 877 12.3% 31.1% Pre Tax Net Income1 R$ mm 80 6 12 N/M N/M Net Income2 R$ mm 64 24 16 165.0% N/M Balance Sheet & Capital Gross Loan Portfolio R$ bn 26.5
25.1 19.9 5.4% 33.3% Funding R$ bn 33.3 30.8 25.9 8.1% 28.8%
Shareholders' Equity3 R$ bn 7.3 7.1 7.1 2.5% 2.8% Tier I Ratio % 22.8% 23.0% 32.9% -0.2 p.p. -10.1 p.p. Volume KPIs Cards + PIX TPV R$ bn 197
181 134 8.6% 47.0% GMV Inter Shop R$ mm 756 829 990 -8.9% -23.7%
AuCR$ bn 77 68 55 13.0% 40.8% Asset Quality NPL > 90 days% 4.9% 4.7% 3.9% 0.3 p.p. 1.1 p.p. NPL 15-90 days% 4.4% 4.6% 4.6% -0.2 p.p. -0.2 p.p. Coverage Ratio % 130% 131% 129% -1.3 p.p. 1.1 p.p. Performance KPIs
NIM 1.0 % 8.1% 7.4% 7.0% 0.7 p.p. 1.2 p.p.
NIM 2.0 - IEP Only % 9.5% 8.7% 8.1% 0.9 p.p. 1.4 p.p.
All-in Cost of Funding% of CDI 63.3% 65.0% 61.2% -1.7 p.p. 2.0 p.p.
Efficiency Ratio % 53% 62% 68% -9.0 p.p. -14.9 p.p.
ROE % 3.6% 1.4% 0.8% 2.2 p.p. 2.7 p.p. Note: All definitions are in the Glossary section of this Earnings Release. Note 1: “Profit / (loss) before income tax” in the Income Statements of the IFRS Financial Statements.
Note 2: “Profit / (loss)” in the Income Statements of the IFRS Financial Statements. Note 3: “Equity” in the Balance Sheet of the IFRS Financial Statements.
2Q23 Highlights Strategic Updates Unit Economics Loan Portfolio Asset Quality Funding Capabilities
Financial Performance Capital Ratio Business Verticals ESG initiatives Appendix Strategic Update
Operational Leverage • Achieved record low Efficiency Ratio of 53%, 9 p.p. lower than 1Q23
• Record productivity, reaching 4.2k active clients per employee Continued Innovation • Launched Inter Loop, our proprietary rewards program • Implemented Global App in Brazil and US Strong Client Engagement • Increased activation ratio by ~70bps • Second consecutive quarter adding 1 mm active clients Record NIM Expansion Record Revenue • Continued ROE-driven underwriting framework • Record NIM expansion, both on 1.0 and 2.0 basis • Delivered record gross and net revenue • Strong performance on NII and Fees, with balanced growth on both fronts Record Profitability • Record pre- and post-tax income of R$80MM and R$64MM, respectively
• Tactically working to replicate gains in NIM & Efficiency to Cost of Risk
2Q23 Highlights Strategic Updates Unit Economics Loan Portfolio Asset Quality Funding Capabilities
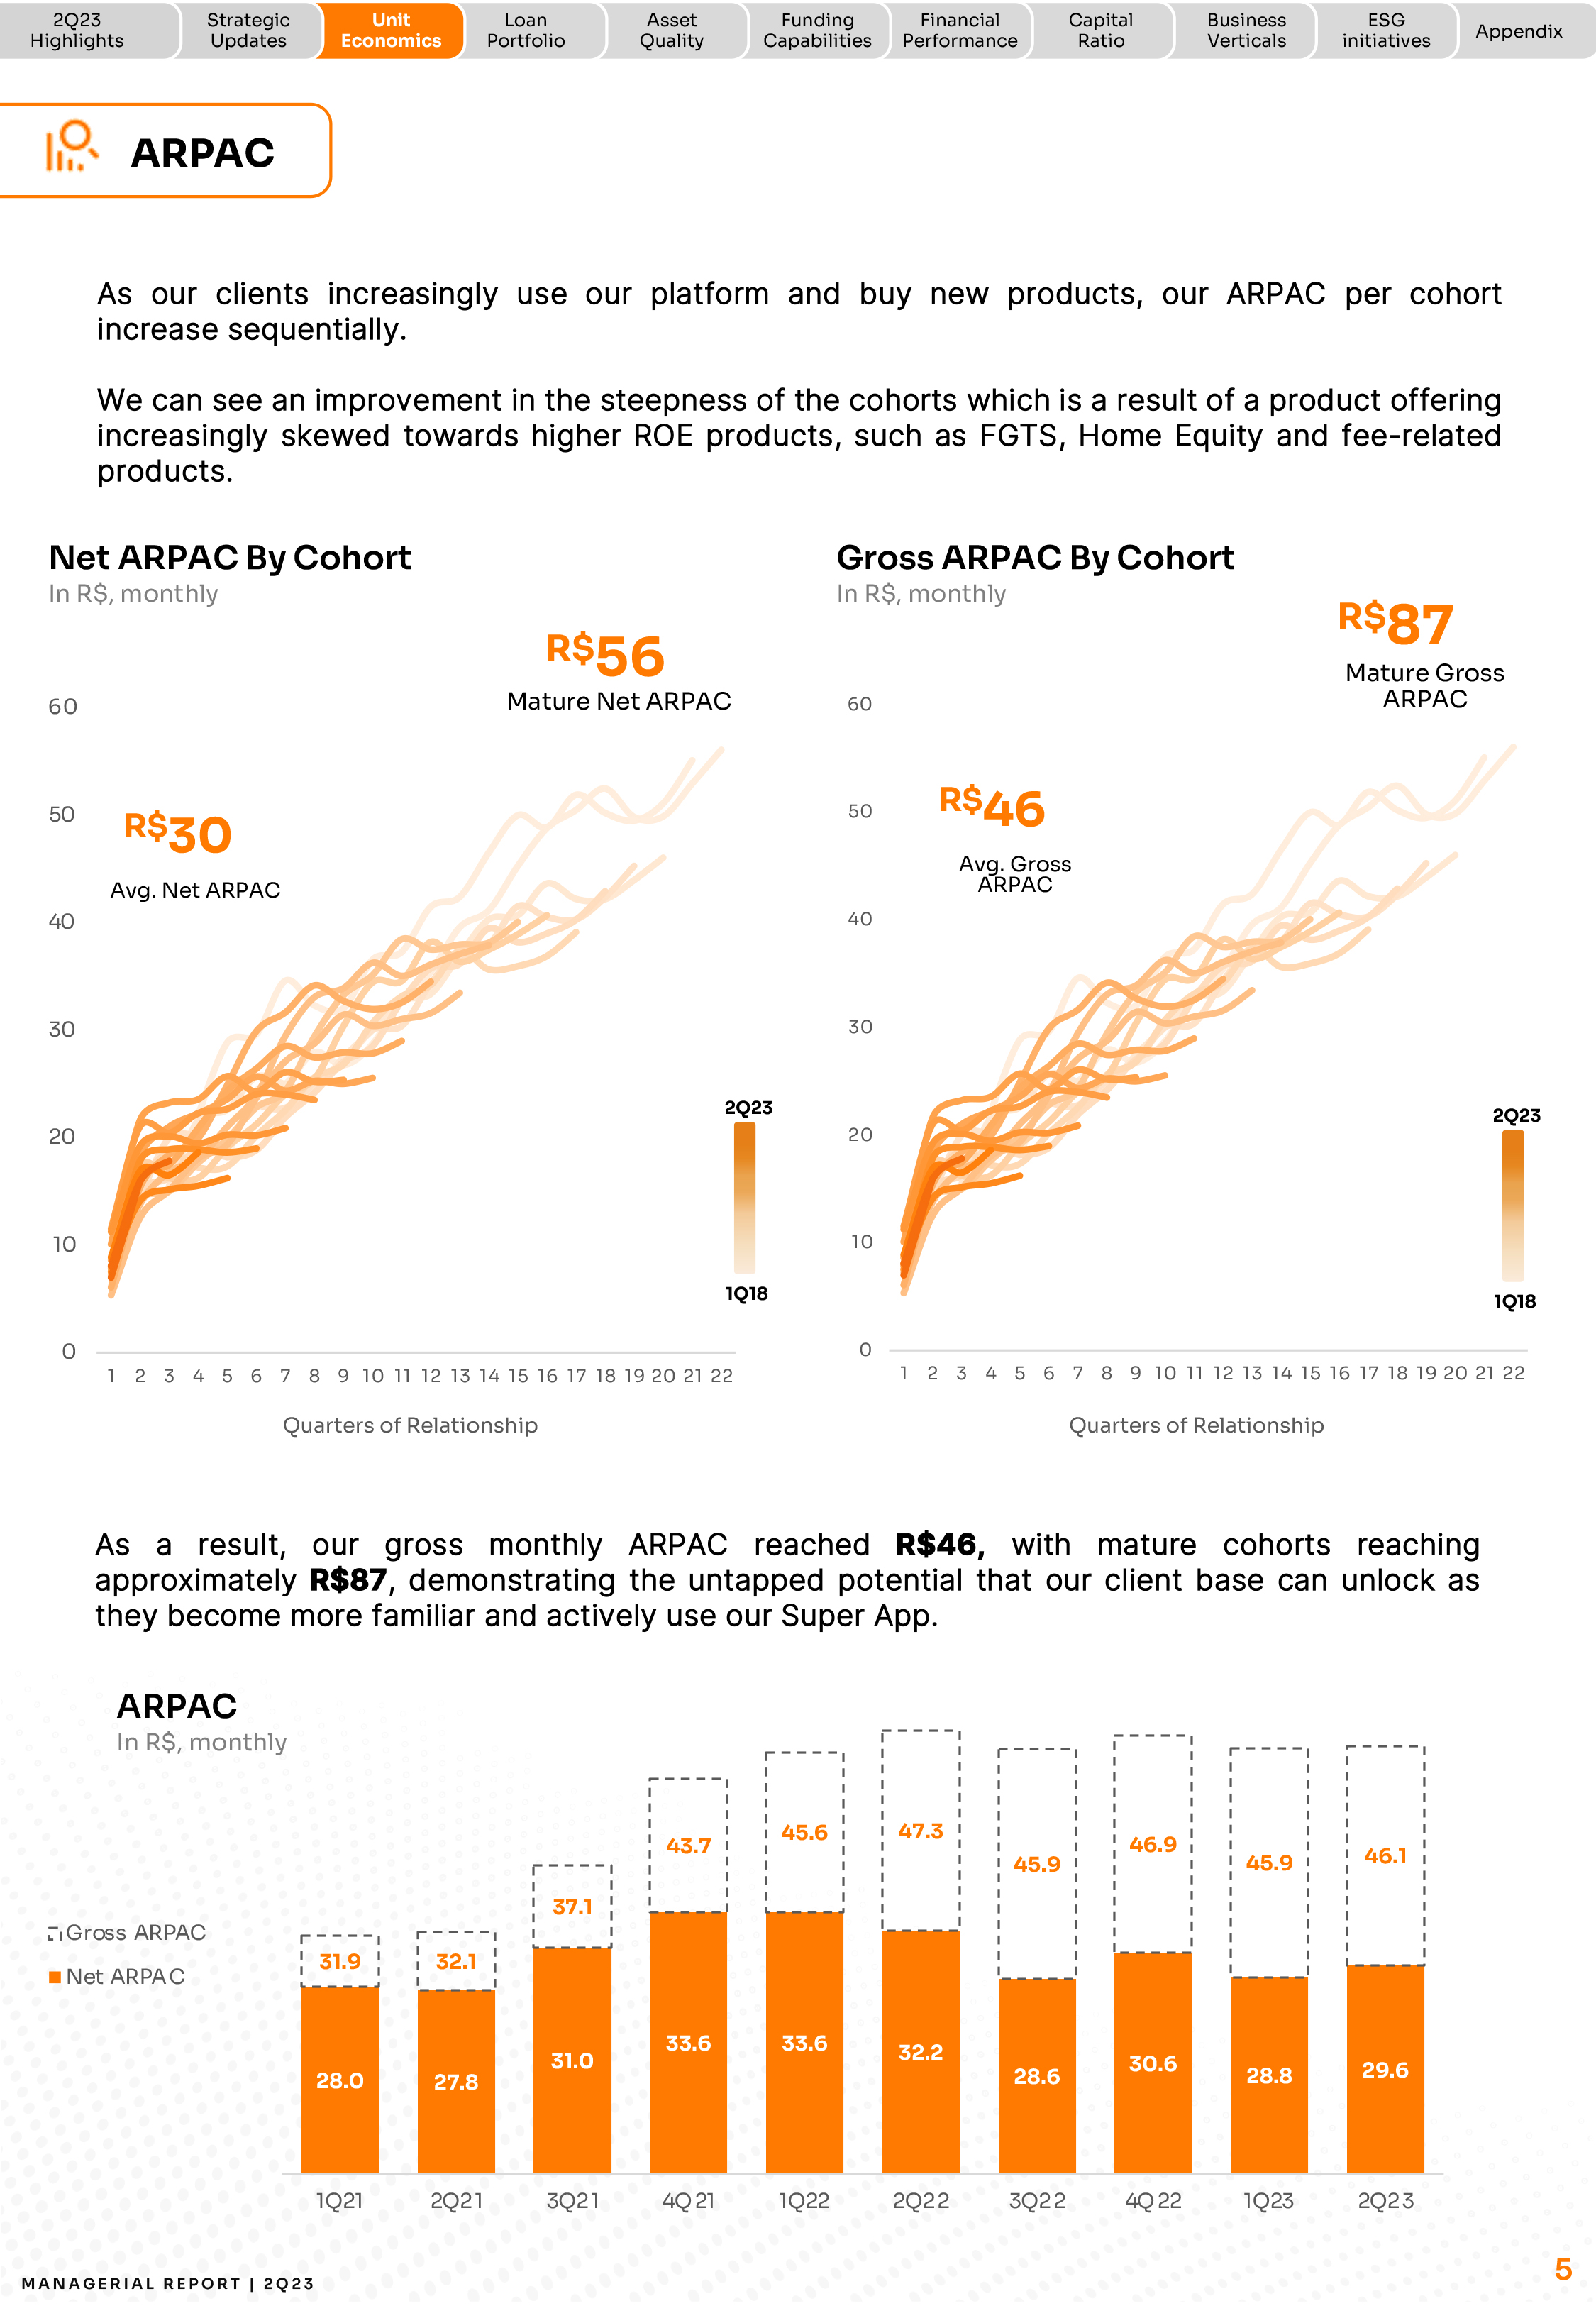
Financial Performance Capital Ratio Business Verticals ESG initiatives Appendix ARPAC As our clients increasingly use our platform and buy new products, our ARPAC per cohort increase sequentially. We can see an improvement in the steepness of the cohorts which is a result of a product offering increasingly skewed towards higher ROE products, such as FGTS, Home Equity and fee-related products.Net ARPAC By Cohort In R$, monthly 60 50 R$56 Mature Net ARPAC Gross ARPAC By Cohort In R$, monthly 60 50 R$87 Mature Gross ARPAC 40 40 30 30 20 20 10 0 1 2 3 4 5 6 7 8 9 10 11 12 13 14 15 16 17 18 19 20 21 22 Quarters of Relationship 10 1Q18 0
1 2 3 4 5 6 7 8 9 10 11 12 13 14 15 16 17 18 19 20 21 22 Quarters of Relationship As a result, our gross monthly ARPAC reached R$46, with mature cohorts reaching approximately R$87, demonstrating the untapped potential that our client base can unlock as they become more familiar and actively use our Super App. ARPAC In R$, monthly Gross ARPAC Net ARPAC MA N A G E R I A L R E P O R T | 2 Q 2 3 1Q21 2Q21 3Q21 4Q 21 1Q22 2Q22 3Q22 4Q 22 1Q23 2Q23 5 2Q23 Highlights Strategic Updates Unit Economics Loan Portfolio Asset Quality Funding Capabilities Financial Performance Capital Ratio Business Verticals ESG initiatives Appendix Loan Portfolio Credit Portfolio
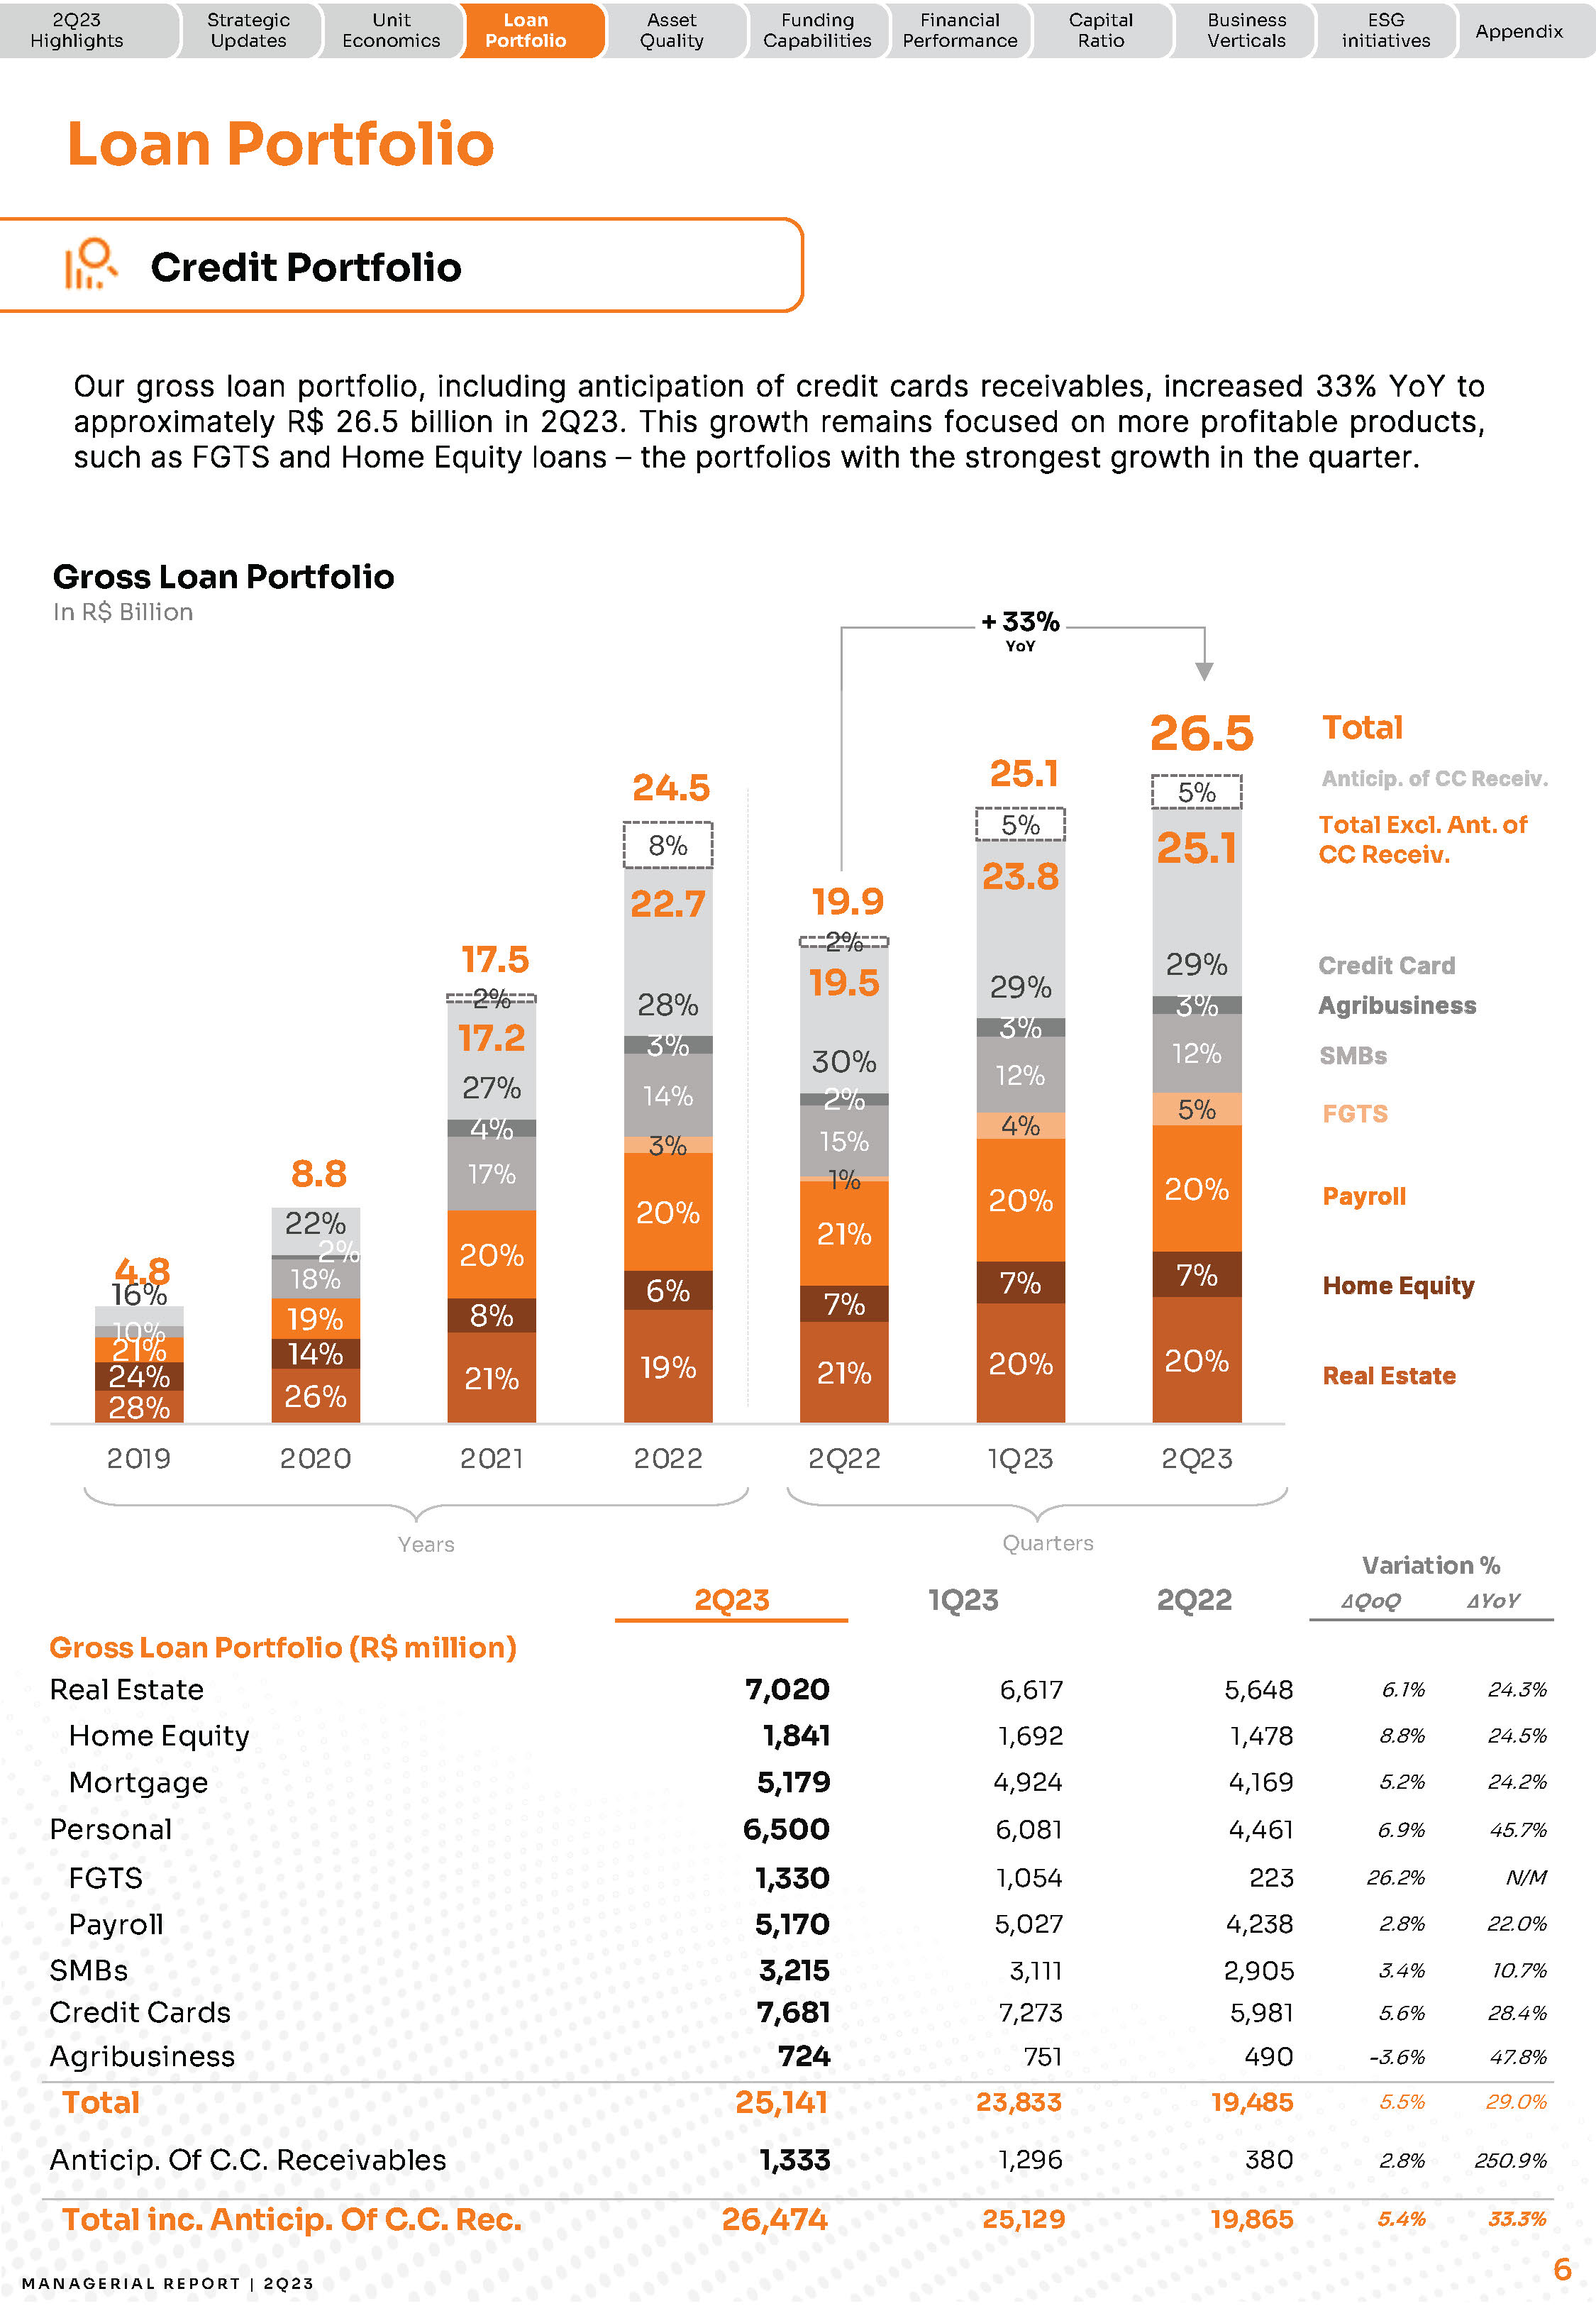
Our gross loan portfolio, including anticipation of credit cards receivables, increased 33% YoY to approximately R$ 26.5 billion in 2Q23. This growth remains focused on more profitable products, such as FGTS and Home Equity loans – the portfolios with the strongest growth in the quarter.
Gross Loan Portfolio Total Anticip. of CC Receiv. Total Excl. Ant. of CC Receiv. Credit Card Agribusiness SMBs FGTS Payroll Home Equity Real Estate Years Quarters Variation % 2Q23 1Q23 2Q22 ∆QoQ ∆YoY Gross Loan Portfolio (R$ million) Real Estate 7,020 6,617
5,648 6.1% 24.3% Home Equity 1,841 1,692 1,478 8.8% 24.5%
Mortgage 5,179 4,924 4,169 5.2% 24.2% Personal 6,500 6,081 4,461 6.9% 45.7% FGTS 1,330 1,054 223 26.2% N/M Payroll 5,170 5,027 4,238 2.8% 22.0% SMBs 3,215 3,111 2,905 3.4% 10.7% Credit Cards 7,681 7,273 5,981 5.6% 28.4% Agribusiness 724 751 490 -3.6% 47.8% Total 25,141 23,833 19,485 5.5% 29.0% Anticip. Of C.C. Receivables 1,333 1,296 380 2.8% 250.9% Total inc. Anticip. Of C.C. Rec. 26,474 25,129 19,865 5.4% 33.3% MA N A G E R I A L R E P O R T | 2 Q 2 3 6
2Q23 Highlights Strategic Updates Unit Economics Loan Portfolio Asset Quality Funding Capabilities
Financial Performance Capital Ratio Business Verticals ESG initiatives Appendix ARPAC
As our clients increasingly use our platform and buy new products, our ARPAC per cohort increase sequentially. We can see an improvement in the steepness of the cohorts which is a result of a product offering increasingly skewed towards higher ROE products, such as FGTS, Home Equity and fee-related products. Net ARPAC By Cohort In R$, monthly 60 50 R$56 Mature Net ARPAC Gross ARPAC By Cohort In R$, monthly 60 50 R$87 Mature Gross ARPAC 40 40 30 30 20 20 10 0 1 2 3 4 5 6 7 8 9 10 11 12 13 14 15 16 17 18 19 20 21 22 Quarters of Relationship 10 1Q18 0 1 2 3 4 5 6 7 8 9 10 11 12 13 14 15 16 17 18 19 20 21 22 Quarters of Relationship As a result, our gross monthly ARPAC reached R$46, with mature cohorts reaching approximately R$87, demonstrating the untapped potential that our client base can unlock as they become more familiar and actively use our Super App. ARPAC In R$, monthly Gross ARPAC Net ARPAC MA N A G E R I A L R E P O R T | 2 Q 2 3 1Q21 2Q21 3Q21 4Q 21 1Q22 2Q22 3Q22 4Q 22 1Q23 2Q23 5
2Q23 Highlights Strategic Updates Unit Economics Loan Portfolio Asset Quality Funding Capabilities
Financial Performance Capital Ratio Business Verticals ESG initiatives Appendix Loan Portfolio
Credit Portfolio Our gross loan portfolio, including anticipation of credit cards receivables, increased 33% YoY to approximately R$ 26.5 billion in 2Q23. This growth remains focused on more profitable products, such as FGTS and Home Equity loans – the portfolios with the strongest growth in the quarter. Gross Loan Portfolio Total Anticip. of CC Receiv. Total Excl. Ant. of CC Receiv.
Credit Card Agribusiness SMBs FGTS Payroll Home Equity Real Estate Years Quarters
Variation % 2Q23 1Q23 2Q22 ∆QoQ ∆YoY Gross Loan Portfolio (R$ million)
Real Estate 7,020 6,617 5,648 6.1% 24.3% Home Equity 1,841 1,692 1,478 8.8% 24.5% Mortgage 5,179 4,924 4,169 5.2% 24.2% Personal 6,500 6,081 4,461 6.9% 45.7% FGTS 1,330 1,054 223 26.2% N/M Payroll 5,170 5,027 4,238 2.8% 22.0% SMBs 3,215 3,111 2,905 3.4% 10.7% Credit Cards 7,681 7,273 5,981 5.6% 28.4% Agribusiness 724 751 490 -3.6% 47.8% Total 25,141 23,833 19,485 5.5% 29.0% Anticip. Of C.C. Receivables 1,333 1,296 380 2.8% 250.9% Total inc. Anticip. Of C.C. Rec. 26,474 25,129 19,865 5.4% 33.3% MA N A G E R I A L R E P O R T | 2 Q 2 3 6
2Q23 Highlights Strategic Updates Unit Economics Loan Portfolio Asset Quality Funding Capabilities
Financial Performance Capital Ratio Business Verticals ESG initiatives Appendix Credit Underwriting
Underwriting 1 In R$ Billio 5.8 7%, 0.4 5.4 7%; 0.4 51% 2.9 23%; 1.3 4.7 3%, 0.2 Total Anticip. of CC Receiv. Agribusiness SMBs FGTS Payroll Home Equity Repricing continues to be our core priority, with rates increasing across products. As already said, we are shifting the mix of new loans towards the higher ROEs. This quarter we included the disclosure of Home Equity loans balance, which reached the highest underwriting levels in over two years.The combination of the shift in underwriting mix, along with the comprehensive repricing efforts, has led to a notable 22.1% upsurge in the all-in loan rate for this quarter. Annualized Interest Rates In % 8 .0 0% 72.1% Credit Card exc. Non int. CC Receivables 7 .0 0% 22.1% All-in Loan Rate 52.8% 6 .0 0% 20.3% Payroll + FGTS 5 .0 0% 14.1% 13.3% 11.8%
11.3% 4 .0 0% 3 .0 0% 13.9% 10 .0 % SMBs Real Estate 0.0% 4Q21 1Q22 2Q22 3Q22 4Q22 1Q23 2Q23 Note: All definitions are in the Glossary section of this Earnings Release. Note 1: Credit cards are not included since it is a revolving and transactional product.
MA N A G E R I A L R E P O R T | 2 Q 2 3 7
2Q23 Highlights Strategic Updates Unit Economics Loan Portfolio Asset Quality Funding Capabilities
Financial Performance Capital Ratio Business Verticals ESG initiatives Appendix Asset Quality
NPLs We see a decreasing trend in the NPL 15 to 90 days, which now stands at 4.2% of the loan portfolio, indicating that new clients have improved risk profiles. The NPL over 90 days increased to 4.7%, consistent with the trend from the previous quarter, primarily influenced by older credit card cohorts. NPL rates for other portfolios remained flat and with no indications of worsening.
NPL 15 to 90 days In % NPL > 90 days In % 4.6% 4.6% 4.5% 4.5% 4.5% 4.3%
4.5% 4.1% 4.6% 4.3% 4.4% 4.2% 4.4% 4.7% 4.9% 3.5% 3.9% 4.0% 4.1% 4.4% 4.7%
3.4% 3.8% 3.8% 1Q22 2Q22 3Q22 4Q 22 1Q23 2Q23 1Q22 2Q22 3Q22 4Q 22 1Q23 2Q23 NPL 15-90 days NPL 15-90 days (Excl. Antic. of C.C. Receivables) NPL > 90 days
NPL > 90 days (Excl. Antic. of C.C. Receivables) Credit Cards NPL 90 days per cohort 1 In %
3 4 5 6 7 8 9 10 11 12 Quarters of Relationship
In line with the previous quarter, we observed a positive trend among new credit card clients. Newer clients have shown significantly better performance compared to older ones.
We attribute this improvement to our origination approach, which consistently optimizes credit allocation through, for example, prioritizing existing card clients with stronger credit performance and reducing the allocation for onboarding clients. NPL and Stage 3 Formation NPL and Stage 3 Formation2 In % NPL and Stage 3 formation experienced a slight increase of 0.1 p.p., reaching 1.6% for the quarter, consistent with the trend observed in previous quarters.0.5 1.0% 1.0%
1.1% 1.3% 1.1% 1.3% 1.5% 1.5% 1.5% 1.6% 1.6% 1.5% 0.0% 1Q22 2Q22 3Q22 4Q 22 1Q23 2Q23 NPL Formation Stage 3 Formation
Note 1: Cohorts defined as the first date when the client has his limit available. NPL per cohort = NPL > 90 days balance of the cohort divided by total credit card portfolio of the same cohort. Note 2: NPL formation is calculated considering: (overdue balance higher than 90 days in the current quarter – overdue balance higher than 90 days in the previous quarter + write-off change in the current quarter) ÷ Credit Portfolio Balance in the previous quarter. Stage 3 Formation = ( Δ Stage 3 Balance + Write-Offs of the period ) ÷ Total Credit Balance of previous period. From 1Q23 onwards IFRS and BACEN GAAP write-off methodology converged.MA N A G E R I A L R E P O R T | 2 Q 2 3 8
2Q23 Highlights Strategic Updates Unit Economics Loan Portfolio Asset Quality Funding Capabilities
Financial Performance Capital Ratio Business Verticals ESG initiatives Appendix
Cost of Risk & Coverage Ratio Cost of risk increased in the quarter, also driven by the performance of old credit card cohorts from previous periods. When examining the cost of risk for each quarter, we see a consistent trend in which the provisioning impact from loans originated in the same quarter diminishes sequentially.
When looking at the cost of risk excluding credit cards, we continue to see a stable trend at 1.1%.
Cost of Risk1 In % 4.9% 5.2% 5.2% 4.8% 4.8% 5.1% 5.0% 4.5% 6.0% 6.5%
5.6% 6.2% 2.1% 1.1% 1.9% 1.0% 1.1% 1.1% 1Q22 2Q22 3Q22 4Q 22 1Q23 2Q23
Cost of Risk (Excl. Antic. of C.C. Receivables) Cost of Risk Cost of risk (Excl. Credit Cards)
Our coverage ratio indicates resilience and strength, especially given the substantial collateralization of our portfolio, and remains flat at 130%.
Coverage Ratio In % 141% 126% 129% 132% 131% 130% 1Q22 2Q22 3Q22 4Q 22 1Q23 2Q23 Note: All definitions are in the Glossary section of this Earnings Release. Note 1: 1Q22: managerial number, excluding non-recurrent provision. MA N A G E R I A L R E P O R T | 2 Q 2 3 9
2Q23 Highlights Strategic Updates Unit Economics Loan Portfolio Asset Quality Funding Capabilities
Financial Performance Capital Ratio Business Verticals ESG initiatives Appendix
Funding Deposits Our funding surpassed R$ 33.3 billion in the 2Q23, an increase of 29% over last year. The main change in demand and time deposits balance was related to the Conta com Pontos launch, which optimized our reserve requirements and increased our liquidity availability to provide loans to clients. Funding In R$ Billion See more about Conta com Pontos in the following page
14.2 7%; 1.0 12%; 1.7 21.9 29.8 25.9 30.8 33.3 6.4 6%; 0.4 27%; 1.7 34%; 4.8 2019 2020 2021 2022 2Q22 1Q23 2Q23 Transac tional Accounts Balance 1 Time deposits 2 Securities issued Others3 Our all-in cost of funding was close to 63% of CDI in the quarter. Despite the increase in time deposits relatively to demand deposits, due to our new Conta com Pontos program, we were able to optimize yields and actually reduce the overall cost of funding. We expect our strong competitive advantage in terms of cost of funding to remain unchanged, given the nature of our funding mix.
All-in Cost of Funding In %, Annualized 7.6% 63.0% 4.8% 10.3% 58.1% 6.0% 12.4% 61.2%
7.6% 13.5% 13.7% 13.7% 13.7% 65.0% 63.5% 59.5% 63.3%
8.6% 8.1% 8.9% 8.6% 4Q 21 1Q22 2Q22 3Q22 4Q 22 1Q23 2Q23 Avg. CDI of Quarter All-in Cost of Funding All-in Cost of Funding % of CDI Note 1: Includes Conta com Pontos correspondent balance and demand deposits. Note 2: Excluding Conta com Pontos balance. Note 3: Includes saving deposits and creditors by resources to release. MA N A G E R I A L R E P O R T | 2 Q 2 3 10
2Q23 Highlights Strategic Updates Unit Economics Loan Portfolio Asset Quality Funding Capabilities
Financial Performance Capital Ratio Business Verticals ESG initiatives Appendix
Conta com Pontos
In Brazil, financial institutions are required to place a portion of clients deposits in a compulsory reserve at the Central Bank. These requirements vary depending on the type of deposit, with Demand Deposit reserves yielding zero and CD (as called CDBs or time deposits) reserves yield close to CDI.
In May, we innovated to bring our clients a new benefit that also changes the reserve requirements dynamics. Transactional account balances are now invested in CDs, and the yields are converted into points that are credited into clients’ accounts through Inter Loop.
As a result of the Conta com Pontos launch, a significant part of our demand deposits balance
moved to the time deposits, 1 decreasing the required compulsory reserves held at the Central
Bank. As a result, substantial resources have been freed up for re-allocation.
It is important to highlight that this new feature was only implemented by the end of the second quarter. Hence, the impacts of it in terms of the Financial Statements was mostly observed on the balance sheet. The full effect on revenues will be experienced starting by 3Q23. MA N A G E R I A L R E P O R T | 2 Q 2 3 11
2Q23 Highlights Strategic Updates Unit Economics Loan Portfolio Asset Quality Funding Capabilities
Financial Performance Capital Ratio Business Verticals ESG initiatives Appendix
Financial Performance Total Revenue Gross revenues had a record quarter, surpassing R$ 1.9 billion. As we continue to actively reprice our portfolio, together with leveraging up our capital structure, we expect this positive trend to continue in the coming quarters.
Net Interest Income Net Fee Revenue Total Net Revenue Total Gross Revenue Net Interest Income Our repricing process is evolving favorably, and as result our net interest margins expanded on a sequential basis reaching the highest NIM since 2020. To better explain these numbers, below we show our NIM with (1.0) and without (2.0) the credit card transactor balance, which yields no interest. NIM 1.0 - IEP + Non-int. CC Receivables1
In % 8.1% NIM 2.0 – IEP Only1 In % % 1Q22 2Q22 3Q22 Impacted by IPCA 4Q 22 1Q23 2Q23 1Q22 2Q22 3Q22 Impacted by IPCA 4Q 22 1Q23 2Q23 See more about the NIM methodology in our 2Q23 Historical Series Excel
Note 1: Adjusted NIM for the third quarter of 2022 is presented for illustrative purposes only and does not reflect our actual results. Adjusted NIM for the third quarter of 2022 has been adjusted as if the deflation in the third quarter of 2022 had actually been the average inflation projected for each quarter of 2023 in the Brazilian Central Bank Focus Report. MA N A G E R I A L R E P O R T | 2 Q 2 3 12
2Q23 Highlights Strategic Updates Unit Economics Loan Portfolio Asset Quality Funding Capabilities
Financial Performance Capital Ratio Business Verticals ESG initiatives Appendix
Fee Revenue Our net fees had an excellent quarter, increasing 11% and delivering another record. The higher growth was a result of the strong performance across multiple revenue lines.
Our fee income ratio remained relatively stable at 30.3% considering a balanced revenue growth between NII and fees.
Fee Income & Fee Income Ratio In R$ Million & In % of Total Net Revenues 34.8% 36.0% 34.7% 4 0 30.5% 30.3% 4 0% 3 50 3 0 290 316 295 327 313 348 3 0% 2 0% 10 % 0% 2 50 - 10 % 2 0 - 20 % 1Q22 2Q22 3Q22 4Q 22 1Q23 2Q23 Net fee income Fee Income Ratio A detailed description of the Financial Statements notes of Fees is shown below. Variation % 2Q23 1Q23 2Q22 ∆QoQ ∆YoY Description Net result from services and commissions Interchange 186 175 149 6% 24% Interchange from debit and credit cards Comission 117 133 134 -12% -13% Inter Shop, Seguros, Invest and Global Commissions
Banking 22 15 16 50% 35% Business Account fees and Credit underwriting fees Management (Inter DTVM & Asset) 13 14 11 -7% 17% Inter Invest management and admininstration fees Other 21 7 5 187% N/M Banking related commission fees Securities placement 5 6 8 -19% -36% DCM operation fees Total revenues from services and commissions 363 350 324 4% 12%
Cashback expense (58) (67) (85) -14% -32% Cashback expense from all products Inter Rewards (7) - - N/M N/M Inter Loop expenses excluding cost of funding Other expenses (32) (36) (34) -11% -7% Withdrawls, Real Estate commissioning and others
Total 267 247 205 8% 30% Other revenues
Performance 28 28 52 -1% -47% MasterCard, Liberty and B3 deals performance fees Capital gains (losses) 6 3 22 109% -73% Capital gains from earn outs Foreign exchange 26 15 26 76% 2% Exchange revenues, including USEND Other 21 20 11 6% 87% Other revenues Total 81 66 111 23% -27% Net Fee Income 348 313 316 11% 10% MA N A G E R I A L R E P O R T | 2 Q 2 3 13
2Q23 Highlights Strategic Updates Unit Economics Loan Portfolio Asset Quality Funding Capabilities
Financial Performance Capital Ratio Business Verticals ESG initiatives Appendix
Expenses Since 1Q23, we evolve in a series of cost control initiatives that are yielding strong results. We reduced headcount from 3.8 thousand March 31st, 2023 to 3.4 thousand as of June 30th, 2023. Regarding non personnel expenses, we remain highly focused on attacking the major expense line, with squads dedicated to each of the main expense items. Expenses Breakdown 1 In R$ Million 685 Total Expenses Share-based comp.2 M&A2 Expenses Excl. M&A & SBC Other3 Personnel4 D&A Advertising & marketing Data Processing5 4Q 21 1Q22 2Q22 3Q22 4Q 22 1Q23 2Q23 2Q23 1Q23 2Q22 ∆ Variation % Description Data processing and information technology 200 209 169 -4% 18% Data centers, cloud and systems maintenance, Personnel expenses 170 156 149 9% 14% Salaries and benefits (including Board) Others 119 140 134 -15% -12% Reimbursement, communication and portability Financial System services 8 17 13 -52% -38% Wire transfers and overdraft Depreciation and amortization 41 38 36 9% 16% Advertising and marketing 21 20 32 5% -35% Advertisement and public relations expenses Expenses Excl.M&A & SBC 559 579 533 -4% 5% Share based compensation 6 10 12 -41% -49% Stock options and share compensation M&A expenses 10 6 12 64% N/M Deferred M&A compensation related to USEND Total Expenses 575 596 557 -3% 3% Note 1: IFRS Financial Statements lines: “Personnel expenses”, “Depreciation and Amortization”, “Administrative Expenses”. Note 2: Share-based and M&A Expenses are included in Personnel Expenses in the Income Statement. Note 3: Others = third party services; rent, condominium fee and property maintenance; provisions for contingencies and Financial System services. Note 4: Personnel Expenses excluding Share-based and M&A Expenses. Salaries and benefits (including Board). Note 5: Data processing and information technology. MA N A G E R I A L R E P O R T | 2 Q 2 3
2Q23 Highlights Strategic Updates Unit Economics Loan Portfolio Asset Quality Funding Capabilities
Financial Performance Capital Ratio Business Verticals ESG initiatives Appendix
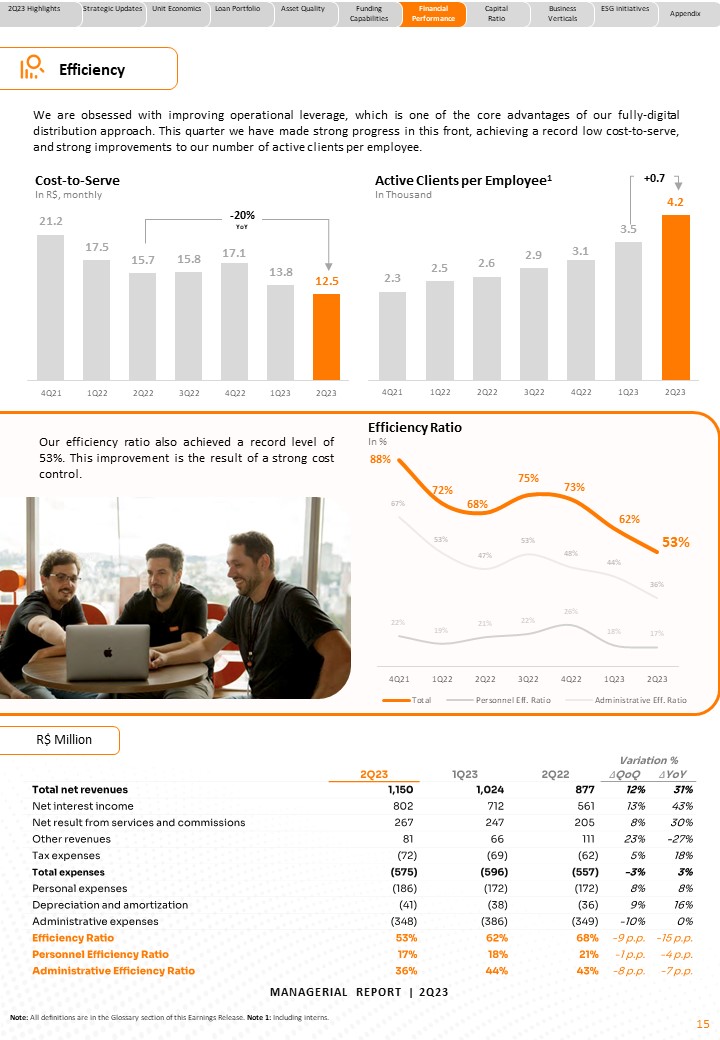
Efficiency We are obsessed with improving operational leverage, which is one of the core advantages of our full-digital distribution approach. This quarter we have made strong progress in this front, achieving a record low cost-to-serve, and strong improvements to our number of active clients per employee. Cost-to-Serve In R$, monthly 4Q 21 1Q22 2Q22 3Q22 4Q 22 1Q23 2Q23 4Q 21 1Q22 2Q22 3Q22 4Q 22 1Q23 2Q23 Our efficiency ratio also achieved a record level of 53%. This improvement is the result of a strong cost control. Efficiency Ratio In % 890% 8% 8 0% 7 0% 6 0% 64% 72% 49% 68% 75% 73% 48% 62% 53% 5 0% 43% 42% 40% 4 0% 3 0% 2 0% 22% 19% 21% 22% 26% 32% 18% 17% 10 % 4Q 21 1Q22 2Q22 3Q22 4Q 22 1Q23 2Q23
Total Pe rsonnel Eff. Ratio Administrative Eff. Ratio Variation % No 2Q23 1Q23 2Q22 ∆QoQ ∆YoY Total net revenues 1,150 1,024 877 12% 31% Net interest income 802 712 561 13% 43% Net result from services and 267 247 205 8% 30% commissions Other revenues 81 66 111 23% -27% Tax expenses (72) (69) (62) 5% 18% Total expenses (575) (596) (557) -3% 3% Personal expenses (186) (172) (172) 8% 8% Depreciation and amortization (41) (38) (36) 9% 16% Administrative expenses (348) (386) (349) -10% 0% Efficiency Ratio 53% 62% 68% -9 p.p. -15 p.p. Personnel Efficiency Ratio 17% 18% 21% -1 p.p. -4 p.p. Administrative Efficiency Ratio 32% 40% 43% -8 p.p. -10 p.p.te: All definitions are in the Glossary section of this Earnings Release. Note 1: Including interns. 15 N A G E R I A L R E P O R T | 2 Q 2 3
2Q23 Highlights Strategic Updates Unit Economics Loan Portfolio Asset Quality Funding Capabilities
Financial Performance Capital Ratio Business Verticals ESG initiatives Appendix
Net Income This quarter we reported record Net Income and EBT since IPO. This milestone reinforces our commitment to deliver a self-funded business plan from a capital perspective, creating organic capital through retained earnings.
We are accelerating in our path to profitability reaching the net income of R$ 64 million, combined with a pre-tax income of R$ 80 million in the 2Q23. A quarter of records Earning Before Tax & Net Income1 In R$ Million | Inter&Co 12 6 -20 80 EBT Net Income -111 -100 -70 29 24 16 23 (29) (30) (56) 4Q21 1Q22 2Q22 3Q22 4Q22 1Q23 2Q23 Note 1: Adjusted Net Income for the third quarter of 2022 is presented for illustrative purposes only and does not reflect our actual results. Adjusted Net Income for the third quarter of 2022 has been adjusted as if the deflation in the third quarter of 2022 had actually been the average inflation projected for each quarter of 2023 in the Brazilian Central Bank Focus Report.
MA N A G E R I A L R E P O R T | 2 Q 2 3 16
2Q23 Highlights Strategic Updates Unit Economics Loan Portfolio Asset Quality Funding Capabilities
Financial Performance Capital Ratio Business Verticals ESG initiatives Appendix
Capital Consumption Capital Ratio One of our key competitive advantages continues to be our strong capital base. Our regulatory capital is fully comprised of high quality Tier I, with no hybrid instruments. When we compare the 22.8% ratio recorded in the quarter relative to the top 5 Brazilian banks, we are at 2x their level. To maintain this advantage over time, we established a framework of ROE-driven policies based on return on allocated capital. This framework has led to an efficient use of capital and has resulted in the quarter with lowest capital consumption since 2020. Tier-I Ratio
In % 32.9% 29.8% 24.1% - 0.2 p.p. 23.0% 22.8% • Capital ratio purely comprised of high- quality core Tier I capital • Several opportunities to continue redeploying capital into loan growth • Approximately 2x the capital base of Brazil’s 5 largest banks: Tier-I Ratio
In % 22.8% ~2x 14.9% 14.7% 13.5% 12.6% 11.8% 2Q22 3Q22 4Q22 1Q23 2Q23 Inter Ba nk 1 Ba nk 2 Ba nk 3 Ba nk 4 Ba nk 5 Latest Tier-I of Brazil’s 5 Largest Banks RWA & Tier-I Ratio
In thousands & In % Variation % 2Q23 1Q23 2Q22 ∆QoQ ∆YoY Reference Equity - Tier I (RE) 5,960 5,829 7,081 2.2% -15.8% Core Capital (CC) 5,960 5,829 7,081 2.2% -15.8% Risk-Weighted Asset (RWA) 26,111 25,345 21,522 3.0% 21.3% Capital Requirement 4,831 4,689 3,982 3.0% 21.3% Margin on Capital Requirements 9,178 8,998 11,902 2.0% -22.9% Tier-I Ratio (RE/RWA) 22.8% 23.0% 32.9% -0.2 p.p. -10.1 p.p. Source: 2Q23 Banco Inter Bacen GAAP Financial Statements and companies’ Financial Statements.
MA N A G E R I A L R E P O R T | 2 Q 2 3 17
2Q23 Highlights Strategic Updates Unit Economics Loan Portfolio Asset Quality Funding Capabilities
Financial Performance Capital Ratio Business Verticals ESG initiatives Appendix
Our ecossystem
Through a simple and seamlessly integrated digital experience, our clients have access to a complete solution to manage their entire needs with a suite of commercial and financial products within a single Super App, which includes:
BANKING & SPENDING +197mm Cards + PIX TPV CREDIT +R$26bn Gross loan portfolio
SHOP R$756mm GMV 8.9% Net Take-Rate INVEST R$77bn AuC Strong AuC growth INSURANCE 344k Sales
High margin business GLOBAL 1.8mm Global Clients Brazilian diaspora as main focus LOYALTY
+3mm Clients Attractive new revenue stream Banking & Spending In the 2Q23, more than R$ 197 million transacted through our platform through PIX, debit and credit cards. This volume demonstrates our strong position in Banking and has a powerful effect on our ecosystem. In this quarter we saw a strong acceleration of TPV, specially in credit cards, reaching 26% growth in the annual comparison.
Cards + PIX TPV1 In R$ Billion 40 197 % YoY +47% +50% % QoQ +9% +9% 37 8 38% 0 1Q21 2Q21
3Q21 4Q 21 Debit 1Q22 2Q22 Cre dit 3Q22 PI X 4Q 22 1Q23 2Q23 +22% +26% +20% +6% +8% +5%
Note 1: Height of PIX volume was reduced to fit on page. MA N A G E R I A L R E P O R T | 2 Q 2 3 18
2Q23 Highlights Strategic Updates Unit Economics Loan Portfolio Asset Quality Funding Capabilities
Financial Performance Capital Ratio Business Verticals ESG initiatives Appendix
Loyalty We launched our seventh vertical this quarter called Loyalty. Through Inter Loop, we are using our robust banking structure as the backbone of our new rewards program and connecting all verticals to offer multiple options to clients burn their program points. Our new vertical, which already has more than 3 million clients, represents a strong potential of cross-selling, ARPAC, engagement and monetization. Inter Shop Inter Shop continues to be one of Inter’s greatest innovations. We reached 2.7 million active clients in the 2Q, and continued to improve the pricing power, delivering a record net take rate of 8.9%. Inter Invest We increased our client base to 3.6 million in 2Q23, while our AuC reached R$ 77 billion. 3rd party fixed income distribution continues to be an important growth driver, reaching more than R$7.5 billion in funds, representing a 69% YoY increase. Inter Seguros We believe Inter Seguros products enable us to go further with our engagement and cross-selling power. The number of active insurance contracts reached 1.5 million and has generated more than R$ 38 million in net revenue. Inter Global Our global vertical has experienced strong success. More than 5 thousands accounts were opened per business day in 2Q23, resulting in close to 1.8 million clients. We launched the plastic debit card to allow withdrawals and purchases abroad, providing more convenience and value to our clients. Note 1: Includes Brazilian Global Account clients, US clients and International Investors. Active Clients & Net Take-Rate In Million & In % Inter Shop Active Clients Active Clients & AuC
In Million & In R$ Billion 3.6 2.2 76.8 54.6 2Q22 2Q23 Inter Invest Active Clients
Active Contracts & Net revenue In Million & R$ Million 90 .0 Global Services Clients1
In Thousand 1,782 19 MA N A G E R I A L R E P O R T | 2 Q 2 3
2Q23 Highlights Strategic Updates Unit Economics Loan Portfolio Asset Quality Funding Capabilities
Financial Performance Capital Ratio Business Verticals ESG initiatives Appendix
ESG initiatives The integration of the ESG agenda occurs both by mapping risks and opportunities observed in Inter&Co’s materiality and monitoring the sustainability ratings, which consider the materiality of each institution. Among the commitments to eco-efficiency, another evolution was achieving grade B- with the Carbon Disclosure Project (CDP), with which Inter has been engaged since 2020 and seeks continuous improvement. Carbon Disclosure Project (CDP) Water consumption per client1 Carbon footprint per client1 2021 2022 Energy consumption per client1 Eco-Efficient 84% +90% of our energy matrix comes from renewable sources In Corporate Governance, Inter Group is committed to sustainable management. In 2023, our Board of Directors became composed of 50% independent members and increased gender participation with the addition of one more woman as an independent Board member.
We also launched the Sustainable Life section in the Super App. This innovative section offers day- to-day life tools that can help clients have more sustainable behaviors. We also expanded our offering of ESG funds. We launched our 2022 Annual Report. To see more about Inter&Co ESG initiatives, click here to access the full report. Note 1: In comparison to traditional banks business model. MA N A G E R I A L R E P O R T | 2 Q 2 3 20
2Q23 Highlights Strategic Updates Unit Economics Loan Portfolio Asset Quality Funding Capabilities
Financial Performance Capital Ratio Business Verticals ESG initiatives Appendix
Balance Sheet Appendix R$ Million Variation % 06/30/2023 06/30/2022 ∆YoY
Balance Sheet Assets Cash and cash equivalents 3,672 1,549 137% Amounts due from financial institutions 2,557 1,825 40% Compulsory deposits 1,704 2,581 -34% Securities 14,170 12,710 11% Derivative financial instruments 4 3 13% Net loans and advances to customers 23,524 18,510 27% Non-current assets held-for-sale 177 161 10% Equity accounted investees 72 81 -11% Property and equipment 179 201 -11% Intangible assets 1,303 1,190 10% Deferred tax assets 940 932 1%
Other assets 1,701 1,191 43% Total assets 50,003 40,934 22%
Liabilities Liabilities with financial institutions 8,024 6,945 16%
Liabilities with clients 26,299 19,746 33% Securities issued 7,006 6,104 15%
Derivative financial liabilities 28 66 -58% Other liabilities 1,328 957 39%
Total Liabilities 42,686 33,818 26% Equity Total shareholder's equity of controlling shareholders 7,204 7,034 2% Non-controlling interest 114 81 40%
Total shareholder's equity 7,318 7,115 3% Total liabilities and shareholder's equity 50,003 40,934 22% MA N A G E R I A L R E P O R T | 2 Q 2 3 21
2Q23 Highlights Strategic Updates Unit Economics Loan Portfolio Asset Quality Funding Capabilities
Financial Performance Capital Ratio Business Verticals ESG initiatives Appendix
Income Statement Appendix R$ Million 2Q23 2Q22 Variation % ∆YoY Income Statement
Interest income from loans 1,151 622 85% Interest expenses (692) (465) 49% Income from securities and derivatives 343 404 -15% Net interest income 802 561 43% Revenues from services and commissions 299 239 25% Expenses from services and commissions (32) (34) -7% Other revenues 81 111 -27% Revenue 1,150 877 31% Impairment losses on financial assets (399) (242) 64% Net result of losses 751 635 18%
Administrative expenses (348) (349) 0% Personnel expenses (186) (172) 8% Tax expenses (72) (62) 18%
Depreciation and amortization (41) (36) 16%
Income from equity interests in affiliates (23) (4) N/M
Profit / (loss) before income tax 80 12 N/M
Income tax and social contribution (16) 4 N/M Profit / (loss) 64 16 N/M MA N A G E R I A L R E P O R T | 2 Q 2 3 22
2Q23 Highlights Strategic Updates Unit Economics Loan Portfolio Asset Quality Funding Capabilities
Financial Performance Capital Ratio Business Verticals ESG initiatives Appendix
Glossary | Operational definitions Appendix Active clients:
We define an active client as a customer at any given date that was the source of any amount of revenue for us in the preceding three months, or/and a customer that used products in the preceding three months. For Inter insurance, we calculate the number of active clients for our insurance brokerage vertical as the number of beneficiaries of insurance policies effective as of a particular date. For Inter Invest, we calculate the number of active clients as the number of individual accounts that have invested on our platform over the applicable period. Active clients per employee: Number of active clients at the end of the quarter Total number of employees at the end of the quarter, including interns Activation rate: Card+PIX TPV: Number of active clients at the end of the quarter Total number of clients at the end of the quarter PIX, debit and credit cards and withdrawal transacted volumes of a given period. PIX is a Central Bank of Brazil solution to bring instant payments among banks and financial institutions in Brazil.
Card+PIX TPV per active client:
Card+PIX TPV for a given period divided by the number of active clients as of the last day of the period.
Client acquisition cost (CAC):
The average cost to add a client to the platform, considering operating expenses for opening an account, such as onboarding personnel, embossing and sending cards and digital marketing expenses with a focus on client acquisition, divided by the number of accounts opened in the quarter.
Gross merchandise volume (GMV):
Gross merchandise value, or GMV, for a given period as the total value of all sales made or initiated through our Inter Shop & Commerce Plus platform managed by Inter Shop & Commerce Plus. Gross take rate: Inter Shop gross revenue GMV Net take rate: Inter Shop net revenue GMV Primary banking relationship: A client who has 50% or more of their income after tax for that period flowing to their bank account with us during the month. MA N A G E R I A L R E P O R T | 2 Q 2 3 23
2Q23 Highlights Strategic Updates Unit Economics Loan Portfolio Asset Quality Funding Capabilities
Financial Performance Capital Ratio Business Verticals ESG initiatives Appendix
Glossary | Financial measures reconciliation Appendix Administrative efficiency ratio:
█( @Administrative expenses+Depreciation and amortization)/(Net Interest Income+Net result from services and comissions+Other revenue−Tax expense) Annualized interest rates: Yearly rate calculated by multiplying the quarterly interest by four, over the average portfolio of the last two quarters. All-in loans rate considers Real Estate, Payroll +FGTS, SMBs, Credit Card, excluding non-interest earnings credit card receivables, and Anticipation of Credit Card Receivables. Antecipation of credit card receivables: Disclosed in note 9.a of the Financial Statements, line " "Loans to financial institutions”. ARPAC gross of interest expenses: (Interest income + (Revenue from services and comissions − Cashback − Inter rewards) + Income from securities and derivarives + Other revenue) ÷ 3 Average of the last 2 quarters Active Clients ARPAC net of interest expenses: (Revenue − Interest expenses) ÷ 3 Average of the last 2 quarters Active Clients ARPAC per quarterly cohort: Total Gross revenue net of interest expenses in a given cohort divided by the average number of active clients in the current and previous periods1. Cohort is defined as the period in which the client started his relationship with Inter. 1 - Average number of active clients in the current and previous periods: For the first period, is used the total number of active clients in the end of the period. Assets under custody (AuC): We calculate assets under custody, or AUC, at a given date as the market value of all retail clients’ assets invested through our investment platform as of that same date. We believe that AUC, as it reflects the total volume of assets invested in our investment platform without accounting for our operational efficiency, provides us useful insight on the appeal of our platform. We use this metric to monitor the size of our investment platform. Card fee revenue: It is part of the “Revenue from services and commission” and “Other revenue” on IFRS Income Statement.
Cost of funding: Interest expenses × 4 Average of last 2 quarters Interest bearing liabilities (demand deposits, time deposits, savings deposits, creditors by resources to release and securities issued) MA N A G E R I A L R E P O R T | 2 Q 2 3 24
2Q23 Highlights Strategic Updates Unit Economics Loan Portfolio Asset Quality Funding Capabilities
Financial Performance Capital Ratio Business Verticals ESG initiatives Appendix
Cost of risk:Impairment losses on ginancial assets × 4 Average of last 2 quarters of Loans and advances to customers Cost of risk excluding anticipation of credit card receivables: Impairment losses on ginancial assets × 4 Average of last 2 quarters of Loans and advances to customers excluding anticipation of credit card receivables Cost of risk excluding credit card: Impairment losses on ginancial assets × 4 Average of last 2 quarters of Loans and advances to customers excluding credit card Cost-to-serve (CTS): (Personnel Expense + Administrative Expenses − Total CAC) ÷ 3 Average of the last 2 quarters Active Clients Coverage ratio: Provision for expected credit loss Overdue higher than 90 days Earning portfolio (IEP): Earnings Portfolio includes “Amounts due from financial institutions” + “Loans and advances to customers” + “Securities” + “Derivatives” from the IFRS Balance Sheet. Efficiency ratio: Personnel expense + Administrative expenses + Depreciation and amortization Net Interest Income + Net result from services and comissions + Other revenue − Tax expense Fee income ratio: Net result from services and commissions + Other revenue Net Interest Income + Net result from services and comissions + Other revenue − Tax expense Funding: Demand Deposits + Time Deposits + Securities Issued + Savings Deposits + Creditors by Resources to Release MA N A G E R I A L R E P O R T | 2 Q 2 3 25
2Q23 Highlights Strategic Updates Unit Economics Loan Portfolio Asset Quality Funding Capabilities
Financial Performance Capital Ratio Business Verticals ESG initiatives Appendix
Glossary | Financial measures reconciliation
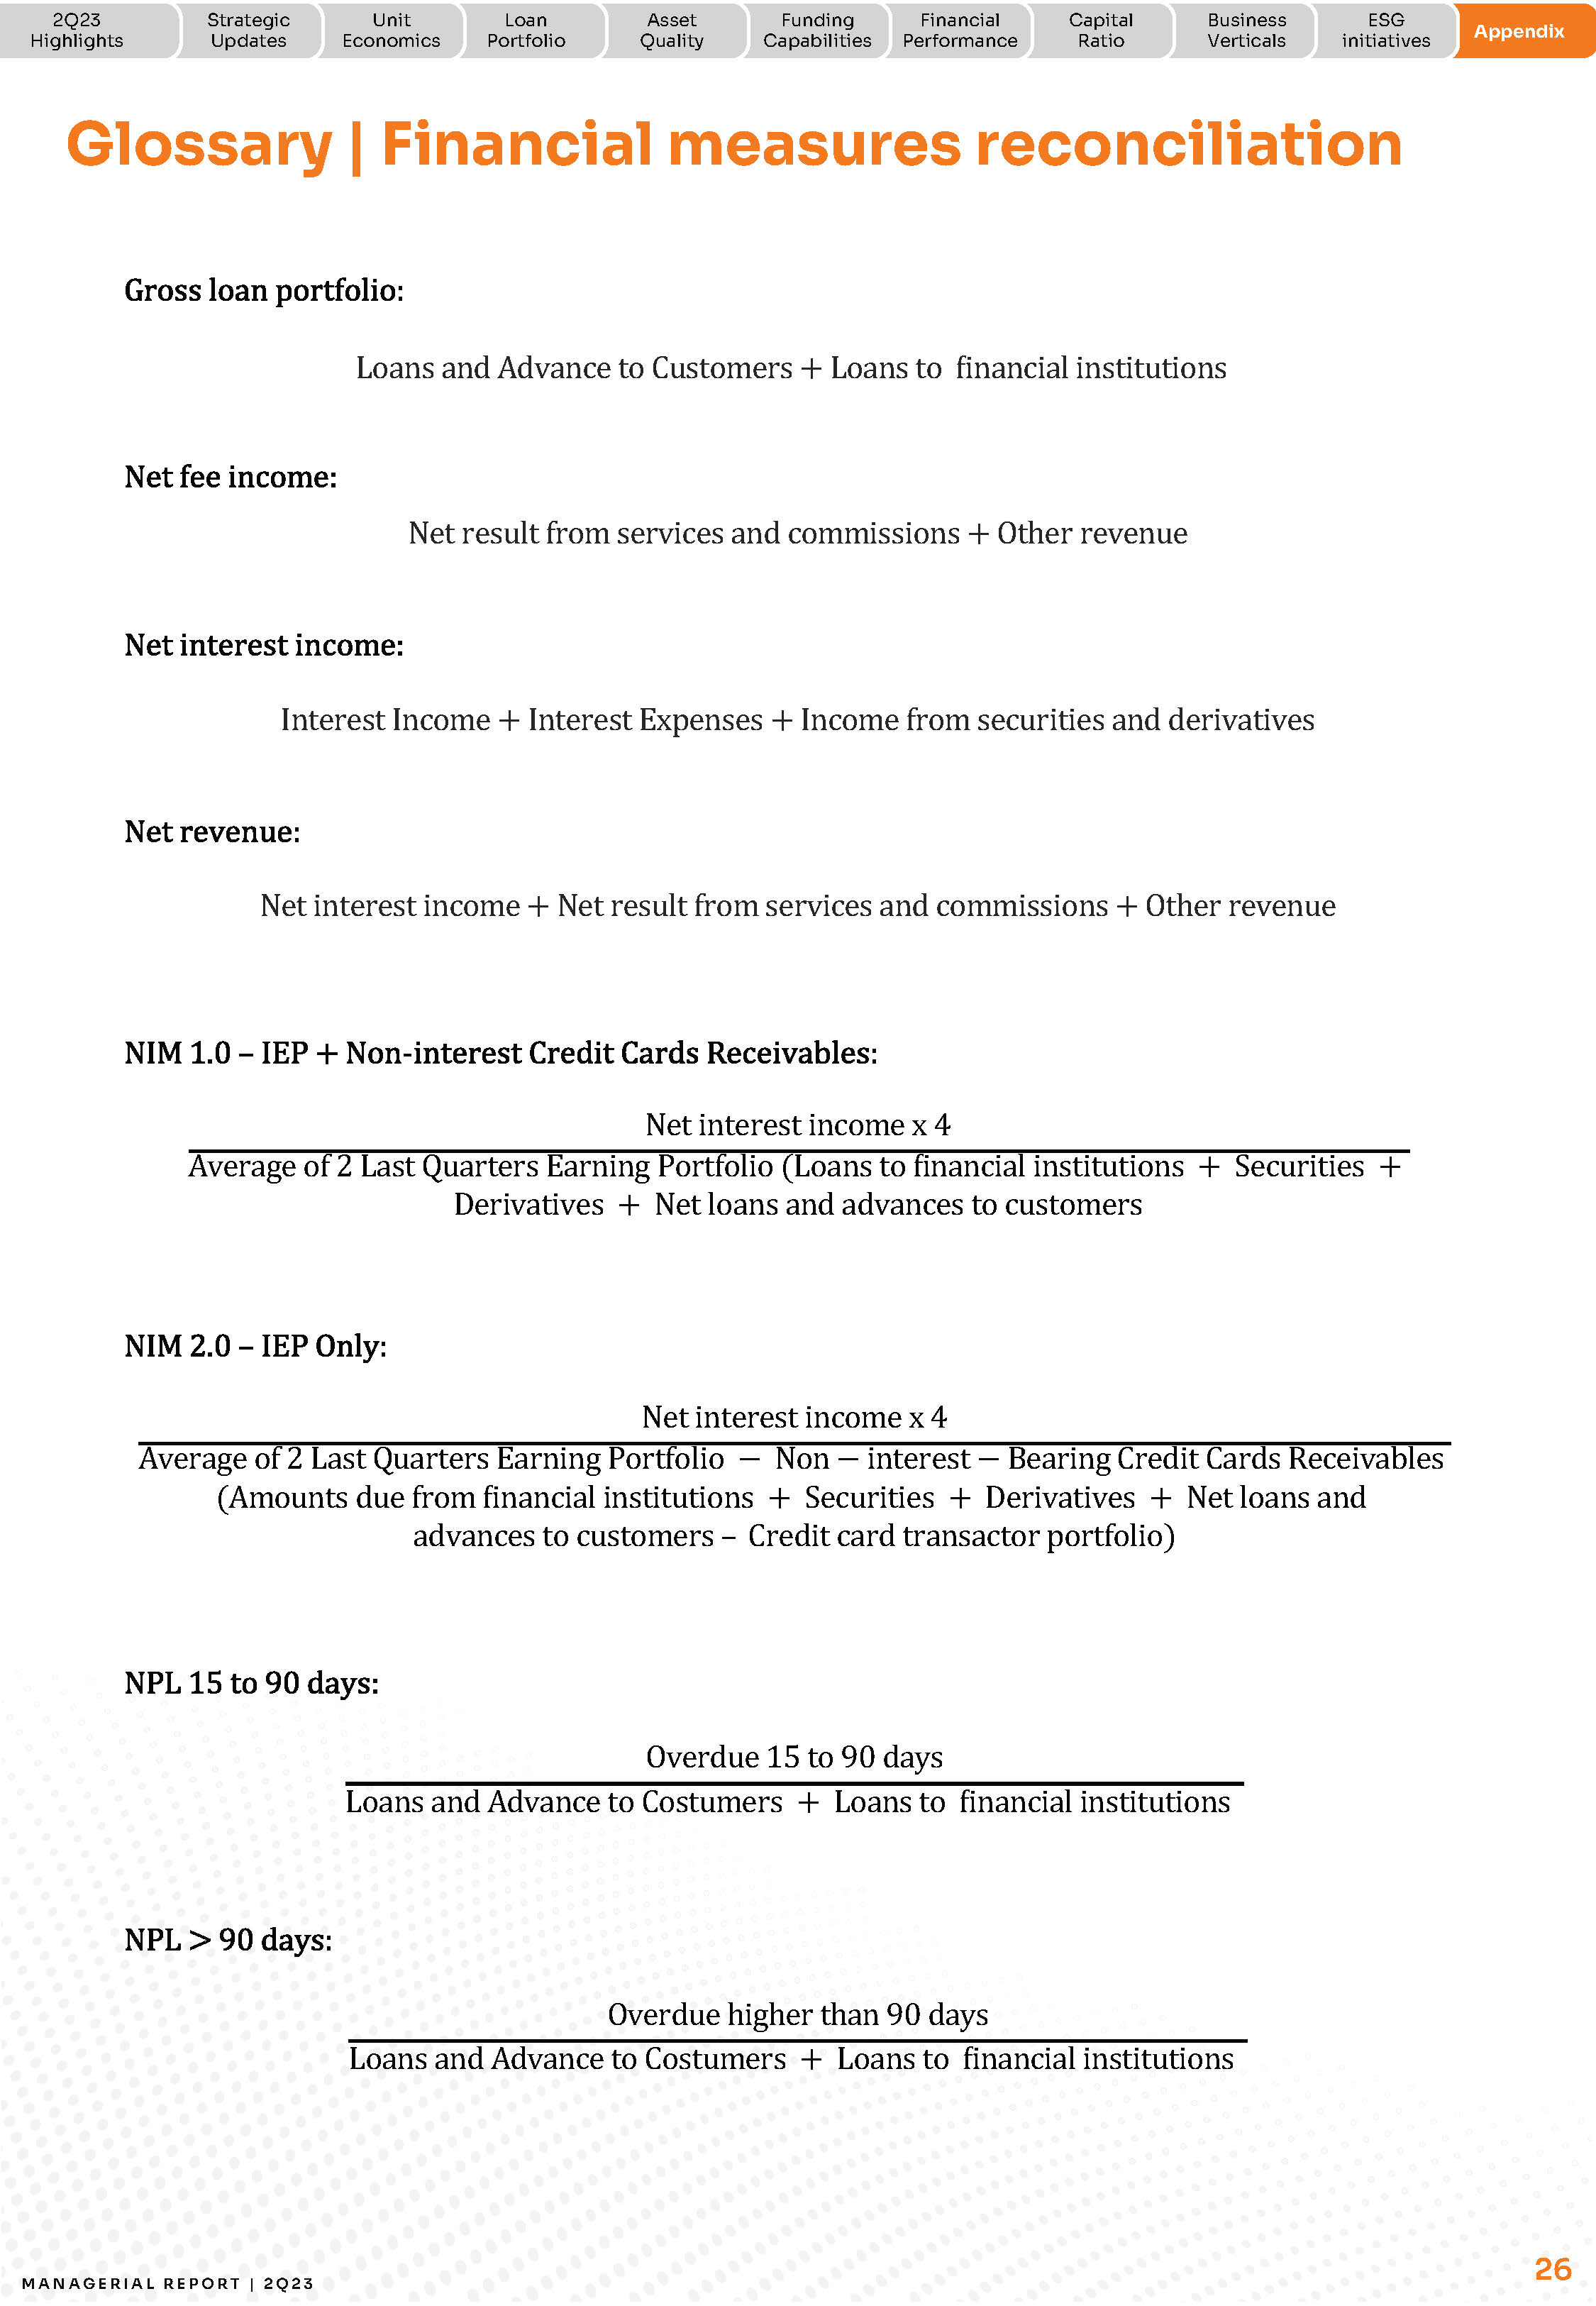
Appendix Gross loan portfolio: Loans and Advance to Customers + Loans to ginancial institutions
Net fee income: Net result from services and commissions + Other revenue Net interest income:
Interest Income + Interest Expenses + Income from securities and derivatives Net revenue:
Net interest income + Net result from services and commissions + Other revenue NIM 1.0 – IEP + Non-interest Credit Cards Receivables: Net interest income x 4 Average of 2 Last Quarters Earning Portfolio (Loans to ginancial institutions + Securities + Derivatives + Net loans and advances to customers NIM 2.0 – IEP Only: Net interest income x 4 Average of 2 Last Quarters Earning Portfolio − Non − interest − Bearing Credit Cards Receivables (Amounts due from ginancial institutions + Securities + Derivatives + Net loans and advances to customers – Credit card transactor portfolio)
NPL 15 to 90 days: Overdue 15 to 90 days
Loans and Advance to Costumers + Loans to ginancial institutions
NPL > 90 days: Overdue higher than 90 days
Loans and Advance to Costumers + Loans to ginancial institutions
MA N A G E R I A L R E P O R T | 2 Q 2 3 26
2Q23 Highlights Strategic Updates Unit Economics Loan Portfolio Asset Quality Funding Capabilities
Financial Performance Capital Ratio Business Verticals ESG initiatives Appendix
Glossary | Financial measures reconciliation
Appendix NPL formation: Overdue balance higher than 90 days in the current quarter – Overdue balance higher than 90 days in the previous quarter + Write − off change in the current quarter
Total loans and advance to customers in the previous quarter
Personal efficiency ratio: Personnel expense Net Interest Income + Net result from services and comissions + Other revenue − Tax expense Return on average equity (ROE):
(Progit / (loss) for the quarter)× 4 Average of last 2 quarters of total shareholder`s equity
Stage 3 formation: Stage 3 balance in the current quarter – Stage 3 balance in the previous quarter
+Write − off change in the current quarter Total loans and advance to customers in the previous quarter Tier I ratio: Total gross revenue: Tier I referential equity Risk weighted assets
Interest income + Revenue from services and commissions − Cashback expenses − Inter rewards
+ Income from securities and derivatives + Other revenue MA N A G E R I A L R E P O R T | 2 Q 2 3 27
This report may contain forward-looking statements regarding Inter, anticipated synergies, growth plans, projected results and future strategies. While these forward-looking statements reflect our Management’s good faith beliefs, they involve known and unknown risks and uncertainties that could cause the company’s results or accrued results to differ materially from those anticipated and discussed herein. These statements are not guarantees of future performance. These risks and uncertainties include, but are not limited to, our ability to realize the amount of projected synergies and the projected schedule, in addition to economic, competitive, governmental and technological factors affecting Inter, the markets, products and prices and other factors. In addition, this presentation contains managerial numbers that may differ from those presented in our financial statements. The calculation methodology for these managerial numbers is presented in Inter’s quarterly earnings release. Statements contained in this report that are not facts or historical information may be forward-looking statements under the terms of the Private Securities Litigation Reform Act of 1995. These forward-looking statements may, among other things, beliefs related to the creation of value and any other statements regarding Inter. In some cases, terms such as “estimate”, “project”, “predict”, “plan”, “believe”, “can”, “expectation”, “anticipate”, “intend”, “aimed”, “potential”, “may”, “will/shall” and similar terms, or the negative of these expressions, may identify forward looking statements. These forward-looking statements are based on Inter's expectations and beliefs about future events and involve risks and uncertainties that could cause actual results to differ materially from current ones. Any forward-looking statement made by us in this document is based only on information currently available to us and speaks only as of the date on which it is made. We undertake no obligation to publicly update any forward- looking statement, whether written or oral, that may be made from time to time, whether as a result of new information, future developments or otherwise. For additional information that about factors that may lead to results that are different from our estimates, please refer to sections “Cautionary Statement Concerning Forward-Looking Statements” and “Risk Factors” of Inter&Co Annual Report on Form 20-F. The numbers for our key metrics (Unit Economics), which include active users, as average revenue per active client (ARPAC), cost to serve (CTS), are calculated using Inter’s internal data. Although we believe these metrics are based on reasonable estimates, but there are challenges inherent in measuring the use of our business. In addition, we continually seek to improve our estimates, which may change due to improvements or changes in methodology, in processes for calculating these metrics and, from time to time, we may discover inaccuracies and make adjustments to improve accuracy, including adjustments that may result in recalculating our historical metrics.
About Non-IFRS Financial Measures To supplement the financial measures presented in this press release and related conference call, presentation, or webcast in accordance with IFRS, Inter&Co also presents non-IFRS measures of financial performance, as highlighted throughout the documents. The non-IFRS Financial Measures include, among others: Adjusted Net Income, Cost to Serve, Cost of Funding, Efficiency Ratio, Underwriting, NPL > 90 days, NPL 15 to 90 days, NPL and Stage 3 Formation, Cost of Risk, Coverage Ratio, Funding, All-in Cost of Funding, Gross Merchandise Volume (GMV), Premiuns, Net Inflows, Global Services Deposits and Investments, Fee Income Ratio, Client Acquisition Cost, Cards+PIX TPV, Gross ARPAC, Net ARPAC, Marginal NIM 1.0, Marginal NIM 2.0, Net Interest Margin IEP + Non-int. CC Receivables (1.0), Net Interest Margin IEP (2.0), Cost-to-Serve. A “non-IFRS financial measure” refers to a numerical measure of Inter&Co’s historical or financial position that either excludes or includes amounts that are not normally excluded or included in the most directly comparable measure calculated and presented in accordance with IFRS in Inter&Co’s financial statements. Inter&Co provides certain non-IFRS measures as additional information relating to its operating results as a complement to results provided in accordance with IFRS. The non-IFRS financial information presented herein should be considered together with, and not as a substitute for or superior to, the financial information presented in accordance with IFRS. There are significant limitations associated with the use of non-IFRS financial measures. Further, these measures may differ from the non-IFRS information, even where similarly titled, used by other companies and therefore should not be used to compare Inter&Co’s performance to that of other companies.
Grafico Azioni Inter (NASDAQ:INTR)
Storico
Da Apr 2024 a Mag 2024

Grafico Azioni Inter (NASDAQ:INTR)
Storico
Da Mag 2023 a Mag 2024
