0000890447
false
0000890447
2023-08-09
2023-08-09
iso4217:USD
xbrli:shares
iso4217:USD
xbrli:shares
UNITED STATES
SECURITIES AND EXCHANGE COMMISSION
Washington, D.C. 20549
FORM 8-K
CURRENT REPORT
Pursuant to Section 13 or 15(d) of the Securities Exchange
Act of 1934
Date of Report (Date of Earliest Event
Reported): August 9, 2023
VERTEX ENERGY, INC.
(Exact name of registrant as specified in its charter)
| Nevada |
001-11476 |
94-3439569 |
(State or other jurisdiction of
incorporation) |
(Commission File Number) |
(IRS Employer
Identification No.) |
|
1331 Gemini Street
Suite 250
Houston, Texas |
77058 |
| (Address of principal executive offices) |
(Zip Code) |
Registrant’s telephone number, including area
code: (866) 660-8156
Check the appropriate box below if the Form 8-K filing
is intended to simultaneously satisfy the filing obligation of the registrant under any of the following provisions:
| ☐ |
Written communications pursuant to Rule 425 under the Securities Act (17 CFR 230.425) |
| |
|
| ☐ |
Soliciting material pursuant to Rule 14a-12 under the Exchange Act (17 CFR 240.14a-12) |
| |
|
| ☐ |
Pre-commencement communications pursuant to Rule 14d-2(b) under the Exchange Act (17 CFR 240.14d-2(b)) |
| |
|
| ☐ |
Pre-commencement communications pursuant to Rule 13e-4(c) under the Exchange Act (17 CFR 240.13e-4(c)) |
Securities registered pursuant to Section 12(b) of
the Act:
| Title of each class |
Trading Symbol(s) |
Name of each exchange on which registered |
|
Common Stock,
$0.001 Par Value Per Share |
VTNR |
The NASDAQ
Stock Market LLC
(Nasdaq Capital Market) |
Indicate by check mark whether the registrant is an
emerging growth company as defined in Rule 405 of the Securities Act of 1933 (§230.405 of this chapter) or Rule 12b-2 of the Securities
Exchange Act of 1934 (§240.12b-2 of this chapter).
Emerging growth company ☐
If an emerging growth company, indicate by check mark
if the registrant has elected not to use the extended transition period for complying with any new or revised financial accounting standards
provided pursuant to Section 13(a) of the Exchange Act. ☐
| Item 2.02 |
Results of Operations and Financial Condition. |
On
August 9, 2023, Vertex Energy, Inc. (“Vertex” or the “Company”) issued a press release and will
hold a conference call regarding its financial results for the three and six months ended June 30, 2023. A copy of the press release,
which includes information on the conference call and a summary of such financial results is furnished as Exhibit 99.1 to
this Form 8-K and incorporated herein by reference. Additionally, a copy of a presentation which will be discussed on the earnings call
is furnished as Exhibit 99.2 to this Form 8-K and is incorporated herein by reference, and has also been posted
to the Company’s website at https://www.vertexenergy.com/presentation, although the Company reserves the right to discontinue that
availability at any time.
The
information contained in this Current Report and Exhibits 99.1 and 99.2 hereto shall not be deemed “filed”
for purposes of Section 18 of the Securities Exchange Act of 1934, as amended (the “Exchange Act”) or otherwise subject
to the liabilities of that section, nor shall they be deemed incorporated by reference in any filing under the Securities Act of 1933,
as amended or the Exchange Act, except as expressly set forth by specific reference in such a filing.
The Company is making reference
to non-GAAP financial information in the press release, presentation, and the conference call. A reconciliation of these non-GAAP financial
measures to the comparable GAAP financial measures is contained in the attached press release and presentation.
| Item 9.01 |
Financial Statements and Exhibits. |
| Exhibit No. |
|
Description |
|
| |
|
|
|
| 99.1* |
|
Press Release of Vertex Energy, Inc., dated August 9, 2023 |
| 99.2* |
|
Second Quarter 2023 Earnings Call Presentation |
| 104 |
|
Inline XBRL for the cover page of this Current Report on Form 8-K |
* Furnished herewith.
The inclusion of any website
address in this Form 8-K, and any exhibit thereto, is intended to be an inactive textual reference only and not an active hyperlink. The
information contained in, or that can be accessed through, such website is not part of or incorporated into this Form 8-K.
Forward-Looking Statements
This Current Report on Form 8-K,
including the press release and presentation furnished as Exhibits 99.1 and 99.2,
respectively, to this Current Report on Form 8-K, contains forward-looking statements
within the meaning of the federal securities laws, including the Private Securities
Litigation Reform Act of 1995, and, as such, may involve known and unknown risks, uncertainties and assumptions. You can identify
these forward-looking statements by words such as “may,” “should,” “expect,”
“anticipate,” “believe,” “estimate,” “intend,” “plan”
and other similar expressions. These forward-looking statements relate to the Company’s
current expectations and are subject to the limitations and qualifications set forth in the press release and presentation as well as
in the Company’s other filings with the Securities and Exchange Commission, including, without limitation, that actual events and/or
results may differ materially from those projected in such forward-looking statements. These statements also involve known and unknown
risks, which may cause the results of the Company, its divisions and concepts to be materially different than those expressed
or implied in such statements, including those referenced in the press release. Accordingly,
readers should not place undue reliance on any forward-looking statements. Forward-looking statements may include comments as to the Company’s
beliefs and expectations as to future financial performance, events and trends affecting its business and are necessarily subject to uncertainties,
many of which are outside the Company’s control. More information on potential factors that could affect the Company’s financial
results is included from time to time in the “Cautionary Statement Regarding Forward-Looking Statements,” “Risk
Factors” and “Management’s Discussion and Analysis of Financial Condition and Results of Operations”
sections of the Company’s most recently filed periodic reports on Form 10-K and Form 10-Q and subsequent filings with the SEC and
available at www.sec.gov and in the “Investor Relations” – “SEC Filings”
section of the Company’s website at www.vertexenergy.com. Forward-looking statements speak only as of the date
they are made. The Company undertakes no obligation to publicly update or revise any forward-looking statements, whether as a result of
new information, future events or otherwise that occur after that date, except as otherwise provided by law.
SIGNATURES
Pursuant to the requirements of the Securities Exchange Act of 1934, the
registrant has duly caused this report to be signed on its behalf by the undersigned hereunto duly authorized.
| |
VERTEX ENERGY, INC. |
| |
|
| Date: August 9, 2023 |
By: |
/s/ Chris Carlson |
| |
|
Chris Carlson |
| |
|
Chief Financial Officer |
VERTEX ENERGY, INC. 8-K
EXHIBIT 99.1
Vertex Energy Announces Second Quarter 2023
Results
HOUSTON, TX / BUSINESSWIRE / August 9, 2023 / Vertex Energy, Inc. (NASDAQ:
VTNR) (“Vertex” or the “Company”), a leading specialty refiner and marketer of high-quality refined products,
today announced its financial results for the second quarter ended June 30, 2023.
The Company will host a conference call to discuss
second quarter 2023 results today at 8:30 A.M. Eastern Time, details are included at the end of this release.
SECOND QUARTER 2023 HIGHLIGHTS
| ● | Reported net loss attributable to common shareholders of $(81.4) million,
or $(1.03) per basic share |
| ● | Reported Adjusted EBITDA of $(34.2) million |
| ● | Continued safe operation of the Company’s Mobile, Alabama refinery
(the “Mobile Refinery”) with second quarter 2023 conventional throughput of 76,330 barrels per day (bpd), above prior guidance |
| ● | Renewable diesel (RD) facility repair and start-up successfully completed
with targeted Phase I throughput capacity of 8,000 bpd demonstrated during the quarter |
| ● | Lower conventional refining margins driven by weakness in market prices for
refined fuels and additional costs incurred during RD repair and start-up procedure |
| ● | Total cash and cash equivalents of $52.1 million including restricted cash
of $3.6 million as of June 30, 2023 |
Vertex reported second quarter 2023 net loss attributable
to common shareholders of $(81.4) million, or $(1.03) per basic share, versus a net loss attributable to common shareholders of $(67.0)
million, or $(0.99) per basic share for the second quarter of 2022. Adjusted EBITDA (see “Non-GAAP Financial Measures”, below)
was $(34.2) million for the second quarter 2023, compared to Adjusted EBITDA of $71.3 million in the prior-year period. Financial results
for the second quarter of 2023 include a non-cash, one-time interest expense in the amount of $63.0 million related to the recent privately
negotiated exchange of approximately $79.9 million of Vertex’s Senior Secured 6.25% Convertible Notes Due 2027, which closed on
June 12, 2023. Schedules reconciling the Company’s generally accepted accounting principles in the United States (“GAAP”)
and non-GAAP financial results, including Adjusted EBITDA are included later in this release (see also “Non-GAAP Financial Measures”,
below).
MANAGEMENT COMMENTARY
“During the second quarter, we made considerable
progress in developing our broader strategic vision of creating a vertically integrated renewable fuels company,” stated Benjamin
P. Cowart, President and CEO of Vertex, who continued, “While short-term profitability on the conventional fuels refining business
was negatively impacted by a combination of deterioration in market conditions and the added expense associated with the start-up of our
renewable diesel facility, we successfully achieved several important strategic milestones through establishing RD production, accelerating
our feedstock strategy, and improving balance sheet efficiency, which we believe will help drive greater long-term shareholder value for
the company.”
SEGMENT PERFORMANCE
MOBILE REFINERY OPERATIONS
The Mobile Refinery operations generated a gross
profit (loss) of ($6.4) million and $52.7 million of fuel gross margin (a non-GAAP measure) or $7.34 per barrel during the second quarter
2023, versus generating a gross profit of $65.5 million, and fuel gross margin (a non-GAAP measure) of $103.8 million, or $16.17 per barrel
of fuel gross margin in the first quarter of 2023. Adjusting for the impact of $3.66 of Renewable Identification Number (RIN) expense
per barrel, RIN adjusted fuel gross margin at the Mobile Refinery was $27.3 million, or $3.68 per barrel for the second quarter of 2023,
versus $87.7 million, or $13.66 per barrel of RIN adjusted fuel gross margin in the first quarter of 2023. On an adjusted fuel gross margin
per barrel basis, including the impact of renewable diesel production, the Mobile Refinery captured 31% of the Gulf Coast 2-1-1 crack
spread. Adjusting for the partial production period of renewable diesel and limited revenue contribution during the quarter, the Mobile
Refinery generated a conventional only fuel gross margin per barrel of 34%.
The decline in adjusted fuel gross margin per
barrel and resulting deterioration in reported capture rate of the benchmark Gulf Coast 2-1-1 crack spread was attributed to a decline
in margins for refined products, compounded by approximately $20 million of one-time expenses incurred as a result of the repair and resumed
start-up procedures of the Company’s renewable diesel facility during the quarter. The benchmark Gulf Coast 2-1-1 crack spread decreased
from $31.59 per barrel in the first quarter of 2023 to $23.60 in the second quarter, while pricing for refined products outside of the
benchmark crack spread, such as Jet fuel, which experienced significant pressure during the second quarter of 2023.
Financial results for the Mobile Refinery reported
for the second quarter of 2023 reflect the combined contribution of conventional fuels refining operations, as well as the operation of
the Company’s renewable diesel facility which began production on May 27th. The partial production period and limited
revenue recorded from the renewable diesel facility, compounded by the additional expenses incurred for the repair of feedstock pumping
systems, as well as typical one-time start-up expenses, had a disproportionate negative impact on overall refining profitability during
the quarter and we believe this does not reflect the state of operating profitability for the facility longer-term.
Total throughput at the Mobile Refinery was 78,820
bpd in the second quarter of 2023, including 76,330 bpd of conventional and 2,490 bpd of renewable throughput, respectively. Total production
of finished high-value, light products, such as gasoline, diesel and jet fuel, represented approximately 61% of the total production in
the second quarter of 2023, vs. 62% in the first quarter 2023, as anticipated. Changes in the Company’s product yield profile have
led to a higher percentage of products not accounted for in the benchmark Gulf Coast 2-1-1 crack spread. Consequently, this has caused
the reported capture rate of the benchmark crack spread to vary significantly.
Third Quarter 2023 Mobile Refinery Financial
and Operating Results ($/millions unless otherwise noted)
SEGMENT PERFORMANCE
| |
1Q23 |
2Q23 |
2023 YTD |
|
%Q/Q |
| Total Throughput (bpd)1 |
71,328 |
78,820 |
75,095 |
|
11% |
| Total Production (MMbbl)1 |
6.24 |
7.19 |
13.43 |
|
15% |
| Conventional Facility Capacity Utilization2 |
95.1% |
101.8% |
98.5% |
|
|
| |
|
|
|
|
|
| Total Operating Expense |
$26.5 |
$30.4 |
$55.1 |
|
15% |
| |
|
|
|
|
|
| Operating Expenses Per Barrel ($/bbl) |
$3.84 |
$4.23 |
$4.05 |
|
10% |
| |
|
|
|
|
|
| Fuel gross margin |
$103.8 |
$52.7 |
$156.5 |
|
-49% |
| |
|
|
|
|
|
| RIN expense3 |
$16.1 |
$25.4 |
$41.5 |
|
58% |
| |
|
|
|
|
|
| RIN Adjusted Fuel Gross Margin |
$87.7 |
$27.3 |
$115.0 |
|
-69% |
| |
|
|
|
|
|
| Fuel Gross Margin Per Barrel ($/bbl) |
$16.17 |
$7.34 |
$11.51 |
|
-55% |
| |
|
|
|
|
|
| RIN expense Per Barrel ($/bbl) |
$2.51 |
$3.66 |
$3.05 |
|
46% |
| |
|
|
|
|
|
| RIN Adjusted Fuel Gross Margin Per Barrel of Throughput |
$13.66 |
$3.68 |
$8.46 |
|
-73% |
| |
|
|
|
|
|
| Gulf Coast 2-1-1 Crack Spread |
$31.59 |
$23.60 |
$27.59 |
|
-25% |
| Capture Rate5 |
53.0% |
33.9% |
39.4% |
|
-36% |
| Adjusted Capture Rate |
43.2% |
15.6% |
30.7% |
|
-64% |
| |
|
|
|
|
|
| Production Yield |
|
|
|
|
|
| Gasoline (bpd) |
15,723 |
17,812 |
16,774 |
|
13% |
| % Production |
22.7% |
23.2% |
22.6% |
|
|
| ULSD (bpd) |
14,720 |
15,618 |
15,171 |
|
6% |
| % Production |
21.2% |
20.3% |
20.4% |
|
|
| Jet (bpd) |
12,789 |
13,570 |
13,182 |
|
6% |
| % Production |
18.4% |
17.7% |
17.8% |
|
|
| Other4 |
26,119 |
29,828 |
27,983 |
|
14% |
| % Production |
37.7% |
37.7% |
37.7% |
|
|
| Renewable diesel |
0 |
2,208 |
1,110 |
|
0% |
| % Production |
0.0% |
2.8% |
1.5% |
|
|
| Total Production (bpd) |
69,351 |
79,036 |
74,220 |
|
14% |
| Total Production (MMbbl) |
6.24 |
7.19 |
13.43 |
|
15% |
| 1.) Includes soybean oil throughput of 2,490 bpd and 1.252 MMbbl for 2Q23 and YTD, respectively |
| 2.) Assumes 75,000 barrels per day of conventional operational capacity |
| 3.) RIN: Renewable identification number |
| 4.) Other includes naphtha, intermediates, and LPG |
| 5.) Capture rate reflects conventional fuels gross margin only |
Renewable Diesel Facility
Renewable diesel production facility successfully
started following system repairs. Vertex’s previously disclosed failure
in the renewable diesel feedstock pumping system was successfully repaired on-time, with facility start-up procedures successfully completed
on May 27th. During the quarter, production volumes of renewable diesel were steadily increased to expected Phase 1 target capacity of
approximately 8,000 barrels per day.
Feedstock Supply Strategy Advanced. Recent
operation and testing of the renewable diesel facility demonstrated stable operations at designed rates with yields at or better than
targets. The shorter than anticipated break in period of the renewable diesel facility, combined with deteriorating economics of refined,
bleached, deodorized (“RBD”) soybean oil feedstock during the quarter drove an acceleration of the Company’s deployment
of its longer-term feedstock optimization strategy. The Company recently introduced Distillers Corn Oil or “DCO” into its
feedstock blend last week and has advanced a combination of eight different feedstock blends through its feedstock approval process over
the last six weeks.
Balance Sheet and Liquidity Update
As of June 30, 2023, Vertex had total debt outstanding
of $327.4 million, including lease obligations of $162.1 million. The Company had total cash and equivalents of $52.1 million including
$3.6 million of restricted cash on the balance sheet as of June 30, 2023, for a net debt position of $275.3 million. The ratio of net
debt to trailing twelve month Adjusted EBITDA was 3.6 times as of June 30, 2023.
On June 12, 2023, the Company successfully executed
the exchange of approximately $79.9 million principal amount of its 6.25% Senior Secured Convertible due 2027 into 17.2 million shares
of common stock. The Company currently has $15.2 million of remaining principal outstanding in its 6.25% Senior Secured Convertible notes.
Management Outlook
All guidance presented below is current as of
the time of this release and is subject to change. All prior financial guidance should no longer be relied upon.
Third Quarter 2023 Financial and Operating
Outlook:
| | |
3Q 2023 | |
| Operational: | |
Low | | |
High | |
| Mobile Refinery Conventional Throughput Volume (Mbpd) | |
| 74.0 | | |
| 77.0 | |
| Capacity Utilization | |
| 99 | % | |
| 103 | % |
| Production Yield Profile | |
| | | |
| | |
| Finished Products1 | |
| 59 | % | |
| 63 | % |
| Intermediate & Other Products2 | |
| 41 | % | |
| 37 | % |
| | |
| | | |
| | |
| Financial Guidance: | |
| | | |
| | |
| Direct Operating Expense ($/bbl) | |
$ | 3.60 | | |
$ | 3.80 | |
| Capital Expenditures ($/MM) | |
$ | 20 | | |
$ | 25 | |
1.) Finished products include gasoline, ULSD, and Jet A
2.) Intermediate & Other products include VGO, LPGs, VTB
CONFERENCE CALL AND WEBCAST DETAILS
A conference call will be held today, August
9, 2023 at 8:30 A.M. Eastern Time to review the Company’s financial results, discuss recent events and conduct a question-and-answer
session. An audio webcast of the conference call and accompanying presentation materials will also be available in the “Events
and Presentation” section of Vertex’s website at www.vertexenergy.com. To listen to a live broadcast, visit the site
at least 15 minutes prior to the scheduled start time in order to register, download, and install any necessary audio software.
To participate in the live teleconference:
Domestic: 1-877-407-0784
International: 1-201-689-8560
To listen to a replay of the teleconference, which will be available
through August 15, 2023, either go to the Events and Presentation section of Vertex’s website at www.vertexenergy.com, or call
the number below:
Domestic Replay: 1-844-512-2921
International: 1-412-317-6671
Access ID: 13739964
ABOUT VERTEX ENERGY
Vertex Energy is a leading energy transition company
that specializes in producing both renewable and conventional fuels. Our innovative solutions are designed to enhance the performance
of our customers and partners while also prioritizing sustainability, safety, and operational excellence. With a commitment to providing
superior products and services, Vertex Energy is dedicated to shaping the future of the energy industry.
FORWARD-LOOKING STATEMENTS
Certain of the matters discussed in this communication
which are not statements of historical fact constitute forward-looking statements within the meaning of the securities laws, including
the Private Securities Litigation Reform Act of 1995, that involve a number of risks and uncertainties. Words such as “strategy,”
“expects,” “continues,” “plans,” “anticipates,” “believes,” “would,”
“will,” “estimates,” “intends,” “projects,” “goals,” “targets”
and other words of similar meaning are intended to identify forward-looking statements but are not the exclusive means of identifying
these statements. Any statements made in this news release other than those of historical fact, about an action, event or development,
are forward-looking statements. The important factors that may cause actual results and outcomes to differ materially from those contained
in such forward-looking statements include, without limitation, the Company’s projected Outlook for the third quarter of 2023, as
discussed above; the need for additional capital in the future, including, but not limited to, in order to complete future capital projects
and satisfy liabilities, the Company’s ability to raise such capital in the future, and the terms of such funding; the timing of
planned capital projects at the Company’s refinery located in Mobile, Alabama (the “Mobile Refinery”) and the outcome
of such projects; the future production of the Mobile Refinery, including but not limited to renewable diesel production; estimated and
actual production and costs associated with the renewable diesel capital project; estimated revenues over the course of the agreement
with Idemitsu; anticipated and unforeseen events which could reduce future production at the Mobile Refinery or delay planned and future
capital projects; changes in commodity and credits values; certain early termination rights associated with third party agreements and
conditions precedent to such agreements; certain mandatory redemption provisions of the outstanding senior convertible notes, the conversion
rights associated therewith, and dilution caused by conversions and/or the exchanges of convertible notes; the Company’s ability
to comply with required covenants under outstanding senior notes and a term loan and pay amounts due under such senior notes and term
loan, including interest and other amounts due thereunder; the ability of the Company to retain and hire key personnel; the level of competition
in the Company’s industry and its ability to compete; the Company’s ability to respond to changes in its industry; the loss
of key personnel or failure to attract, integrate and retain additional personnel; the Company’s ability to protect intellectual
property and not infringe on others’ intellectual property; the Company’s ability to scale its business; the Company’s
ability to maintain supplier relationships and obtain adequate supplies of feedstocks; the Company’s ability to obtain and retain
customers; the Company’s ability to produce products at competitive rates; the Company’s ability to execute its business strategy
in a very competitive environment; trends in, and the market for, the price of oil and gas and alternative energy sources; the impact
of inflation on margins and costs; the volatile nature of the prices for oil and gas caused by supply and demand, including volatility
caused by the ongoing Ukraine/Russia conflict, increased interest rates, recessions and increased inflation; the Company’s ability
to maintain relationships with partners; the outcome of pending and potential future litigation, judgments and settlements; rules and
regulations making the Company’s operations more costly or restrictive; volatility in the market price of compliance credits (primarily
Renewable Identification Numbers (RINs) needed to comply with the Renewable Fuel Standard (“RFS”)) under renewable and low-carbon
fuel programs and emission credits needed under other environmental emissions programs, the requirement for the Company to purchase RINs
in the secondary market to the extent it does not generate sufficient RINs internally, liabilities associated therewith and the timing,
funding and costs of such required purchases, if any; changes in environmental and other laws and regulations and risks associated with
such laws and regulations; economic downturns both in the United States and globally, increases in inflation and interest rates, increased
costs of borrowing associated therewith and potential declines in the availability of such funding; risk of increased regulation of the
Company’s operations and products; disruptions in the infrastructure that the Company and its partners rely on; interruptions at
the Company’s facilities; unexpected and expected changes in the Company’s anticipated capital expenditures resulting from
unforeseen and expected required maintenance, repairs, or upgrades; the Company’s ability to acquire and construct new facilities;
the Company’s ability to effectively manage growth; decreases in global demand for, and the price of, oil, due to inflation, recessions
or other reasons, including declines in economic activity or global conflicts; expected and unexpected downtime at the Company’s
facilities; the Company’s level of indebtedness, which could affect its ability to fulfill its obligations, impede the implementation
of its strategy, and expose the Company’s interest rate risk; dependence on third party transportation services and pipelines; risks
related to obtaining required crude oil supplies, and the costs of such supplies; counterparty credit and performance risk; unanticipated
problems at, or downtime effecting, the Company’s facilities and those operated by third parties; risks relating to the Company’s
hedging activities or lack of hedging activities; and risks relating to planned and future divestitures, asset sales, joint ventures and
acquisitions.
Other important factors that may cause actual
results and outcomes to differ materially from those contained in the forward-looking statements included in this communication are described
in the Company’s publicly filed reports, including, but not limited to, the Company’s Annual Report on Form 10-K for the year
ended December 31, 2022, and the Company’s Quarterly Report on Form 10-Q for the quarter ended June 30, 2023, and future Annual
Reports on Form 10-K and Quarterly Reports on Form 10-Q. These reports are available at www.sec.gov. The Company cautions that the foregoing
list of important factors is not complete. All subsequent written and oral forward-looking statements attributable to the Company or any
person acting on behalf of the Company are expressly qualified in their entirety by the cautionary statements referenced above. Other
unknown or unpredictable factors also could have material adverse effects on Vertex’s future results. The forward-looking statements
included in this press release are made only as of the date hereof. Vertex cannot guarantee future results, levels of activity, performance
or achievements. Accordingly, you should not place undue reliance on these forward-looking statements. Finally, Vertex undertakes no obligation
to update these statements after the date of this release, except as required by law, and takes no obligation to update or correct information
prepared by third parties that are not paid for by Vertex. If we update one or more forward-looking statements, no inference should be
drawn that we will make additional updates with respect to those or other forward-looking statements.
PROJECTIONS
The financial projections (the “Projections”)
included herein were prepared by Vertex in good faith using assumptions believed to be reasonable. A significant number of assumptions
about the operations of the business of Vertex were based, in part, on economic, competitive, and general business conditions prevailing
at the time the Projections were developed. Any future changes in these conditions, may materially impact the ability of Vertex to achieve
the financial results set forth in the Projections. The Projections are based on numerous assumptions, including realization of the operating
strategy of Vertex; industry performance; no material adverse changes in applicable legislation or regulations, or the administration
thereof, or generally accepted accounting principles; general business and economic conditions; competition; retention of key management
and other key employees; absence of material contingent or unliquidated litigation, indemnity, or other claims; minimal changes in current
pricing; static material and equipment pricing; no significant increases in interest rates or inflation; and other matters, many of which
will be beyond the control of Vertex, and some or all of which may not materialize. The Projections also assume the continued uptime of
the Company’s facilities at historical levels and the successful funding of, timely completion of, and successful outcome of, planned
capital projects. Additionally, to the extent that the assumptions inherent in the Projections are based upon future business decisions
and objectives, they are subject to change. Although the Projections are presented with numerical specificity and are based on reasonable
expectations developed by Vertex’s management, the assumptions and estimates underlying the Projections are subject to significant
business, economic, and competitive uncertainties and contingencies, many of which will be beyond the control of Vertex. Accordingly,
the Projections are only estimates and are necessarily speculative in nature. It is expected that some or all of the assumptions in the
Projections will not be realized and that actual results will vary from the Projections. Such variations may be material and may increase
over time. In light of the foregoing, readers are cautioned not to place undue reliance on the Projections. The projected financial information
contained herein should not be regarded as a representation or warranty by Vertex, its management, advisors, or any other person that
the Projections can or will be achieved. Vertex cautions that the Projections are speculative in nature and based upon subjective decisions
and assumptions. As a result, the Projections should not be relied on as necessarily predictive of actual future events.
NON-GAAP FINANCIAL MEASURES
In addition to our results calculated under generally
accepted accounting principles in the United States (“GAAP”), in this news release we also present Adjusted EBITDA, Adjusted
Gross Margin, Fuel Gross Margin, Fuel Gross Margin Per Barrel of Throughput, Operating Expenses Per Barrel of Throughput, RIN Adjusted
Fuel Gross Margin, RIN Adjusted Fuel Gross Margin Per Barrel of Throughput, Net Long-Term Debt and Ratio of Net Long-Term Debt (collectively,
the “Non-GAAP Financial Measures”) The Non-GAAP Financial Measures are “non-GAAP financial measures” presented
as supplemental measures of the Company’s performance. They are not presented in accordance with GAAP. EBITDA represents net income
before interest, taxes, depreciation and amortization, for continued and discontinued operations. Adjusted EBITDA represents net income
(loss) from operations plus unrealized gain or losses on hedging activities, Renewable Fuel Standard (RFS) costs (mainly related to Renewable
Identification Numbers (RINs), and inventory adjustments, depreciation and amortization, acquisition costs, gain on change in value of
derivative warrant liability, environmental clean-up, stock-based compensation, (gain) loss on sale of assets, interest expense, and certain
other unusual or non-recurring charges included in selling, general, and administrative expenses. Adjusted Gross Margin is defined as
gross profit (loss) plus unrealized gain or losses on hedging activities and inventory valuation adjustments. Fuel Gross Margin is defined
as Adjusted Gross Margin, plus production costs, operating expenses and depreciation attributable to cost of revenues and other non-fuel
items included in costs of revenues including realized and unrealized gain or losses on hedging activities, RFS costs (mainly related
to RINs), inventory valuation adjustments, fuel financing costs and other revenues and cost of sales items. Fuel Gross Margin Per Barrel
of Throughput is calculated as fuel gross margin divided by total throughput barrels for the period presented. Operating Expenses Per
Barrel of Throughput is defined as total operating expenses divided by total barrels of throughput. RIN Adjusted Fuel Gross Margin is
defined as [Fuel Gross Margin minus RIN expense divided by total barrels of throughput. RIN Adjusted Fuel Gross Margin Per Barrel of Throughput
is calculated as RIN Adjusted Fuel Gross Margin divided by total throughput barrels for the period presented. Net Long-Term Debt is long-term
debt and lease obligations, adjusted for unamortized discount and deferred financing costs, insurance premiums financed, less cash and
cash equivalents and restricted cash. Ratio of Net Long-Term Debt is defined as Long-Term Debt divided by Adjusted EBITDA.
The Non-GAAP Financial Measures are presented
because we believe they provide additional useful information to investors due to the various noncash items during the period. We believe
that the Non-GAAP Financial Measures are also frequently used by analysts, investors and other interested parties to evaluate companies
in our industry. We use the Non-GAAP Financial Measures as supplements to GAAP measures of performance to evaluate the effectiveness of
our business strategies, to make budgeting decisions, to allocate resources and to compare our performance relative to our peers. Additionally,
these measures, when used in conjunction with related GAAP financial measures, provide investors with an additional financial analytical
framework which management uses, in addition to historical operating results, as the basis for financial, operational and planning decisions
and present measurements that third parties have indicated are useful in assessing the Company and its results of operations. The Non-GAAP
Financial Measures are unaudited, and have limitations as analytical tools, and you should not consider them in isolation, or as a substitute
for analysis of our operating results as reported under GAAP. Some of these limitations are: the Non-GAAP Financial Measures do not reflect
cash expenditures, or future requirements for capital expenditures, or contractual commitments; the Non-GAAP Financial Measures do not
reflect changes in, or cash requirements for, capital expenditures or working capital needs; the Non-GAAP Financial Measures do not reflect
the significant interest expense, or the cash requirements necessary to service interest or principal payments, on debt or cash income
tax payments; although depreciation and amortization are noncash charges, the assets being depreciated and amortized will often have to
be replaced in the future, the Non-GAAP Financial Measures do not reflect any cash requirements for such replacements; Adjusted EBITDA,
Adjusted Gross Margin, Fuel Gross Margin and RIN Adjusted Fuel Gross Margin represent only a portion of our total operating results; and
other companies in this industry may calculate the Non-GAAP Financial Measures differently than we do, limiting their usefulness as a
comparative measure. The Company’s presentation of these measures should not be construed as an inference that future results will
be unaffected by unusual or nonrecurring items. We compensate for these limitations by providing a reconciliation of each of these non-GAAP
measures to the most comparable GAAP measure. We encourage investors and others to review our business, results of operations, and financial
information in their entirety, not to rely on any single financial measure, and to view these non-GAAP measures in conjunction with the
most directly comparable GAAP financial measure. For more information on these non-GAAP financial measures, please see the sections titled
“Unaudited Reconciliation of Gross Profit (Loss) From Continued and Discontinued Operations to Adjusted Gross Margin, Fuel Gross
Margin, Fuel Gross Margin Per Barrel of Throughput, Operating Expenses Per Barrel of Throughput, RIN Adjusted Fuel Gross Margin and RIN
Adjusted Fuel Gross Margin Per Barrel of Throughput”, “Unaudited Reconciliation of Adjusted EBITDA to Net loss from Continued
and Discontinued Operations”, and “Unaudited Reconciliation of Long-Term Debt to Net Long-Term Debt and Ratio of Net Debt”,
at the end of this release.
CONTACT:
IR@vertexenergy.com
203-682-8284
VERTEX ENERGY, INC.
CONSOLIDATED BALANCE SHEETS
(in thousands, except number of shares and par
value)
(UNAUDITED)
| | |
June 30,
2023 | | |
December 31,
2022 | |
| ASSETS | |
| | | |
| | |
| Current assets | |
| | | |
| | |
| Cash and cash equivalents | |
$ | 48,532 | | |
$ | 141,258 | |
| Restricted cash | |
| 3,603 | | |
| 4,929 | |
| Accounts receivable, net | |
| 50,995 | | |
| 34,548 | |
| Inventory | |
| 215,672 | | |
| 135,473 | |
| Prepaid expenses and other current assets | |
| 52,929 | | |
| 36,660 | |
| Assets held for sale, current | |
| — | | |
| 20,560 | |
| Total current assets | |
| 371,731 | | |
| 373,428 | |
| | |
| | | |
| | |
| Fixed assets, net | |
| 298,112 | | |
| 201,749 | |
| Finance lease right-of-use assets | |
| 66,301 | | |
| 44,081 | |
| Operating lease right-of use assets | |
| 92,502 | | |
| 53,557 | |
| Intangible assets, net | |
| 12,241 | | |
| 11,827 | |
| Deferred taxes assets | |
| 10,975 | | |
| 2,498 | |
| Other assets | |
| 3,338 | | |
| 2,245 | |
| TOTAL ASSETS | |
$ | 855,200 | | |
$ | 689,385 | |
| | |
| | | |
| | |
| LIABILITIES AND STOCKHOLDERS’ EQUITY | |
| | | |
| | |
| Current liabilities | |
| | | |
| | |
| Accounts payable | |
$ | 41,373 | | |
$ | 20,997 | |
| Accrued expenses | |
| 87,642 | | |
| 81,711 | |
| Finance lease liability-current | |
| 2,320 | | |
| 1,363 | |
| Operating lease liability-current | |
| 25,588 | | |
| 9,012 | |
| Current portion of long-term debt, net | |
| 18,245 | | |
| 13,911 | |
| Obligations under inventory financing agreements, net | |
| 162,096 | | |
| 117,939 | |
| Derivative commodity liability | |
| 3,357 | | |
| 242 | |
| Liabilities held for sale, current | |
| — | | |
| 3,424 | |
| Total current liabilities | |
| 340,621 | | |
| 248,599 | |
| | |
| | | |
| | |
| Long-term debt, net | |
| 123,653 | | |
| 170,010 | |
| Finance lease liability-long-term | |
| 67,290 | | |
| 45,164 | |
| Operating lease liability-long-term | |
| 66,914 | | |
| 44,545 | |
| Deferred tax liabilities | |
| — | | |
| — | |
| Derivative warrant liability | |
| 13,855 | | |
| 14,270 | |
| Other liabilities | |
| 1,377 | | |
| 1,377 | |
| Total liabilities | |
| 613,710 | | |
| 523,965 | |
| | |
| | | |
| | |
| COMMITMENTS AND CONTINGENCIES (Note 4) | |
| — | | |
| — | |
| | |
| | | |
| | |
| STOCKHOLDERS’ EQUITY | |
| | | |
| | |
| | |
| | | |
| | |
Common stock, $0.001 par value per share;
750,000,000 shares authorized; 93,236,563 and 75,668,826 shares issued and outstanding at June 30, 2023 and December 31, 2022, respectively. | |
| 93 | | |
| 76 | |
| Additional paid-in capital | |
| 381,776 | | |
| 279,552 | |
| Accumulated deficit | |
| (143,431 | ) | |
| (115,893 | ) |
| Total Vertex Energy, Inc. stockholders’ equity | |
| 238,438 | | |
| 163,735 | |
| Non-controlling interest | |
| 3,052 | | |
| 1,685 | |
| Total equity | |
| 241,490 | | |
| 165,420 | |
| TOTAL LIABILITIES AND STOCKHOLDERS’ EQUITY | |
$ | 855,200 | | |
$ | 689,385 | |
VERTEX ENERGY, INC.
CONSOLIDATED STATEMENTS OF OPERATIONS
(in thousands, except per share amounts)
(UNAUDITED)
| | |
Three Months Ended
June 30, | | |
Six Months Ended
June 30, | |
| | |
2023 | | |
2022 | | |
2023 | | |
2022 | |
| Revenues | |
$ | 734,893 | | |
$ | 1,029,369 | | |
$ | 1,426,035 | | |
$ | 1,103,906 | |
| Cost of revenues (exclusive of depreciation and amortization shown separately below) | |
| 729,649 | | |
| 1,007,143 | | |
| 1,349,001 | | |
| 1,068,133 | |
| Depreciation and amortization attributable to costs of revenues | |
| 6,630 | | |
| 4,063 | | |
| 10,967 | | |
| 5,090 | |
| Gross profit (loss) | |
| (1,386 | ) | |
| 18,163 | | |
| 66,067 | | |
| 30,683 | |
| | |
| | | |
| | | |
| | | |
| | |
| Operating expenses: | |
| | | |
| | | |
| | | |
| | |
| Selling, general and administrative expenses (exclusive of depreciation and amortization shown separately below) | |
| 42,636 | | |
| 40,748 | | |
| 84,578 | | |
| 52,897 | |
| Depreciation and amortization attributable to operating expenses | |
| 1,028 | | |
| 1,127 | | |
| 2,044 | | |
| 1,536 | |
| Total operating expenses | |
| 43,664 | | |
| 41,875 | | |
| 86,622 | | |
| 54,433 | |
| Loss from operations | |
| (45,050 | ) | |
| (23,712 | ) | |
| (20,555 | ) | |
| (23,750 | ) |
| Other income (expense): | |
| | | |
| | | |
| | | |
| | |
| Other income (loss) | |
| (496 | ) | |
| 171 | | |
| 1,156 | | |
| 643 | |
| Gain (loss) on change in value of derivative warrant liability | |
| 9,600 | | |
| (945 | ) | |
| 415 | | |
| (4,524 | ) |
| Interest expense | |
| (77,536 | ) | |
| (47,712 | ) | |
| (90,013 | ) | |
| (51,933 | ) |
| Total other expense | |
| (68,432 | ) | |
| (48,486 | ) | |
| (88,442 | ) | |
| (55,814 | ) |
| Loss from continuing operations before income tax | |
| (113,482 | ) | |
| (72,198 | ) | |
| (108,997 | ) | |
| (79,564 | ) |
| Income tax benefit (expense) | |
| 28,688 | | |
| — | | |
| 27,676 | | |
| — | |
| Loss from continuing operations | |
| (84,794 | ) | |
| (72,198 | ) | |
| (81,321 | ) | |
| (79,564 | ) |
| Income from discontinued operations, net of tax (see note 23) | |
| 3,340 | | |
| 8,416 | | |
| 53,680 | | |
| 14,973 | |
| Net loss | |
| (81,454 | ) | |
| (63,782 | ) | |
| (27,641 | ) | |
| (64,591 | ) |
| Net income (loss) attributable to non-controlling interest and redeemable non-controlling interest from continuing operations | |
| (53 | ) | |
| 137 | | |
| (103 | ) | |
| 64 | |
| Net income attributable to non-controlling interest and redeemable non-controlling interest from discontinued operations | |
| — | | |
| 3,050 | | |
| — | | |
| 6,862 | |
| Net loss attributable to Vertex Energy, Inc. | |
| (81,401 | ) | |
| (66,969 | ) | |
| (27,538 | ) | |
| (71,517 | ) |
| | |
| | | |
| | | |
| | | |
| | |
| Accretion of redeemable noncontrolling interest to redemption value from continued operations | |
| — | | |
| (7 | ) | |
| — | | |
| (428 | ) |
| | |
| | | |
| | | |
| | | |
| | |
| Net loss attributable to common stockholders from continuing operations | |
| (84,741 | ) | |
| (72,342 | ) | |
| (81,218 | ) | |
| (80,056 | ) |
| Net income attributable to common stockholders from discontinued operations, net of tax | |
| 3,340 | | |
| 5,366 | | |
| 53,680 | | |
| 8,111 | |
| Net loss attributable to common shareholders | |
$ | (81,401 | ) | |
$ | (66,976 | ) | |
$ | (27,538 | ) | |
$ | (71,945 | ) |
| | |
| | | |
| | | |
| | | |
| | |
| Basic loss per common share | |
| | | |
| | | |
| | | |
| | |
| Continuing operations | |
$ | (1.07 | ) | |
$ | (1.07 | ) | |
$ | (1.05 | ) | |
$ | (1.22 | ) |
| Discontinued operations, net of tax | |
| 0.04 | | |
| 0.08 | | |
| 0.69 | | |
| 0.12 | |
| Basic loss per common share | |
$ | (1.03 | ) | |
$ | (0.99 | ) | |
$ | (0.36 | ) | |
$ | (1.10 | ) |
| | |
| | | |
| | | |
| | | |
| | |
| Shares used in computing earnings per share | |
| | | |
| | | |
| | | |
| | |
| Basic | |
| 79,519 | | |
| 67,923 | | |
| 77,615 | | |
| 65,660 | |
| Diluted | |
| 79,519 | | |
| 67,923 | | |
| 77,615 | | |
| 65,660 | |
VERTEX ENERGY, INC.
CONSOLIDATED STATEMENTS OF STOCKHOLDERS’ EQUITY
(in thousands, except par value)
(UNAUDITED)
| Six Months
Ended June 30, 2023 |
| | |
Common Stock | | |
Series A Preferred | | |
| | | |
| | | |
| | | |
| | |
| | |
Shares | | |
$0.001 Par | | |
Shares | | |
$0.001 Par | | |
Additional Paid-In Capital | | |
Retained Earnings | | |
Non-controlling Interest | | |
Total Equity | |
| Balance on January 1, 2023 | |
| 75,669 | | |
$ | 76 | | |
| — | | |
$ | — | | |
$ | 279,552 | | |
$ | (115,893 | ) | |
$ | 1,685 | | |
$ | 165,420 | |
| Exercise of options | |
| 166 | | |
| — | | |
| — | | |
| — | | |
| 209 | | |
| — | | |
| — | | |
| 209 | |
| Stock based compensation expense | |
| — | | |
| — | | |
| — | | |
| — | | |
| 365 | | |
| — | | |
| — | | |
| 365 | |
| Non-controlling shareholder contribution | |
| — | | |
| — | | |
| — | | |
| — | | |
| — | | |
| — | | |
| 980 | | |
| 980 | |
| Net income (loss) | |
| — | | |
| — | | |
| — | | |
| — | | |
| — | | |
| 53,863 | | |
| (50 | ) | |
| 53,813 | |
| Balance on March 31, 2023 | |
| 75,835 | | |
| 76 | | |
| — | | |
| — | | |
| 280,126 | | |
| (62,030 | ) | |
| 2,615 | | |
| 220,787 | |
| Exercise of options | |
| 195 | | |
| — | | |
| — | | |
| — | | |
| 169 | | |
| — | | |
| — | | |
| 169 | |
| Stock based compensation expense | |
| — | | |
| — | | |
| — | | |
| — | | |
| 368 | | |
| — | | |
| — | | |
| 368 | |
| Senior Note Converted | |
| 17,207 | | |
| 17 | | |
| — | | |
| — | | |
| 101,113 | | |
| — | | |
| — | | |
| 101,130 | |
| Non-controlling shareholder contribution | |
| — | | |
| — | | |
| — | | |
| — | | |
| — | | |
| — | | |
| 490 | | |
| 490 | |
| Net loss | |
| — | | |
| — | | |
| — | | |
| — | | |
| — | | |
| (81,401 | ) | |
| (53 | ) | |
| (81,454 | ) |
| Balance on June 30, 2023 | |
| 93,237 | | |
$ | 93 | | |
| — | | |
$ | — | | |
$ | 381,776 | | |
$ | (143,431 | ) | |
$ | 3,052 | | |
$ | 241,490 | |
| Six Months
Ended June 30, 2022 |
| | |
Common
Stock | | |
Series
A Preferred | | |
| | | |
| | | |
| | | |
| | |
| | |
Shares | | |
$0.001
Par | | |
Shares | | |
$0.001
Par | | |
Additional
Paid-In Capital | | |
Retained
Earnings | | |
Non-controlling
Interest | | |
Total
Equity | |
| Balance on January 1, 2022 | |
| 63,288 | | |
$ | 63 | | |
| 386 | | |
$ | — | | |
$ | 138,620 | | |
$ | (110,614 | ) | |
$ | 1,997 | | |
$ | 30,066 | |
| Exercise of options | |
| 60 | | |
| — | | |
| — | | |
| — | | |
| 76 | | |
| — | | |
| — | | |
| 76 | |
| Exercise of warrants | |
| 1,113 | | |
| 1 | | |
| — | | |
| — | | |
| (1 | ) | |
| — | | |
| — | | |
| — | |
| Stock based compensation expense | |
| — | | |
| — | | |
| — | | |
| — | | |
| 250 | | |
| — | | |
| — | | |
| 250 | |
| Conversion of Series A Preferred
stock to common | |
| 5 | | |
| — | | |
| (5 | ) | |
| — | | |
| — | | |
| — | | |
| — | | |
| — | |
| Equity component of the convertible
note issuance, net | |
| — | | |
| — | | |
| — | | |
| — | | |
| 78,789 | | |
| — | | |
| — | | |
| 78,789 | |
| Accretion of redeemable non-controlling
interest to redemption value | |
| — | | |
| — | | |
| — | | |
| — | | |
| — | | |
| (422 | ) | |
| — | | |
| (422 | ) |
| Net income (loss) | |
| — | | |
| — | | |
| — | | |
| — | | |
| — | | |
| (4,547 | ) | |
| 3,739 | | |
| (808 | ) |
| Less: amount
attributable to redeemable non-controlling interest | |
| — | | |
| — | | |
| — | | |
| — | | |
| — | | |
| — | | |
| (3,769 | ) | |
| (3,769 | ) |
| Balance on March 31, 2022 | |
| 64,466 | | |
| 64 | | |
| 381 | | |
| — | | |
| 217,734 | | |
| (115,583 | ) | |
| 1,967 | | |
| 104,182 | |
| Exercise of options to common | |
| 498 | | |
| 1 | | |
| — | | |
| — | | |
| 553 | | |
| — | | |
| — | | |
| 554 | |
| Exercise of options to common-
unissued | |
| — | | |
| — | | |
| — | | |
| — | | |
| 3 | | |
| — | | |
| — | | |
| 3 | |
| Distribution to non-controlling
shareholder | |
| — | | |
| — | | |
| — | | |
| — | | |
| — | | |
| — | | |
| (380 | ) | |
| (380 | ) |
| Adjustment of redeemable non-controlling
interest | |
| — | | |
| — | | |
| — | | |
| — | | |
| 29 | | |
| (29 | ) | |
| — | | |
| — | |
| Conversion of Convertible Senior
Notes to common | |
| 10,164 | | |
| 10 | | |
| — | | |
| — | | |
| 59,812 | | |
| — | | |
| — | | |
| 59,822 | |
| Share based compensation expense | |
| — | | |
| — | | |
| — | | |
| — | | |
| 324 | | |
| — | | |
| — | | |
| 324 | |
| Conversion of Series A Preferred
stock to common | |
| 381 | | |
| 1 | | |
| (381 | ) | |
| — | | |
| — | | |
| — | | |
| — | | |
| 1 | |
| Accretion of redeemable non-controlling
interest to redemption value | |
| — | | |
| — | | |
| — | | |
| — | | |
| — | | |
| (6 | ) | |
| — | | |
| (6 | ) |
| Net income (loss) | |
| — | | |
| — | | |
| — | | |
| — | | |
| — | | |
| (66,970 | ) | |
| 3,188 | | |
| (63,782 | ) |
| Less: amount
attributable to redeemable non-controlling interest | |
| — | | |
| — | | |
| — | | |
| — | | |
| — | | |
| — | | |
| (3,023 | ) | |
| (3,023 | ) |
| Balance on June 30, 2022 | |
| 75,509 | | |
$ | 76 | | |
| — | | |
$ | — | | |
$ | 278,455 | | |
$ | (182,588 | ) | |
$ | 1,752 | | |
$ | 97,695 | |
VERTEX ENERGY, INC.
CONSOLIDATED STATEMENTS OF CASH FLOWS
(in thousands)
| (UNAUDITED) | |
Six Months Ended
June 30, | |
| | |
2023 | | |
2022 | |
| Cash flows from operating activities | |
| | | |
| | |
| Net loss | |
$ | (27,641 | ) | |
$ | (64,591 | ) |
| Income from discontinued operations, net of tax | |
| 53,680 | | |
| 14,973 | |
| Loss from continuing operations | |
| (81,321 | ) | |
| (79,564 | ) |
Adjustments to reconcile net loss from continuing operations to cash used in operating activities
| |
| | | |
| | |
| Stock based compensation expense | |
| 733 | | |
| 574 | |
| Depreciation and amortization | |
| 13,011 | | |
| 6,626 | |
| Deferred income tax benefit | |
| (27,676 | ) | |
| — | |
| Gain on sale of assets | |
| (2 | ) | |
| (83 | ) |
| Provision for environment clean up | |
| — | | |
| 1,429 | |
| Increase in allowance for bad debt | |
| 93 | | |
| 432 | |
| (Decrease) increase in fair value of derivative warrant liability | |
| (415 | ) | |
| 4,524 | |
| Loss on commodity derivative contracts | |
| 2,123 | | |
| 98,274 | |
| Net cash settlements on commodity derivatives | |
| 1,269 | | |
| (70,951 | ) |
| Amortization of debt discount and deferred costs | |
| 70,948 | | |
| 40,001 | |
| Changes in operating assets and liabilities | |
| | | |
| | |
| Accounts receivable and other receivables | |
| (18,589 | ) | |
| (89,207 | ) |
| Inventory | |
| (80,199 | ) | |
| (65,679 | ) |
| Prepaid expenses and other current assets | |
| (16,546 | ) | |
| (18,613 | ) |
| Accounts payable | |
| 20,376 | | |
| 44,561 | |
| Accrued expenses | |
| 5,932 | | |
| 27,171 | |
| Other assets | |
| (1,090 | ) | |
| 29 | |
| Net cash used in operating activities from continuing operations | |
| (111,353 | ) | |
| (100,476 | ) |
| Cash flows from investing activities | |
| | | |
| | |
| Purchase of intangible assets | |
| (2,500 | ) | |
| (106 | ) |
| Investment in Mobile Refinery assets | |
| — | | |
| (227,525 | ) |
| Purchase of fixed assets | |
| (105,344 | ) | |
| (2,150 | ) |
| Proceeds from sale of discontinued operation | |
| 92,034 | | |
| — | |
| Proceeds from sale of fixed assets | |
| 5 | | |
| 157 | |
| Net cash used in investing activities from continuing operations | |
| (15,805 | ) | |
| (229,624 | ) |
| Cash flows from financing activities | |
| | | |
| | |
| Payments on finance leases | |
| (908 | ) | |
| (402 | ) |
| Proceeds from exercise of options and warrants to common stock | |
| 378 | | |
| 633 | |
| Distributions to noncontrolling interest | |
| — | | |
| (380 | ) |
| Contributions received from noncontrolling interest | |
| 1,470 | | |
| — | |
| Net change on inventory financing agreements | |
| 43,657 | | |
| 172,607 | |
| Redemption of noncontrolling interest | |
| — | | |
| (50,666 | ) |
| Proceeds from note payable | |
| 13,081 | | |
| 165,718 | |
| Payments on note payable | |
| (24,422 | ) | |
| (7,716 | ) |
| Net cash provided by financing activities from continuing operations | |
| 33,256 | | |
| 279,794 | |
| | |
| | | |
| | |
| Discontinued operations: | |
| | | |
| | |
| Net cash provided by (used in) operating activities | |
| (150 | ) | |
| 12,476 | |
| Net cash used in investing activities | |
| — | | |
| (783 | ) |
| Net cash provided by (used in) discontinued operations | |
| (150 | ) | |
| 11,693 | |
| | |
| | | |
| | |
| Net decrease in cash, cash equivalents and restricted cash | |
| (94,052 | ) | |
| (38,613 | ) |
| Cash, cash equivalents, and restricted cash at beginning of the period | |
| 146,187 | | |
| 136,627 | |
| Cash, cash equivalents, and restricted cash at end of period | |
$ | 52,135 | | |
$ | 98,014 | |
VERTEX ENERGY, INC.
CONSOLIDATED STATEMENTS OF CASH FLOWS
(in thousands)
(UNAUDITED)
(Continued)
The following table provides a reconciliation
of cash and cash equivalents and restricted cash reported within the consolidated balance sheets to the same amounts shown in the consolidated
statements of cash flows (in thousands).
| | |
Six Months Ended | |
| | |
June 30,
2023 | | |
June 30,
2022 | |
| | |
| | |
| |
| Cash and cash equivalents | |
$ | 48,532 | | |
$ | 97,914 | |
| Restricted cash | |
| 3,603 | | |
| 100 | |
| Cash and cash equivalents and restricted cash as shown in the consolidated statements of cash flows | |
$ | 52,135 | | |
$ | 98,014 | |
| | |
| | | |
| | |
| SUPPLEMENTAL INFORMATION | |
| | | |
| | |
| Cash paid for interest | |
$ | 24,755 | | |
$ | 51,950 | |
| Cash paid for taxes | |
$ | — | | |
$ | — | |
| | |
| | | |
| | |
| NON-CASH INVESTING AND FINANCING TRANSACTIONS | |
| | | |
| | |
| Equity component of the convertible note issuance | |
$ | — | | |
$ | 78,789 | |
| ROU assets obtained from new finance lease obligation | |
$ | 23,990 | | |
$ | 45,096 | |
| Exchange of Convertible Senior Notes to common stock | |
$ | 79,948 | | |
$ | 59,822 | |
| ROU assets obtained from new operating lease obligation | |
$ | 38,945 | | |
$ | — | |
| Accretion of redeemable non-controlling interest to redemption value | |
$ | — | | |
$ | 428 | |
Unaudited segment
information for the three and six months ended June 30, 2023 and 2022 is as follows (in thousands):
| Three Months Ended June 30, 2023 |
| | |
Refining
&
Marketing | | |
Black Oil &
Recovery | | |
Corporate and
Eliminations | | |
Total | |
| Revenues: | |
| | |
| | |
| | |
| |
| Refined products | |
$ | 492,109 | | |
$ | 21,797 | | |
$ | 149 | | |
$ | 514,055 | |
| Re-refined products | |
| 215,508 | | |
| 3,536 | | |
| (2,560 | ) | |
| 216,484 | |
| Services | |
| 3,802 | | |
| 552 | | |
| — | | |
| 4,354 | |
| Total revenues | |
| 711,419 | | |
| 25,885 | | |
| (2,411 | ) | |
| 734,893 | |
| Cost of revenues (exclusive of depreciation and amortization shown separately below) | |
| 710,958 | | |
| 23,263 | | |
| (4,572 | ) | |
| 729,649 | |
| Depreciation and amortization attributable to costs of revenues | |
| 5,568 | | |
| 1,062 | | |
| — | | |
| 6,630 | |
| Gross profit (loss) | |
| (5,107 | ) | |
| 1,560 | | |
| 2,161 | | |
| (1,386 | ) |
| Selling, general and administrative expenses | |
| 32,969 | | |
| 4,504 | | |
| 5,163 | | |
| 42,636 | |
| Depreciation and amortization attributable to operating expenses | |
| 822 | | |
| 38 | | |
| 168 | | |
| 1,028 | |
| Loss from operations | |
$ | (38,898 | ) | |
$ | (2,982 | ) | |
$ | (3,170 | ) | |
$ | (45,050 | ) |
| | |
| | | |
| | | |
| | | |
| | |
| Capital expenditures | |
$ | 27,762 | | |
$ | 2,827 | | |
$ | — | | |
$ | 30,589 | |
| Three Months Ended June 30, 2022 |
| | |
Refining
&
Marketing | | |
Black Oil &
Recovery | | |
Corporate and
Eliminations | | |
Total | |
| Revenues: | |
| | |
| | |
| | |
| |
| Refined products | |
$ | 719,607 | | |
$ | 56,520 | | |
$ | — | | |
$ | 776,127 | |
| Re-refined products | |
| 244,476 | | |
| 5,956 | | |
| — | | |
| 250,432 | |
| Services | |
| 2,307 | | |
| 503 | | |
| — | | |
| 2,810 | |
| Total revenues | |
| 966,390 | | |
| 62,979 | | |
| — | | |
| 1,029,369 | |
| Cost of revenues (exclusive of depreciation and amortization shown separately below) | |
| 959,684 | | |
| 47,459 | | |
| — | | |
| 1,007,143 | |
| Depreciation and amortization attributable to costs of revenues | |
| 3,105 | | |
| 958 | | |
| — | | |
| 4,063 | |
| Gross profit | |
| 3,601 | | |
| 14,562 | | |
| — | | |
| 18,163 | |
| Selling, general and administrative expenses | |
| 23,679 | | |
| 4,199 | | |
| 12,870 | | |
| 40,748 | |
| Depreciation and amortization attributable to operating expenses | |
| 829 | | |
| 46 | | |
| 252 | | |
| 1,127 | |
| Income (loss) from operations | |
$ | (20,907 | ) | |
$ | 10,317 | | |
$ | (13,122 | ) | |
$ | (23,712 | ) |
| | |
| | | |
| | | |
| | | |
| | |
| Capital expenditures | |
$ | 1,568 | | |
$ | 194 | | |
$ | — | | |
$ | 1,762 | |
| Six Months Ended June 30, 2023 |
| | |
Refining
&
Marketing | | |
Black Oil &
Recovery | | |
Corporate and
Eliminations | | |
Total | |
| Revenues: | |
| | |
| | |
| | |
| |
| Refined products | |
$ | 964,661 | | |
$ | 51,220 | | |
$ | (570 | ) | |
$ | 1,015,311 | |
| Re-refined products | |
| 400,352 | | |
| 7,947 | | |
| (4,573 | ) | |
| 403,726 | |
| Services | |
| 5,734 | | |
| 1,264 | | |
| — | | |
| 6,998 | |
| Total revenues | |
| 1,370,747 | | |
| 60,431 | | |
| (5,143 | ) | |
| 1,426,035 | |
| Cost of revenues (exclusive of depreciation and amortization shown separately below) | |
| 1,300,770 | | |
| 53,681 | | |
| (5,450 | ) | |
| 1,349,001 | |
| Depreciation and amortization attributable to costs of revenues | |
| 8,862 | | |
| 2,105 | | |
| — | | |
| 10,967 | |
| Gross profit | |
| 61,115 | | |
| 4,645 | | |
| 307 | | |
| 66,067 | |
| Selling, general and administrative expenses | |
| 59,455 | | |
| 9,303 | | |
| 15,820 | | |
| 84,578 | |
| Depreciation and amortization attributable to operating expenses | |
| 1,630 | | |
| 76 | | |
| 338 | | |
| 2,044 | |
| Income (loss) from operations | |
$ | 30 | | |
$ | (4,734 | ) | |
$ | (15,851 | ) | |
$ | (20,555 | ) |
| | |
| | | |
| | | |
| | | |
| | |
| Capital expenditures | |
$ | 97,670 | | |
$ | 7,674 | | |
$ | — | | |
$ | 105,344 | |
| Six Months Ended June 30, 2022 |
| | |
Refining
&
Marketing | | |
Black Oil &
Recovery | | |
Corporate and
Eliminations | | |
Total | |
| Revenues: | |
| | |
| | |
| | |
| |
| Refined products | |
$ | 749,063 | | |
$ | 91,471 | | |
$ | — | | |
$ | 840,534 | |
| Re-refined products | |
| 249,739 | | |
| 10,272 | | |
| — | | |
| 260,011 | |
| Services | |
| 2,307 | | |
| 1,054 | | |
| — | | |
| 3,361 | |
| Total revenues | |
| 1,001,109 | | |
| 102,797 | | |
| — | | |
| 1,103,906 | |
| Cost of revenues (exclusive of depreciation and amortization shown separately below) | |
| 992,770 | | |
| 75,363 | | |
| — | | |
| 1,068,133 | |
| Depreciation and amortization attributable to costs of revenues | |
| 3,228 | | |
| 1,862 | | |
| — | | |
| 5,090 | |
| Gross profit | |
| 5,111 | | |
| 25,572 | | |
| — | | |
| 30,683 | |
| Selling, general and administrative expenses | |
| 24,804 | | |
| 8,322 | | |
| 19,771 | | |
| 52,897 | |
| Depreciation and amortization attributable to operating expenses | |
| 934 | | |
| 104 | | |
| 498 | | |
| 1,536 | |
| Income (loss) from operations | |
$ | (20,627 | ) | |
$ | 17,146 | | |
$ | (20,269 | ) | |
$ | (23,750 | ) |
| | |
| | | |
| | | |
| | | |
| | |
| Capital expenditures | |
$ | 1,956 | | |
$ | 194 | | |
$ | — | | |
$ | 2,150 | |
The
following summarized unaudited financial information has been segregated
from continuing operations and reported as discontinued operations for the three and six months ended June 30, 2023, and 2022 (in
thousands):
| | |
Three Months Ended
June 30, | | |
Six Months Ended
June 30, | |
| | |
2023 | | |
2022 | | |
2023 | | |
2022 | |
| Revenues | |
$ | — | | |
$ | 23,832 | | |
$ | 7,366 | | |
$ | 42,759 | |
| Cost of revenues (exclusive of depreciation shown separately below) | |
| — | | |
| 12,735 | | |
| 4,589 | | |
| 22,918 | |
| Depreciation and amortization attributable to costs of revenues | |
| — | | |
| 391 | | |
| 124 | | |
| 782 | |
| Gross profit | |
| — | | |
| 10,706 | | |
| 2,653 | | |
| 19,059 | |
| Operating expenses: | |
| | | |
| | | |
| | | |
| | |
| Selling, general and administrative expenses (exclusive of depreciation shown separately below) | |
| — | | |
| 2,220 | | |
| 632 | | |
| 3,938 | |
| Depreciation and amortization expense attributable to operating expenses | |
| — | | |
| 62 | | |
| 21 | | |
| 125 | |
| Total operating expenses | |
| — | | |
| 2,282 | | |
| 653 | | |
| 4,063 | |
| Income from operations | |
| — | | |
| 8,424 | | |
| 2,000 | | |
| 14,996 | |
| Other income (expense) | |
| | | |
| | | |
| | | |
| | |
| Interest expense | |
| — | | |
| (8 | ) | |
| — | | |
| (23 | ) |
| Total other expense | |
| — | | |
| (8 | ) | |
| — | | |
| (23 | ) |
| Income before income tax | |
| — | | |
| 8,416 | | |
| 2,000 | | |
| 14,973 | |
| Income tax expense | |
| — | | |
| — | | |
| (528 | ) | |
| — | |
| Gain on sale of discontinued operations, net of $1,453 and $18,671 of tax for three and six months ended June 30, 2023 | |
| 3,340 | | |
| — | | |
| 52,208 | | |
| — | |
| Income from discontinued operations, net of tax | |
$ | 3,340 | | |
$ | 8,416 | | |
$ | 53,680 | | |
$ | 14,973 | |
Unaudited Reconciliation of Gross Profit (Loss)
From Continued and Discontinued Operations to Adjusted Gross Margin, Fuel Gross Margin, Fuel Gross Margin Per Barrel of Throughput, Operating
Expenses Per Barrel of Throughput, RIN Adjusted Fuel Gross Margin and RIN Adjusted Fuel Gross Margin Per Barrel of Throughput
| Three Months Ended March 31, 2023 |
| |
| In thousands | |
| Mobile Refinery | |
| Gross profit | |
$ | 65,470 | |
| Unrealized (gain) loss on hedging activities | |
$ | (570 | ) |
| Inventory valuation adjustments | |
| (1,532 | ) |
| Adjusted gross margin | |
$ | 63,368 | |
| Variable production costs attributable to cost of revenues | |
| 21,252 | |
| Depreciation and amortization attributable to cost of revenues | |
| 3,144 | |
| RINs | |
| 16,115 | |
| Realized (gain) loss on hedging activities | |
| (439 | ) |
| Financing costs | |
| 2,295 | |
| Other revenues | |
| (1,933 | ) |
| Fuel gross margin | |
$ | 103,802 | |
| Throughput (bpd) | |
| 71,328 | |
| Fuel gross margin per barrel of throughput | |
$ | 16.17 | |
| Adjusted gross margin per barrel of throughput | |
$ | 9.87 | |
| Variable production costs per barrel of throughput | |
$ | 3.31 | |
| Operating expenses per barrel of throughput | |
$ | 3.84 | |
| RIN Adjusted Fuel Gross Margin per barrel of throughput | |
$ | 13.66 | |
| Three Months Ended June 30, 2023 |
| |
| In thousands | |
| Mobile Refinery | |
| Gross profit | |
$ | (6,462 | ) |
| Unrealized (gain) loss on hedging activities | |
$ | 3,762 | |
| Inventory valuation adjustments | |
| (501 | ) |
| Adjusted gross margin | |
$ | (3,201 | ) |
| Variable production costs attributable to cost of revenues | |
| 28,763 | |
| Depreciation and amortization attributable to cost of revenues | |
| 5,369 | |
| RINs | |
| 25,410 | |
| Realized (gain) loss on hedging activities | |
| 138 | |
| Financing costs | |
| (29 | ) |
| Other revenues | |
| (3,800 | ) |
| Fuel gross margin | |
$ | 52,650 | |
| Throughput (bpd) | |
| 78,820 | |
| Fuel gross margin per barrel of throughput | |
$ | 7.34 | |
| Adjusted gross margin per barrel of throughput | |
$ | (0.45 | ) |
| Variable production costs per barrel of throughput | |
$ | 4.01 | |
| Operating expenses per barrel of throughput | |
$ | 4.23 | |
| RIN Adjusted Fuel Gross Margin per barrel of throughput | |
$ | 3.68 | |
| Six Months Ended June 30, 2023 |
| In thousands | |
Mobile Refinery | |
| Gross profit | |
$ | 59,008 | |
| Unrealized (gain) loss on hedging activities | |
$ | 3,192 | |
| Inventory valuation adjustments | |
| (2,033 | ) |
| Adjusted gross margin | |
$ | 60,167 | |
| Variable production costs attributable to cost of revenues | |
| 50,015 | |
| Depreciation and amortization attributable to cost of revenues | |
| 8,513 | |
| RINs | |
| 41,525 | |
| Realized (gain) loss on hedging activities | |
| (301 | ) |
| Financing costs | |
| 2,266 | |
| Other revenues | |
| (5,733 | ) |
| Fuel gross margin | |
$ | 156,452 | |
| Throughput (bpd) | |
| 75,095 | |
| Fuel gross margin per barrel of throughput | |
$ | 11.51 | |
| Adjusted gross margin per barrel of throughput | |
$ | 4.43 | |
| Variable production costs per barrel of throughput | |
$ | 3.68 | |
| Operating expenses per barrel of throughput | |
$ | 4.05 | |
| RIN Adjusted Fuel Gross Margin per barrel of throughput | |
$ | 8.46 | |
Unaudited Reconciliation of Adjusted EBITDA
to Net loss from Continued and Discontinued Operations
| In thousands | |
Three Months Ended | | |
Six Months Ended | | |
Twelve Months Ended | |
| | |
June 30,
2023 | | |
June 30,
2022 | | |
June 30,
2023 | | |
June 30,
2022 | | |
June 30,
2023 | | |
June 30,
2022 | |
| Net income (loss) | |
$ | (81,454 | ) | |
$ | (63,781 | ) | |
$ | (27,641 | ) | |
$ | (64,590 | ) | |
$ | 38,947 | | |
$ | (59,260 | ) |
| Depreciation and amortization | |
| 7,658 | | |
| 5,644 | | |
| 13,156 | | |
| 7,534 | | |
| 24,541 | | |
| 11,367 | |
| Income tax expense (benefit) | |
| (27,236 | ) | |
| — | | |
| (8,477 | ) | |
| — | | |
| (10,966 | ) | |
| — | |
| Interest expense | |
| 77,536 | | |
| 47,719 | | |
| 90,013 | | |
| 51,954 | | |
| 118,008 | | |
| 55,351 | |
| EBITDA | |
$ | (23,496 | ) | |
$ | (10,418 | ) | |
$ | 67,051 | | |
$ | (5,102 | ) | |
$ | 170,530 | | |
$ | 7,458 | |
| Unrealized (gain) loss on hedging activities | |
| 3,370 | | |
| 46,901 | | |
| 3,115 | | |
| 46,633 | | |
| (43,664 | ) | |
| 46,528 | |
| Inventory valuation adjustments | |
| (501 | ) | |
| 23,180 | | |
| (2,033 | ) | |
| 23,180 | | |
| 25,553 | | |
| 23,180 | |
| Gain on change in value of derivative warrant liability | |
| (9,600 | ) | |
| 945 | | |
| (415 | ) | |
| 4,524 | | |
| (12,760 | ) | |
| (3,078 | ) |
| Stock-based compensation | |
| 368 | | |
| 324.00 | | |
| 733.00 | | |
| 574 | | |
| 1,733 | | |
| 1,081 | |
| (Gain) loss on sale of assets | |
| (4,291 | ) | |
| 0 | | |
| (72,032 | ) | |
| (415 | ) | |
| (71,109 | ) | |
| (625 | ) |
| Acquisition costs | |
| — | | |
| 9,078 | | |
| 4,308.00 | | |
| 13,638 | | |
| 7,197 | | |
| 17,203 | |
| Enviromental clean-up | |
| — | | |
| 1,428 | | |
| — | | |
| 1,428 | | |
| — | | |
| 1,428 | |
| Other | |
| — | | |
| (147 | ) | |
| — | | |
| (147 | ) | |
| (3 | ) | |
| 2,106 | |
| Adjusted EBITDA | |
$ | (34,150 | ) | |
$ | 71,291 | | |
$ | 727 | | |
$ | 84,313 | | |
$ | 77,477 | | |
$ | 95,281 | |
| | |
Three Months Ended June 30, 2023 | |
| In thousands | |
Mobile Refinery | | |
Legacy Refining & Marketing | | |
Total Refining & Marketing | | |
Black Oil and Recovery | | |
Corporate | | |
Consolidated | |
| Net income (loss) | |
$ | (42,116 | ) | |
$ | (1,312 | ) | |
$ | (43,428 | ) | |
$ | (3,667 | ) | |
$ | (34,359 | ) | |
$ | (81,454 | ) |
| Depreciation and amortization | |
| 6,119 | | |
| 272 | | |
| 6,391 | | |
| 1,100 | | |
| 167 | | |
| 7,658 | |
| Income tax expense (benefit) | |
| — | | |
| — | | |
| — | | |
| — | | |
| (27,236 | ) | |
| (27,236 | ) |
| Interest expense | |
| 4,529 | | |
| — | | |
| 4,529 | | |
| 28 | | |
| 72,979 | | |
| 77,536 | |
| EBITDA | |
$ | (31,468 | ) | |
$ | (1,040 | ) | |
$ | (32,508 | ) | |
$ | (2,539 | ) | |
$ | 11,551 | | |
$ | (23,496 | ) |
| Unrealized (gain) loss on hedging activities | |
| 3,762 | | |
| 25 | | |
| 3,787 | | |
| (417 | ) | |
| — | | |
| 3,370 | |
| Inventory valuation adjustments | |
| (501 | ) | |
| — | | |
| (501 | ) | |
| — | | |
| — | | |
| (501 | ) |
| Gain on change in value of derivative warrant liability | |
| — | | |
| — | | |
| — | | |
| — | | |
| (9,600 | ) | |
| (9,600 | ) |
| Stock-based compensation | |
| — | | |
| — | | |
| — | | |
| — | | |
| 368 | | |
| 368 | |
| (Gain) loss on sale of assets | |
| — | | |
| — | | |
| — | | |
| 499 | | |
| (4,790 | ) | |
| (4,291 | ) |
| Acquisition costs | |
| — | | |
| — | | |
| — | | |
| — | | |
| — | | |
| — | |
| Adjusted EBITDA | |
$ | (28,207 | ) | |
$ | (1,015 | ) | |
$ | (29,222 | ) | |
$ | (2,457 | ) | |
$ | (2,471 | ) | |
$ | (34,150 | ) |
| | |
Six Months Ended June 30, 2023 | |
| In thousands | |
Mobile Refinery | | |
Legacy Refining & Marketing | | |
Total Refining & Marketing | | |
Black Oil and Recovery | | |
Corporate | | |
Consolidated | |
| Net income (loss) | |
$ | (5,939 | ) | |
$ | (2,437 | ) | |
$ | (8,376 | ) | |
$ | (1,663 | ) | |
$ | (17,602 | ) | |
$ | (27,641 | ) |
| Depreciation and amortization | |
| 9,999 | | |
| 494 | | |
| 10,493 | | |
| 2,326 | | |
| 337 | | |
| 13,156 | |
| Income tax expense (benefit) | |
| — | | |
| — | | |
| — | | |
| — | | |
| (8,477 | ) | |
| (8,477 | ) |
| Interest expense | |
| 8,405 | | |
| — | | |
| 8,405 | | |
| 85 | | |
| 81,523 | | |
| 90,013 | |
| EBITDA | |
$ | 12,465 | | |
$ | (1,943 | ) | |
$ | 10,522 | | |
$ | 748 | | |
$ | 55,781 | | |
$ | 67,051 | |
| Unrealized (gain) loss on hedging activities | |
| 3,192 | | |
| (42 | ) | |
| 3,150 | | |
| (35 | ) | |
| — | | |
| 3,115 | |
| Inventory valuation adjustments | |
| (2,033 | ) | |
| — | | |
| (2,033 | ) | |
| — | | |
| — | | |
| (2,033 | ) |
| Gain on change in value of derivative warrant liability | |
| — | | |
| — | | |
| — | | |
| — | | |
| (415 | ) | |
| (415 | ) |
| Stock-based compensation | |
| — | | |
| — | | |
| — | | |
| — | | |
| 733 | | |
| 733 | |
| (Gain) loss on sale of assets | |
| — | | |
| — | | |
| — | | |
| (1,156 | ) | |
| (70,876 | ) | |
| (72,032 | ) |
| Acquisition costs | |
| — | | |
| — | | |
| — | | |
| — | | |
| 4,308 | | |
| 4,308 | |
| Adjusted EBITDA | |
$ | 13,624 | | |
$ | (1,985 | ) | |
$ | 11,639 | | |
$ | (443 | ) | |
$ | (10,469 | ) | |
$ | 727 | |
| | |
Six Months Ended June 30, 2022 | |
| In thousands | |
Mobile Refinery | | |
Legacy Refining & Marketing | | |
Total Refining & Marketing | | |
Black Oil and Recovery | | |
Corporate | | |
Consolidated | |
| Net income (loss) | |
$ | (23,961 | ) | |
$ | 290 | | |
$ | (23,671 | ) | |
$ | (26,015 | ) | |
$ | (14,904 | ) | |
$ | (64,590 | ) |
| Depreciation and amortization | |
| 3,722 | | |
| 251 | | |
| 3,973 | | |
| 3,315 | | |
| 246 | | |
| 7,534 | |
| Income tax expense (benefit) | |
| — | | |
| — | | |
| — | | |
| — | | |
| — | | |
| — | |
| Interest expense | |
| 3,250 | | |
| — | | |
| 3,250 | | |
| 44,469 | | |
| 4,235 | | |
| 51,954 | |
| EBITDA | |
$ | (16,989 | ) | |
$ | 541 | | |
$ | (16,448 | ) | |
$ | 21,769 | | |
$ | (10,423 | ) | |
$ | (5,102 | ) |
| Unrealized (gain) loss on hedging activities | |
| 46,901 | | |
| — | | |
| 46,901 | | |
| (268.00 | ) | |
| — | | |
| 46,633 | |
| Inventory valuation adjustments | |
| 23,180 | | |
| — | | |
| 23,180 | | |
| — | | |
| — | | |
| 23,180 | |
| Gain on change in value of derivative warrant liability | |
| — | | |
| — | | |
| — | | |
| 945.00 | | |
| 3,579 | | |
| 4,524 | |
| Stock-based compensation | |
| — | | |
| — | | |
| — | | |
| 324.00 | | |
| 250 | | |
| 574 | |
| (Gain) loss on sale of assets | |
| — | | |
| — | | |
| — | | |
| (415 | ) | |
| — | | |
| (415 | ) |
| Acquisition costs | |
| 9,078 | | |
| — | | |
| 9,078 | | |
| — | | |
| 4,560 | | |
| 13,638 | |
| Enviromental clean-up | |
| 1,428 | | |
| — | | |
| 1,428 | | |
| — | | |
| — | | |
| 1,428 | |
| Other | |
| (19 | ) | |
| — | | |
| (19 | ) | |
| (128.00 | ) | |
| — | | |
| (147 | ) |
| Adjusted EBITDA | |
$ | 63,579 | | |
$ | 541 | | |
$ | 64,120 | | |
$ | 22,227 | | |
$ | (2,034 | ) | |
$ | 84,313 | |
Unaudited Reconciliation of Long-Term Debt to
Net Long-Term Debt and Ratio of Net Debt
| In thousands | |
As of | |
| | |
June 30,
2023 | | |
June 30,
2022 | | |
December 31,
2022 | |
| Long-Term Debt: | |
| | | |
| | | |
| | |
| Senior Convertible Note | |
$ | 15,230 | | |
$ | 41,543 | | |
$ | 95,178 | |
| Term Loan 2025 | |
| 150,075 | | |
| 165,000 | | |
| 165,000 | |
| Finance lease liability long-term | |
| 67,290 | | |
| 44,640 | | |
| 45,164 | |
| Finance lease liability short-term | |
| 2,320 | | |
| 652 | | |
| 1,363 | |
| Operating lease liability long-term | |
| 66,914 | | |
| 3,816 | | |
| 44,545 | |
| Operating lease liability short-term | |
| 25,588 | | |
| 953 | | |
| 9,012 | |
| Long-Term Debt and Lease Obligations | |
$ | 327,417 | | |
$ | 256,604 | | |
$ | 360,262 | |
| Unamortized discount and deferred financing costs | |
| (33,402 | ) | |
| (37,035 | ) | |
| (81,918 | ) |
| Insurance premiums financed | |
| 9,995 | | |
| 9,236 | | |
| 5,602 | |
| Long-Term Debt and Lease Obligations per Balance Sheet | |
$ | 304,010 | | |
$ | 228,805 | | |
$ | 283,946 | |
| Cash and Cash Equivalents | |
| (48,532 | ) | |
| (97,914 | ) | |
| (141,248 | ) |
| Restricted Cash | |
| (3,603 | ) | |
| (100 | ) | |
| (4,929 | ) |
| Total Cash and Cash Equivalents | |
$ | (52,135 | ) | |
$ | (98,014 | ) | |
$ | (146,177 | ) |
| Net Long-Term Debt | |
$ | 275,282 | | |
$ | 158,590 | | |
$ | 214,085 | |
| Adjusted EBITDA | |
$ | 77,477 | | |
$ | 95,280 | | |
$ | 161,000 | |
| Ratio of Net Debt | |
| 3.6 | x | |
| 1.7 | x | |
| 1.3 | x |
VERTEX ENERGY, INC. 8-K
EXHIBIT 99.2

Second Quarter 2023 Quarterly Results Summary Presentation August 2023

DISCLAIMER Forward - looking statements 2 Certain of the matters discussed in this communication which are not statements of historical fact constitute forward - looking statements within the meaning of the securities laws, including the Private Securities Litigation Reform Act of 1995 , that involve a number of risks and uncertainties . Words such as “strategy,” “expects,” “continues,” “plans,” “anticipates,” “believes,” “would,” “will,” “estimates,” “ intends ,” “projects,” “goals,” “targets” and other words of similar meaning are intended to identify forward - looking statements but are not the exclusive means of identifying these statements . Any statements made in this news release other than those of historical fact, about an action, event or development, are forward - looking statements . The important factors that may cause actual results and outcomes to differ materially from those contained in such forward - looking statements include, without limitation, the Company’s projected Outlook for the third quarter of 2023 , as discussed above ; the need for additional capital in the future, including, but not limited to, in order to complete future capital projects and satisfy liabilities, the Company’s ability to raise such capital in the future, and the terms of such funding ; the timing of planned capital projects at the Company’s refinery located in Mobile, Alabama (the “Mobile Refinery”) and the outcome of such projects ; the future production of the Mobile Refinery, including but not limited to renewable diesel production ; estimated and actual production and costs associated with the renewable diesel capital project ; estimated revenues over the course of the agreement with Idemitsu ; anticipated and unforeseen events which could reduce future production at the Mobile Refinery or delay planned and future capital projects ; changes in commodity and credits values ; certain early termination rights associated with third party agreements and conditions precedent to such agreements ; certain mandatory redemption provisions of the outstanding senior convertible notes, the conversion rights associated therewith, and dilution caused by conversions and/or the exchanges of convertible notes ; the Company’s ability to comply with required covenants under outstanding senior notes and a term loan and pay amounts due under such senior notes and term loan, including interest and other amounts due thereunder ; the ability of the Company to retain and hire key personnel ; the level of competition in the Company’s industry and its ability to compete ; the Company’s ability to respond to changes in its industry ; the loss of key personnel or failure to attract, integrate and retain additional personnel ; the Company’s ability to protect intellectual property and not infringe on others’ intellectual property ; the Company’s ability to scale its business ; the Company’s ability to maintain supplier relationships and obtain adequate supplies of feedstocks ; the Company’s ability to obtain and retain customers ; the Company’s ability to produce products at competitive rates ; the Company’s ability to execute its business strategy in a very competitive environment ; trends in, and the market for, the price of oil and gas and alternative energy sources ; the impact of inflation on margins and costs ; the volatile nature of the prices for oil and gas caused by supply and demand, including volatility caused by the ongoing Ukraine/Russia conflict, increased interest rates, recessions and increased inflation ; the Company’s ability to maintain relationships with partners ; the outcome of pending and potential future litigation, judgments and settlements ; rules and regulations making the Company’s operations more costly or restrictive ; volatility in the market price of compliance credits (primarily Renewable Identification Numbers (RINs) needed to comply with the Renewable Fuel Standard (“RFS”)) under renewable and low - carbon fuel programs and emission credits needed under other environmental emissions programs, the requirement for the Company to purchase RINs in the secondary market to the extent it does not generate sufficient RINs internally, liabilities associated therewith and the timing, funding and costs of such required purchases, if any ; changes in environmental and other laws and regulations and risks associated with such laws and regulations ; economic downturns both in the United States and globally, increases in inflation and interest rates, increased costs of borrowing associated therewith and potential declines in the availability of such funding ; risk of increased regulation of the Company’s operations and products ; disruptions in the infrastructure that the Company and its partners rely on ; interruptions at the Company’s facilities ; unexpected and expected changes in the Company’s anticipated capital expenditures resulting from unforeseen and expected required maintenance, repairs, or upgrades ; the Company’s ability to acquire and construct new facilities ; the Company’s ability to effectively manage growth ; decreases in global demand for, and the price of, oil, due to inflation, recessions or other reasons, including declines in economic activity or global conflicts ; expected and unexpected downtime at the Company’s facilities ; the Company’s level of indebtedness, which could affect its ability to fulfill its obligations, impede the implementation of its strategy, and expose the Company’s interest rate risk ; dependence on third party transportation services and pipelines ; risks related to obtaining required crude oil supplies, and the costs of such supplies ; counterparty credit and performance risk ; unanticipated problems at, or downtime effecting, the Company’s facilities and those operated by third parties ; risks relating to the Company’s hedging activities or lack of hedging activities ; and risks relating to planned and future divestitures, asset sales, joint ventures and acquisitions . Other important factors that may cause actual results and outcomes to differ materially from those contained in the forward - looking statements included in this communication are described in the Company’s publicly filed reports, including, but not limited to, the Company’s Annual Report on Form 10 - K for the year ended December 31 , 2022 , and the Company’s Quarterly Report on Form 10 - Q for the quarter ended June 30 , 2023 , and future Annual Reports on Form 10 - K and Quarterly Reports on Form 10 - Q . These reports are available at www . sec . gov . The Company cautions that the foregoing list of important factors is not complete . All subsequent written and oral forward - looking statements attributable to the Company or any person acting on behalf of the Company are expressly qualified in their entirety by the cautionary statements referenced above . Other unknown or unpredictable factors also could have material adverse effects on Vertex’s future results . The forward - looking statements included in this press release are made only as of the date hereof . Vertex cannot guarantee future results, levels of activity, performance or achievements . Accordingly, you should not place undue reliance on these forward - looking statements . Finally, Vertex undertakes no obligation to update these statements after the date of this release, except as required by law, and takes no obligation to update or correct information prepared by third parties that are not paid for by Vertex . If we update one or more forward - looking statements, no inference should be drawn that we will make additional updates with respect to those or other forward - looking statements . The financial projections (the “Projections”) included herein were prepared by Vertex in good faith using assumptions believed to be reasonable . A significant number of assumptions about the operations of the business of Vertex were based, in part, on economic, competitive, and general business conditions prevailing at the time the Projections were developed . Any future changes in these conditions, may materially impact the ability of Vertex to achieve the financial results set forth in the Projections . The Projections are based on numerous assumptions, including realization of the operating strategy of Vertex ; industry performance ; no material adverse changes in applicable legislation or regulations, or the administration thereof, or generally accepted accounting principles ; general business and economic conditions ; competition ; retention of key management and other key employees ; absence of material contingent or unliquidated litigation, indemnity, or other claims ; minimal changes in current pricing ; static material and equipment pricing ; no significant increases in interest rates or inflation ; and other matters, many of which will be beyond the control of Vertex, and some or all of which may not materialize . The Projections also assume the continued uptime of the Company’s facilities at historical levels and the successful funding of, timely completion of, and successful outcome of, planned capital projects . Additionally, to the extent that the assumptions inherent in the Projections are based upon future business decisions and objectives, they are subject to change . Although the Projections are presented with numerical specificity and are based on reasonable expectations developed by Vertex’s management, the assumptions and estimates underlying the Projections are subject to significant business, economic, and competitive uncertainties and contingencies, many of which will be beyond the control of Vertex . Accordingly, the Projections are only estimates and are necessarily speculative in nature . It is expected that some or all of the assumptions in the Projections will not be realized and that actual results will vary from the Projections . Such variations may be material and may increase over time . In light of the foregoing, readers are cautioned not to place undue reliance on the Projections . The projected financial information contained herein should not be regarded as a representation or warranty by Vertex, its management, advisors, or any other person that the Projections can or will be achieved . Vertex cautions that the Projections are speculative in nature and based upon subjective decisions and assumptions . As a result, the Projections should not be relied on as necessarily predictive of actual future events .

In addition to our results calculated under generally accepted accounting principles in the United States (“GAAP”), in this news release we also present Adjusted EBITDA, Adjusted Gross Margin, Fuel Gross Margin, Fuel Gross Margin Per Barrel of Throughput, Operating Expenses Per Barrel of Throughput, RIN Adjusted Fuel Gross Margin, RIN Adjusted Fuel Gross Margin Per Barrel of Throughput, Net Long - Term Debt and Ratio of Net Long - Term Debt (collectively, the “Non - GAAP Financial Measures”) The Non - GAAP Financial Measures are “non - GAAP financial measures” presented as supplemental measures of the Company’s performance . They are not presented in accordance with GAAP . EBITDA represents net income before interest, taxes, depreciation and amortization, for continued and discontinued operations . Adjusted EBITDA represents net income (loss) from operations plus unrealized gain or losses on hedging activities, Renewable Fuel Standard (RFS) costs (mainly related to Renewable Identification Numbers (RINs), and inventory adjustments, depreciation and amortization, acquisition costs, gain on change in value of derivative warrant liability, environmental clean - up, stock - based compensation, (gain) loss on sale of assets, interest expense, and certain other unusual or non - recurring charges included in selling, general, and administrative expenses . Adjusted Gross Margin is defined as gross profit (loss) plus unrealized gain or losses on hedging activities and inventory valuation adjustments . Fuel Gross Margin is defined as Adjusted Gross Margin, plus production costs, operating expenses and depreciation attributable to cost of revenues and other non - fuel items included in costs of revenues including realized and unrealized gain or losses on hedging activities, RFS costs (mainly related to RINs), inventory valuation adjustments, fuel financing costs and other revenues and cost of sales items . Fuel Gross Margin Per Barrel of Throughput is calculated as fuel gross margin divided by total throughput barrels for the period presented . Operating Expenses Per Barrel of Throughput is defined as total operating expenses divided by total barrels of throughput . RIN Adjusted Fuel Gross Margin is defined as [Fuel Gross Margin minus RIN expense divided by total barrels of throughput . RIN Adjusted Fuel Gross Margin Per Barrel of Throughput is calculated as RIN Adjusted Fuel Gross Margin divided by total throughput barrels for the period presented . Net Long - Term Debt is long - term debt and lease obligations, adjusted for unamortized discount and deferred financing costs, insurance premiums financed, less cash and cash equivalents and restricted cash . Ratio of Net Long - Term Debt is defined as Long - Term Debt divided by Adjusted EBITDA . The Non - GAAP Financial Measures are presented because we believe they provide additional useful information to investors due to the various noncash items during the period . We believe that the Non - GAAP Financial Measures are also frequently used by analysts, investors and other interested parties to evaluate companies in our industry . We use the Non - GAAP Financial Measures as supplements to GAAP measures of performance to evaluate the effectiveness of our business strategies, to make budgeting decisions, to allocate resources and to compare our performance relative to our peers . Additionally, these measures, when used in conjunction with related GAAP financial measures, provide investors with an additional financial analytical framework which management uses, in addition to historical operating results, as the basis for financial, operational and planning decisions and present measurements that third parties have indicated are useful in assessing the Company and its results of operations . The Non - GAAP Financial Measures are unaudited, and have limitations as analytical tools, and you should not consider them in isolation, or as a substitute for analysis of our operating results as reported under GAAP . Some of these limitations are : the Non - GAAP Financial Measures do not reflect cash expenditures, or future requirements for capital expenditures, or contractual commitments ; the Non - GAAP Financial Measures do not reflect changes in, or cash requirements for, capital expenditures or working capital needs ; the Non - GAAP Financial Measures do not reflect the significant interest expense, or the cash requirements necessary to service interest or principal payments, on debt or cash income tax payments ; although depreciation and amortization are noncash charges, the assets being depreciated and amortized will often have to be replaced in the future, the Non - GAAP Financial Measures do not reflect any cash requirements for such replacements ; Adjusted EBITDA, Adjusted Gross Margin, Fuel Gross Margin and RIN Adjusted Fuel Gross Margin represent only a portion of our total operating results ; and other companies in this industry may calculate the Non - GAAP Financial Measures differently than we do, limiting their usefulness as a comparative measure . The Company’s presentation of these measures should not be construed as an inference that future results will be unaffected by unusual or nonrecurring items . We compensate for these limitations by providing a reconciliation of each of these non - GAAP measures to the most comparable GAAP measure . We encourage investors and others to review our business, results of operations, and financial information in their entirety, not to rely on any single financial measure, and to view these non - GAAP measures in conjunction with the most directly comparable GAAP financial measure . For more information on these non - GAAP financial measures, please see the sections titled “Unaudited Reconciliation of Gross Profit (Loss) From Continued and Discontinued Operations to Adjusted Gross Margin, Fuel Gross Margin, Fuel Gross Margin Per Barrel of Throughput, Operating Expenses Per Barrel of Throughput, RIN Adjusted Fuel Gross Margin and RIN Adjusted Fuel Gross Margin Per Barrel of Throughput”, “Unaudited Reconciliation of Adjusted EBITDA to Net loss from Continued and Discontinued Operations”, and “Unaudited Reconciliation of Long - Term Debt to Net Long - Term Debt and Ratio of Net Debt”, at the end of this release . DISCLAIMER Non - GAAP Financial Measures 3

SECOND QUARTER 2023 Performance Summary
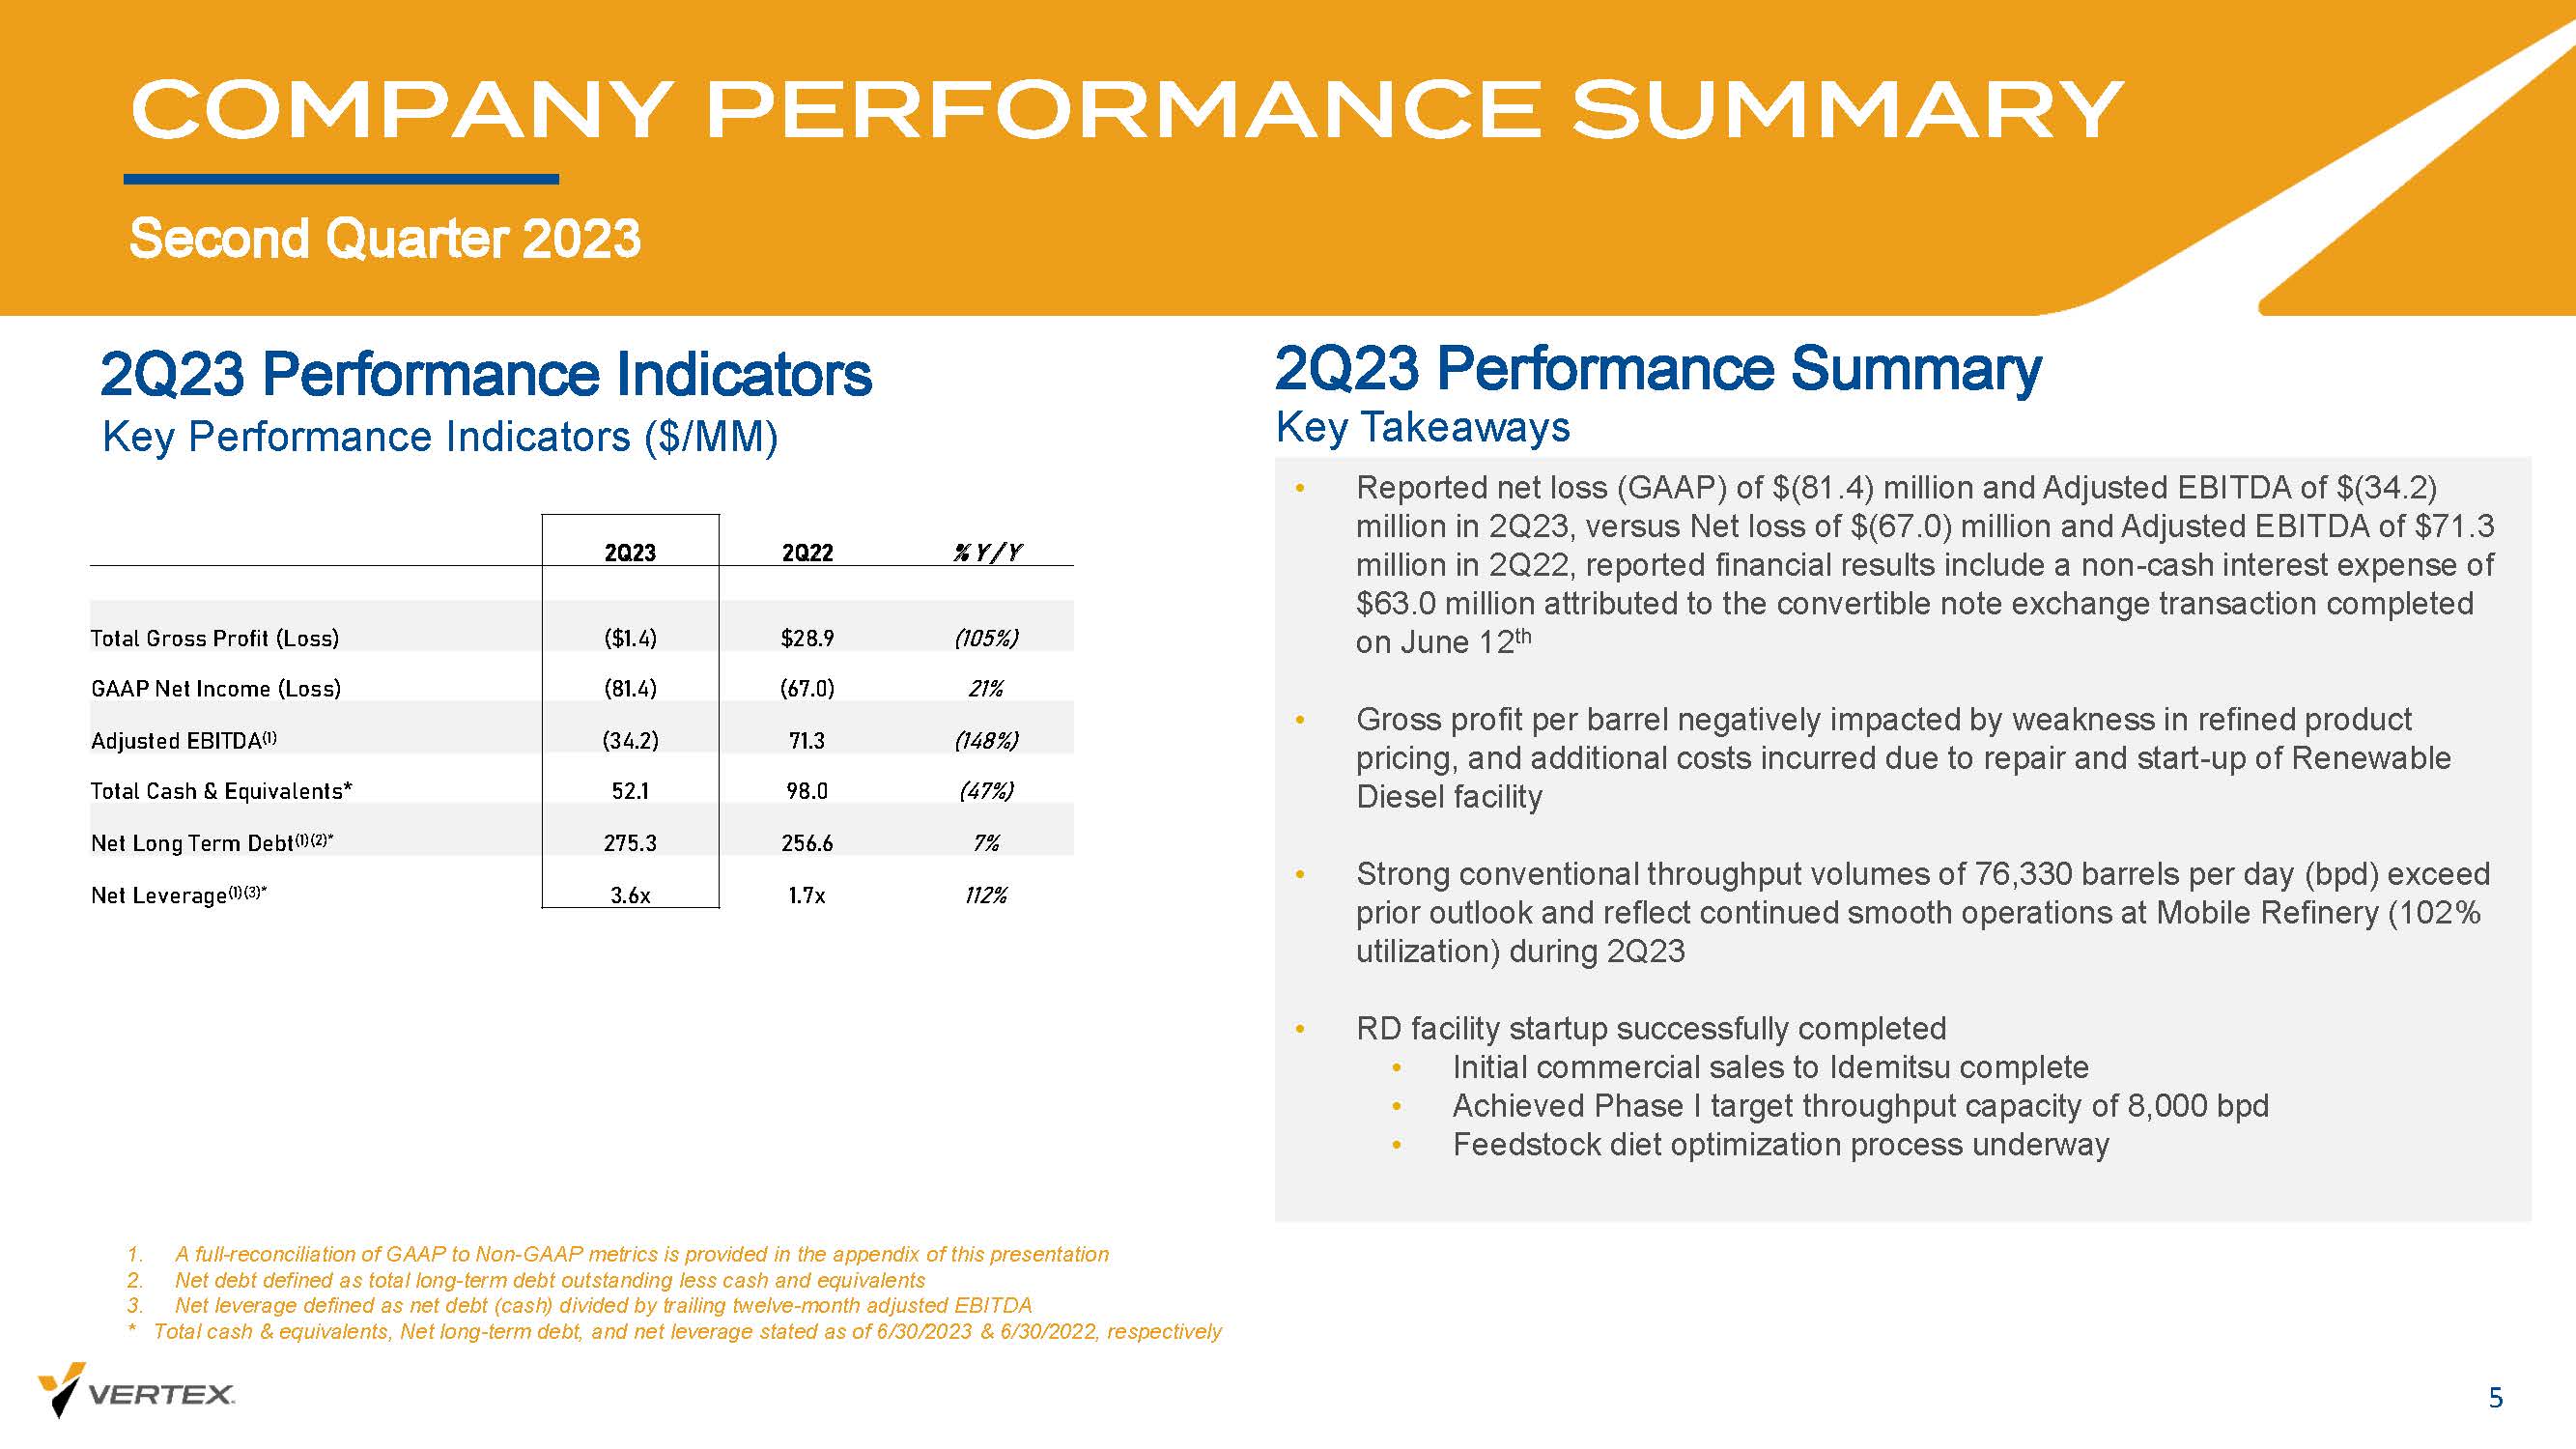
2Q23 Performance Indicators COMPANY PERFORMANCE SUMMARY Second Quarter 2023 5 1. A full - reconciliation of GAAP to Non - GAAP metrics is provided in the appendix of this presentation 2. Net debt defined as total long - term debt outstanding less cash and equivalents 3. Net leverage defined as net debt (cash) divided by trailing twelve - month adjusted EBITDA * Total cash & equivalents, Net long - term debt, and net leverage stated as of 6/30/2023 & 6/30/2022, respectively Key Performance Indicators ($/MM) Key Takeaways 2Q23 Performance Summary • Reported net loss (GAAP) of $(81.4) million and Adjusted EBITDA of $(34.2) million in 2Q23, versus Net loss of $(67.0) million and Adjusted EBITDA of $71.3 million in 2Q22, reported financial results include a non - cash interest expense of $63.0 million attributed to the convertible note exchange transaction completed on June 12 th • Gross profit per barrel negatively impacted by weakness in refined product pricing, and additional costs incurred due to repair and start - up of Renewable Diesel facility • Strong conventional throughput volumes of 76,330 barrels per day (bpd) exceed prior outlook and reflect continued smooth operations at Mobile Refinery (102 % utilization) during 2Q23 • RD facility startup successfully completed • Initial commercial sales to Idemitsu complete • Achieved Phase I target throughput capacity of 8,000 bpd • Feedstock diet optimization process underway % Y / Y 2Q22 2Q23 (105%) $28.9 ($1.4) Total Gross Profit (Loss) 21% (67.0) (81.4) GAAP Net Income (Loss) (148%) 71.3 (34.2) Adjusted EBITDA (1) (47%) 98.0 52.1 Total Cash & Equivalents* 7% 256.6 275.3 Net Long Term Debt (1)(2)* 112% 1.7x 3.6x Net Leverage (1)(3)*
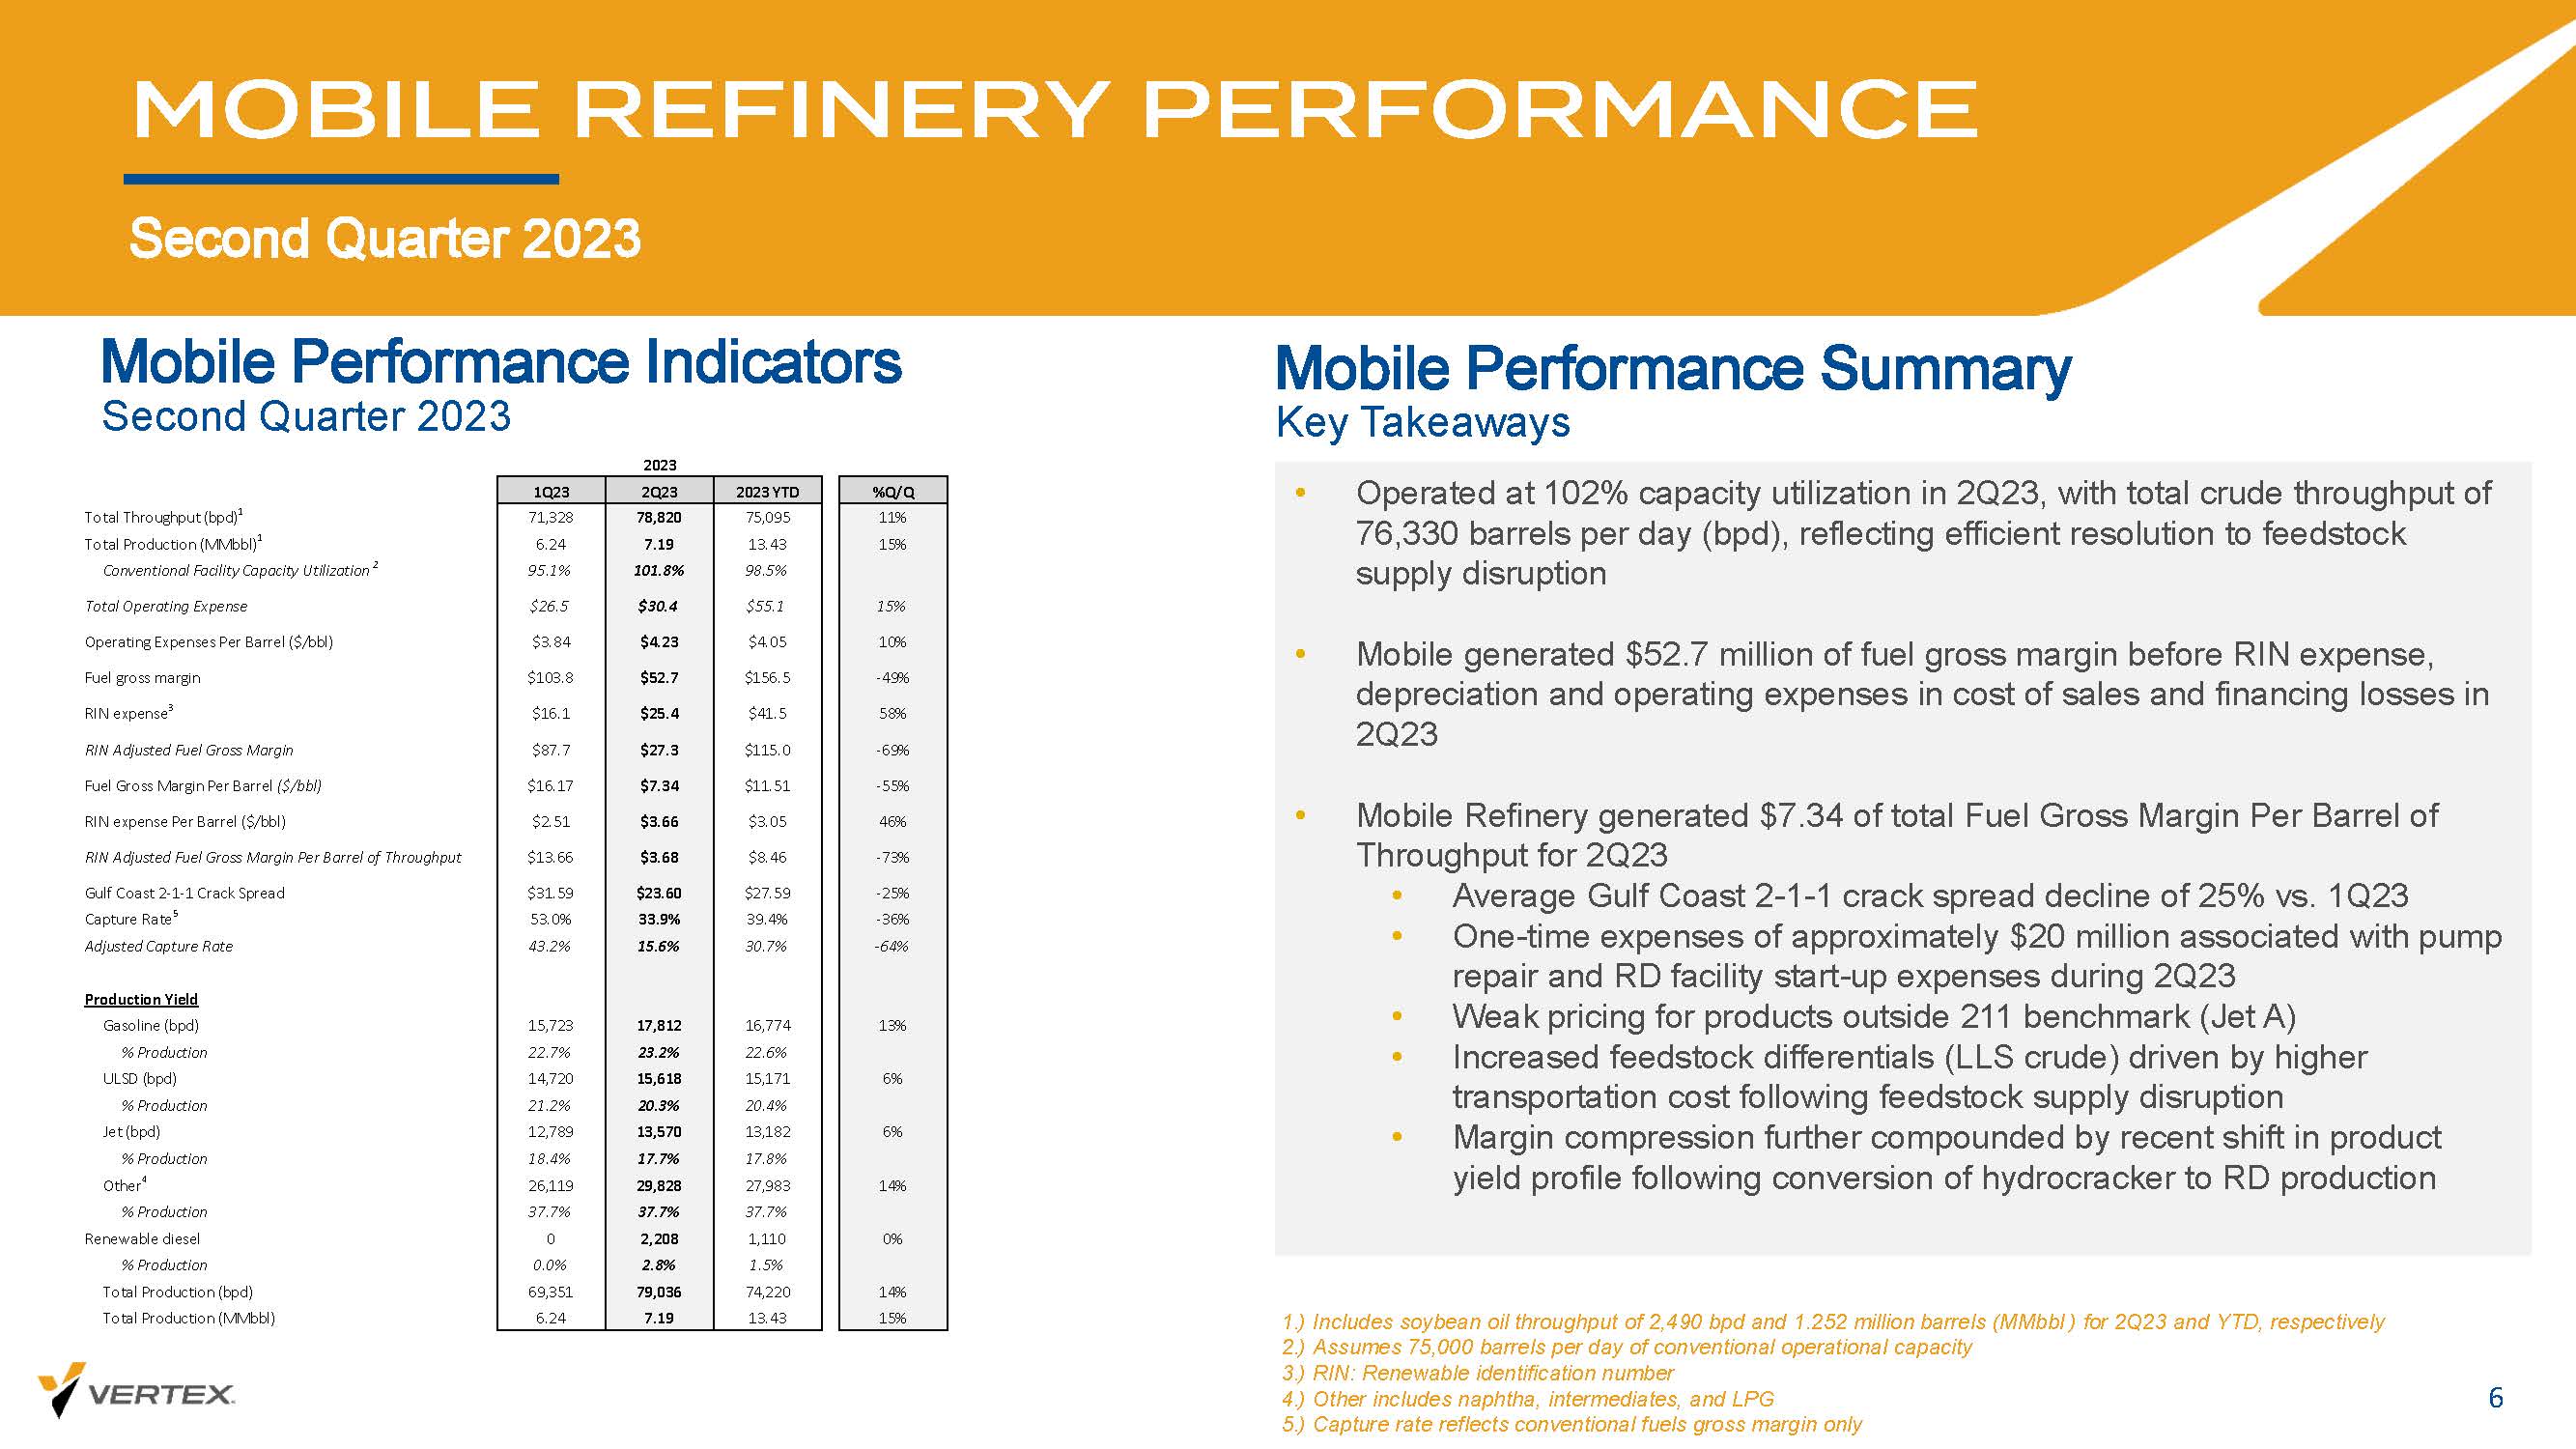
Mobile Performance Indicators MOBILE REFINERY PERFORMANCE Second Quarter 2023 6 • Operated at 102% capacity utilization in 2Q23, with total crude throughput of 76,330 barrels per day (bpd), reflecting efficient resolution to feedstock supply disruption • Mobile generated $52.7 million of fuel gross margin before RIN expense, depreciation and operating expenses in cost of sales and financing losses in 2Q23 • Mobile Refinery generated $7.34 of total Fuel Gross Margin Per Barrel of Throughput for 2Q23 • Average Gulf Coast 2 - 1 - 1 crack spread decline of 25% vs. 1Q23 • One - time expenses of approximately $20 million associated with pump repair and RD facility start - up expenses during 2Q23 • Weak pricing for products outside 211 benchmark (Jet A) • Increased feedstock differentials (LLS crude) driven by higher transportation cost following feedstock supply disruption • Margin compression further compounded by recent shift in product yield profile following conversion of hydrocracker to RD production 1.) Includes soybean oil throughput of 2,490 bpd and 1.252 million barrels ( MMbbl ) for 2Q23 and YTD, respectively 2.) Assumes 75,000 barrels per day of conventional operational capacity 3.) RIN: Renewable identification number 4.) Other includes naphtha, intermediates, and LPG 5.) Capture rate reflects conventional fuels gross margin only Second Quarter 2023 Mobile Performance Summary Key Takeaways 1Q23 2Q23 2023 YTD %Q/Q Total Throughput (bpd) 1 71,328 78,820 75,095 11% Total Production (MMbbl) 1 6.24 7.19 13.43 15% Conventional Facility Capacity Utilization 2 95.1% 101.8% 98.5% Total Operating Expense $26.5 $30.4 $55.1 15% Operating Expenses Per Barrel ($/bbl) $3.84 $4.23 $4.05 10% Fuel gross margin $103.8 $52.7 $156.5 -49% RIN expense 3 $16.1 $25.4 $41.5 58% RIN Adjusted Fuel Gross Margin $87.7 $27.3 $115.0 -69% Fuel Gross Margin Per Barrel ($/bbl) $16.17 $7.34 $11.51 -55% RIN expense Per Barrel ($/bbl) $2.51 $3.66 $3.05 46% RIN Adjusted Fuel Gross Margin Per Barrel of Throughput $13.66 $3.68 $8.46 -73% Gulf Coast 2-1-1 Crack Spread $31.59 $23.60 $27.59 -25% Capture Rate 5 53.0% 33.9% 39.4% -36% Adjusted Capture Rate 43.2% 15.6% 30.7% -64% Production Yield Gasoline (bpd) 15,723 17,812 16,774 13% % Production 22.7% 23.2% 22.6% ULSD (bpd) 14,720 15,618 15,171 6% % Production 21.2% 20.3% 20.4% Jet (bpd) 12,789 13,570 13,182 6% % Production 18.4% 17.7% 17.8% Other 4 26,119 29,828 27,983 14% % Production 37.7% 37.7% 37.7% Renewable diesel 0 2,208 1,110 0% % Production 0.0% 2.8% 1.5% Total Production (bpd) 69,351 79,036 74,220 14% Total Production (MMbbl) 6.24 7.19 13.43 15% 76,828 2023
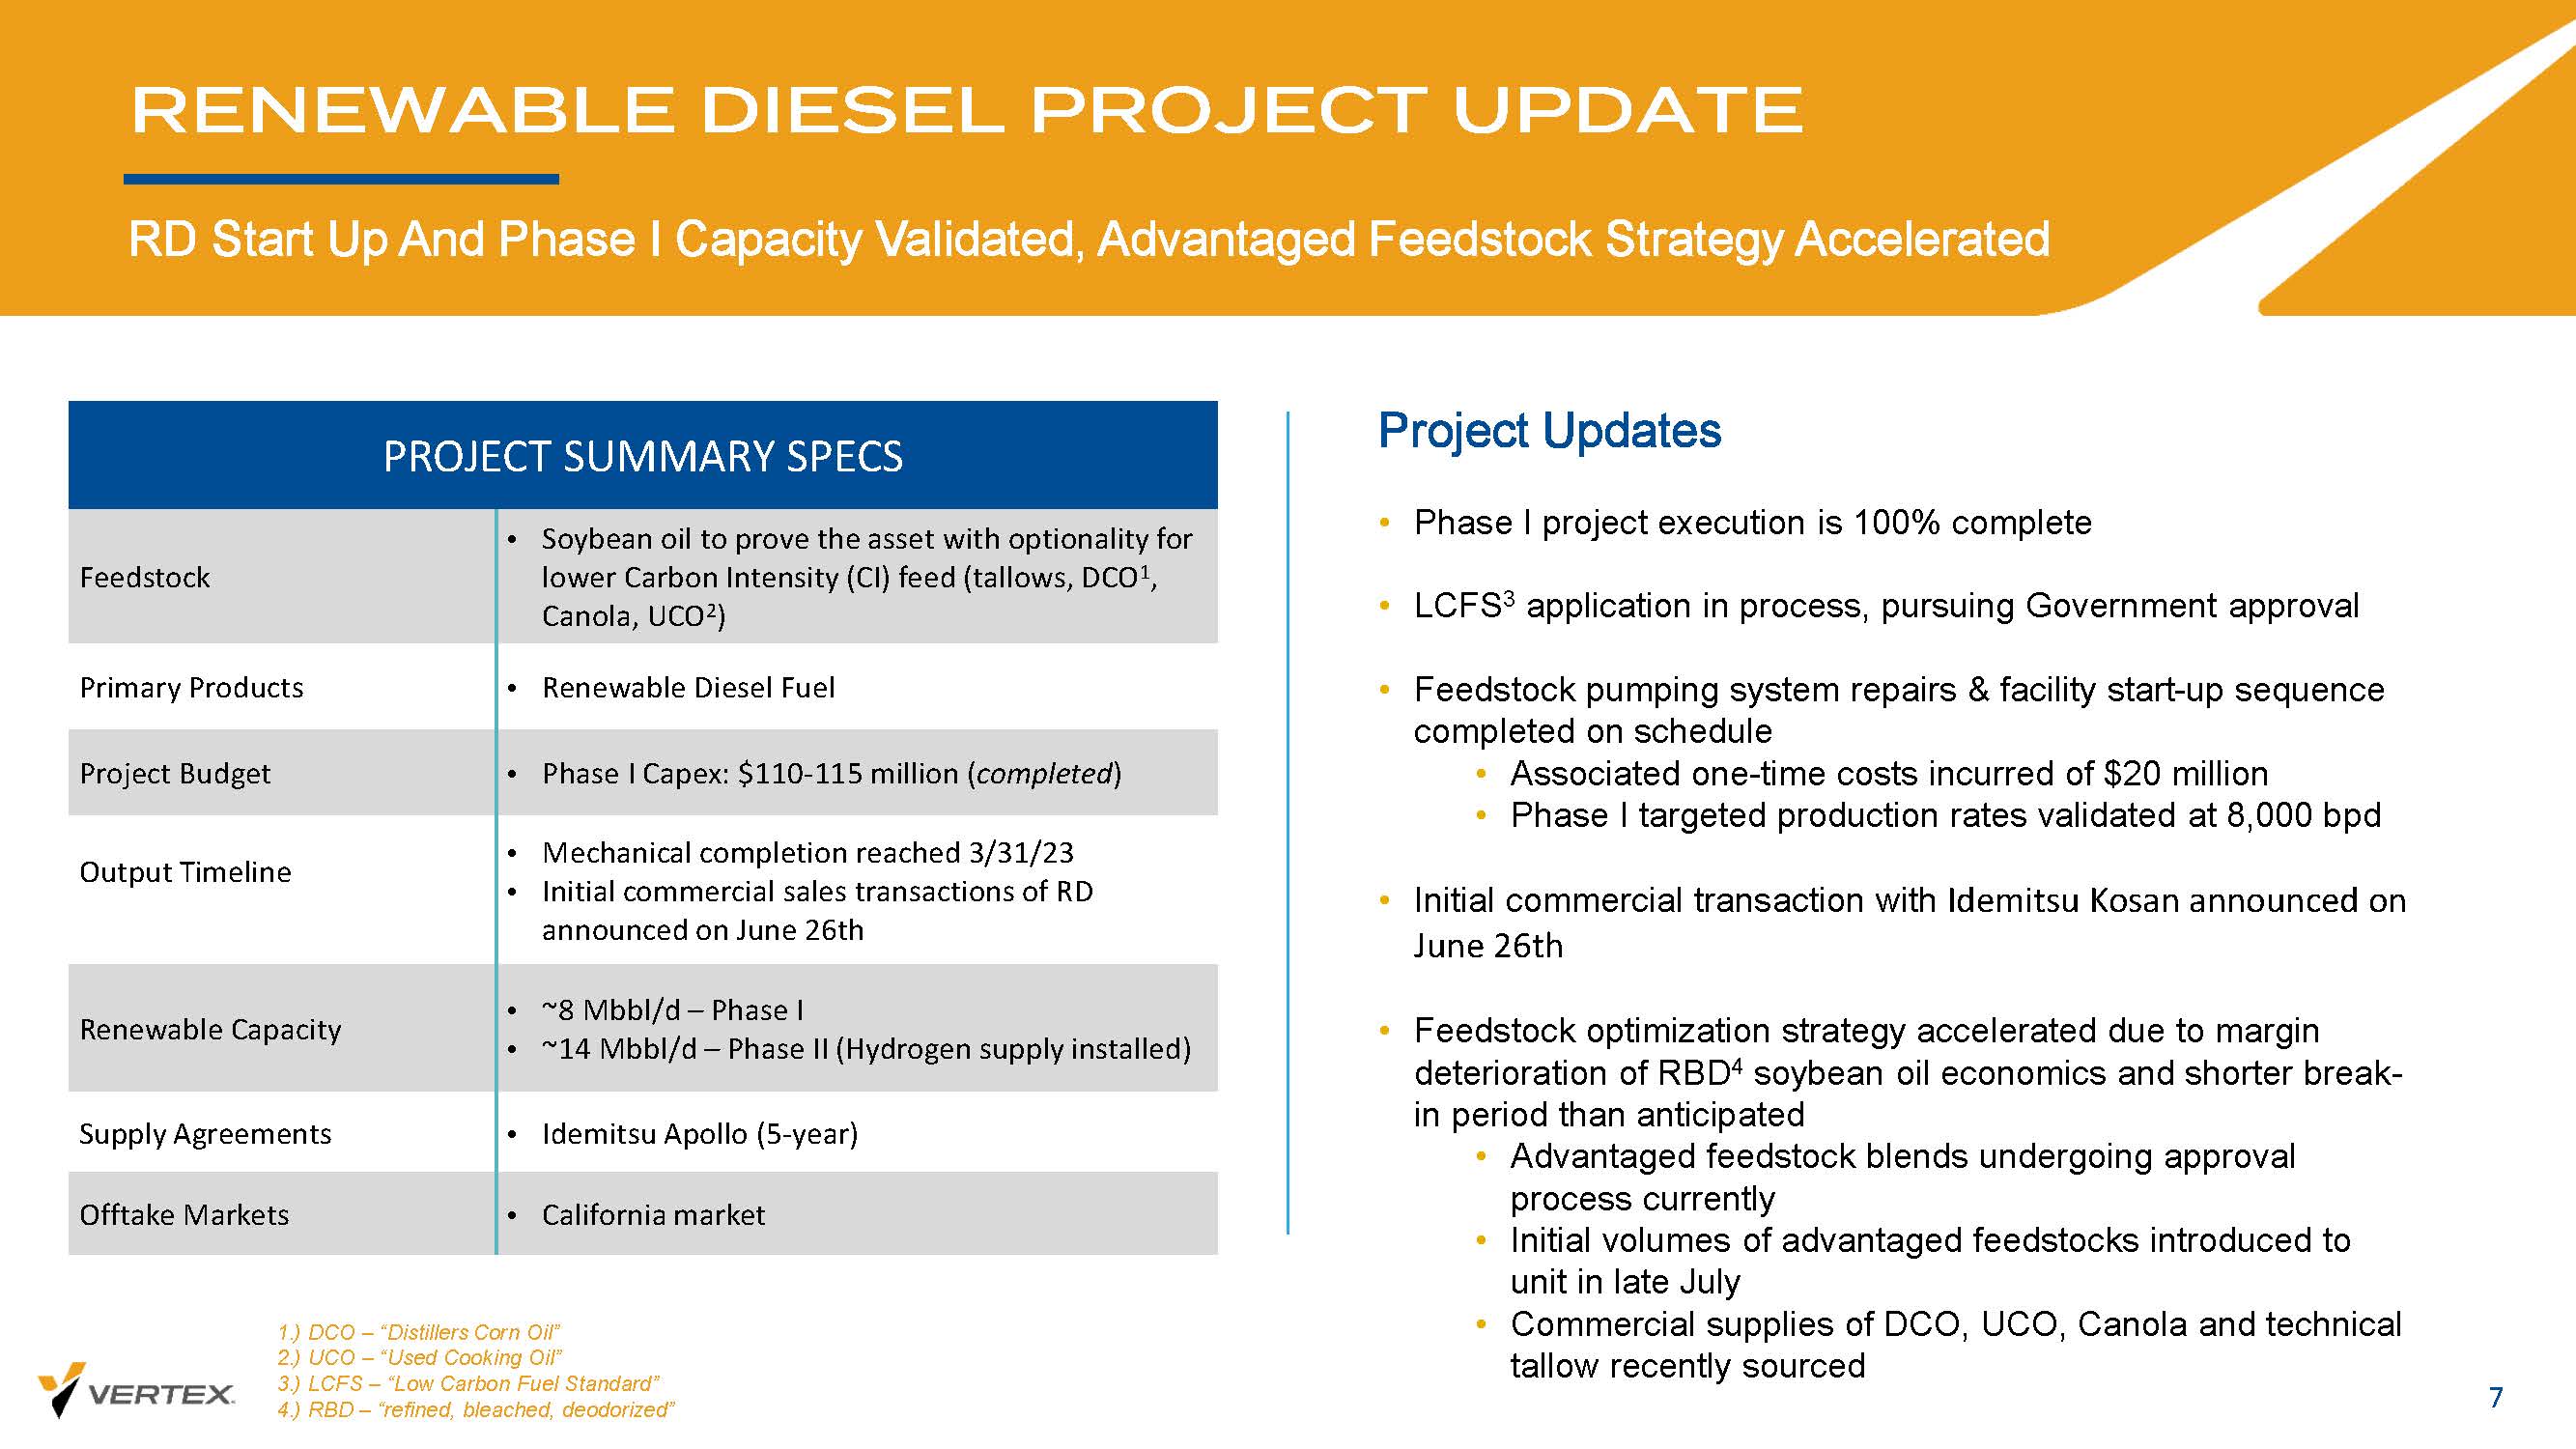
RENEWABLE DIESEL PROJECT UPDATE 7 RD Start Up And Phase I Capacity Validated, Advantaged Feedstock Strategy Accelerated • Soybean oil to prove the asset with optionality for lower Carbon Intensity (CI) feed (tallows, DCO 1 , Canola, UCO 2 ) Feedstock • Renewable Diesel Fuel Primary Products • Phase I Capex: $110 - 115 million ( completed ) Project Budget • Mechanical completion reached 3/31/23 • Initial commercial sales transactions of RD announced on June 26th Output Timeline • ~8 Mbbl /d – Phase I • ~14 Mbbl /d – Phase II (Hydrogen supply installed) Renewable Capacity • Idemitsu Apollo (5 - year) Supply Agreements • California market Offtake Markets PROJECT SUMMARY SPECS Project Updates • Phase I project execution is 100% complete • LCFS 3 application in process, pursuing Government approval • Feedstock pumping system repairs & facility start - up sequence completed on schedule • Associated one - time costs incurred of $20 million • Phase I targeted production rates validated at 8,000 bpd • Initial commercial transaction with Idemitsu Kosan announced on June 26th • Feedstock optimization strategy accelerated due to margin deterioration of RBD 4 soybean oil economics and shorter break - in period than anticipated • Advantaged feedstock blends undergoing approval process currently • Initial volumes of advantaged feedstocks introduced to unit in late July • Commercial supplies of DCO, UCO, Canola and technical tallow recently sourced 1.) DCO – “Distillers Corn Oil” 2.) UCO – “Used Cooking Oil” 3.) LCFS – “Low Carbon Fuel Standard” 4.) RBD – “refined, bleached, deodorized”
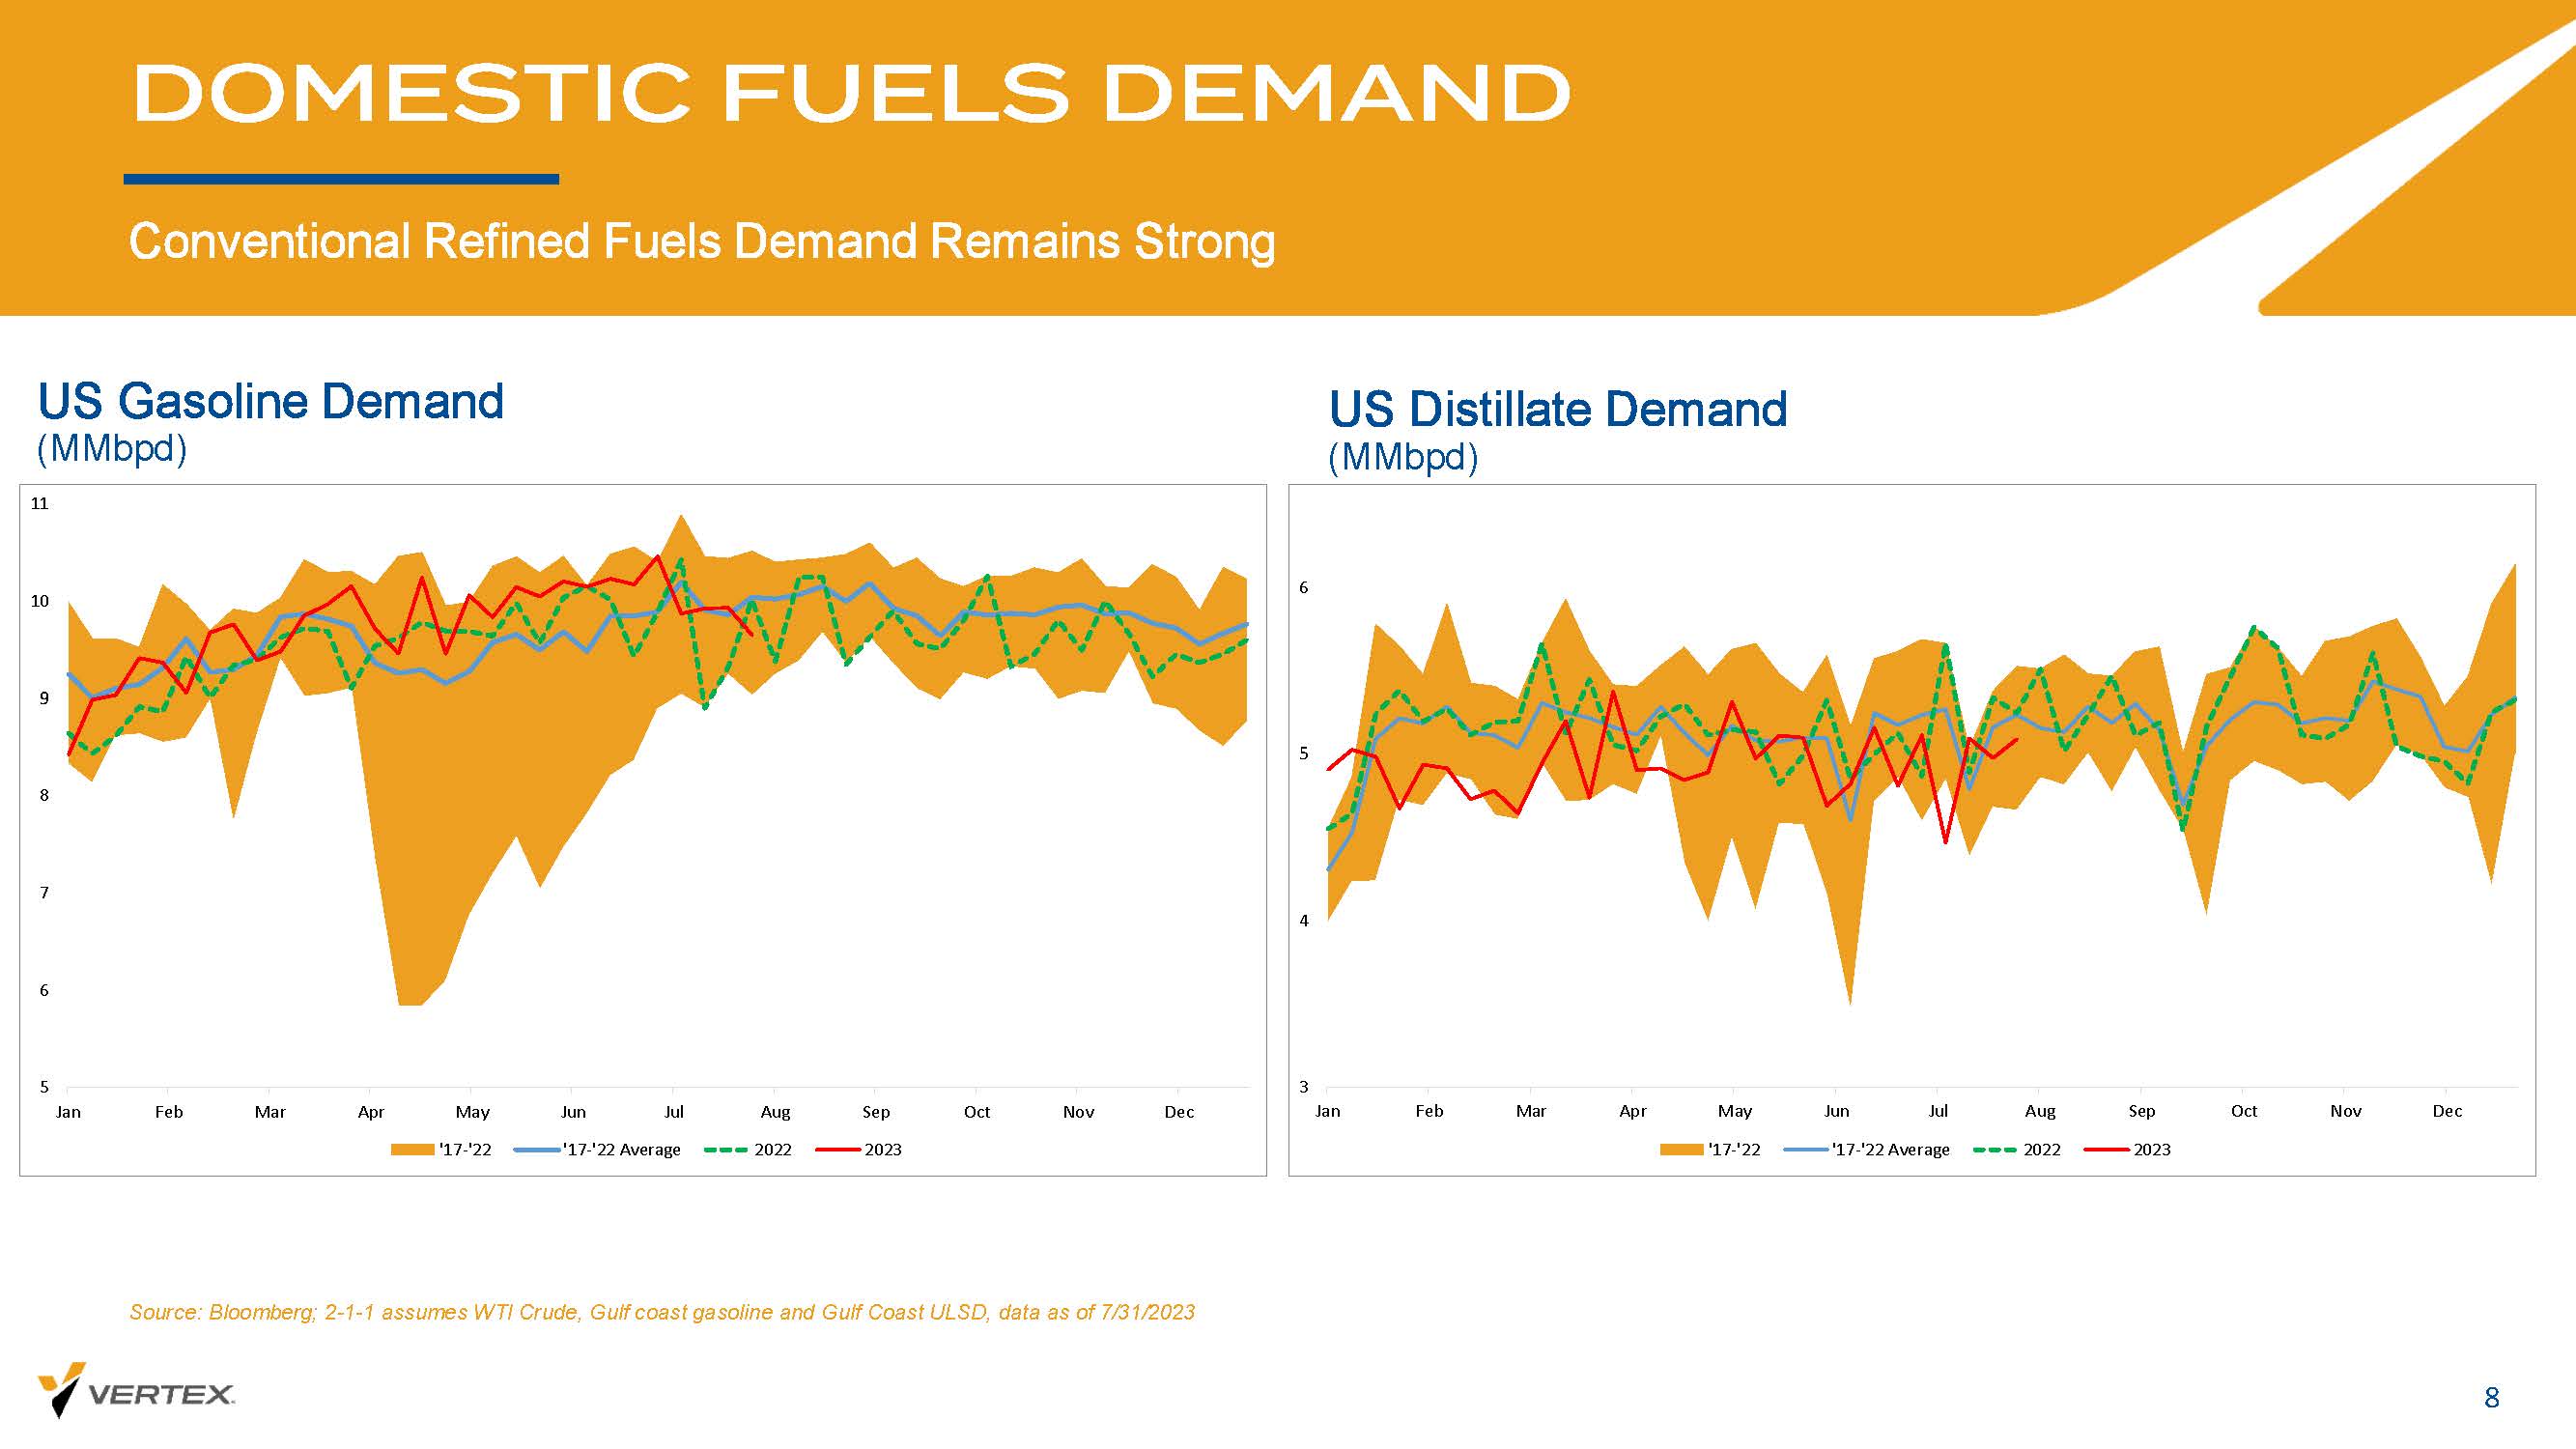
DOMESTIC FUELS DEMAND Conventional Refined Fuels Demand Remains Strong 8 US Gasoline Demand ( MMbpd ) US Distillate Demand ( MMbpd ) Source: Bloomberg; 2 - 1 - 1 assumes WTI Crude, Gulf coast gasoline and Gulf Coast ULSD, data as of 7/31/2023 5 6 7 8 9 10 11 Jan Feb Mar Apr May Jun Jul Aug Sep Oct Nov Dec '17-'22 '17-'22 Average 2022 2023 3 4 5 6 Jan Feb Mar Apr May Jun Jul Aug Sep Oct Nov Dec '17-'22 '17-'22 Average 2022 2023
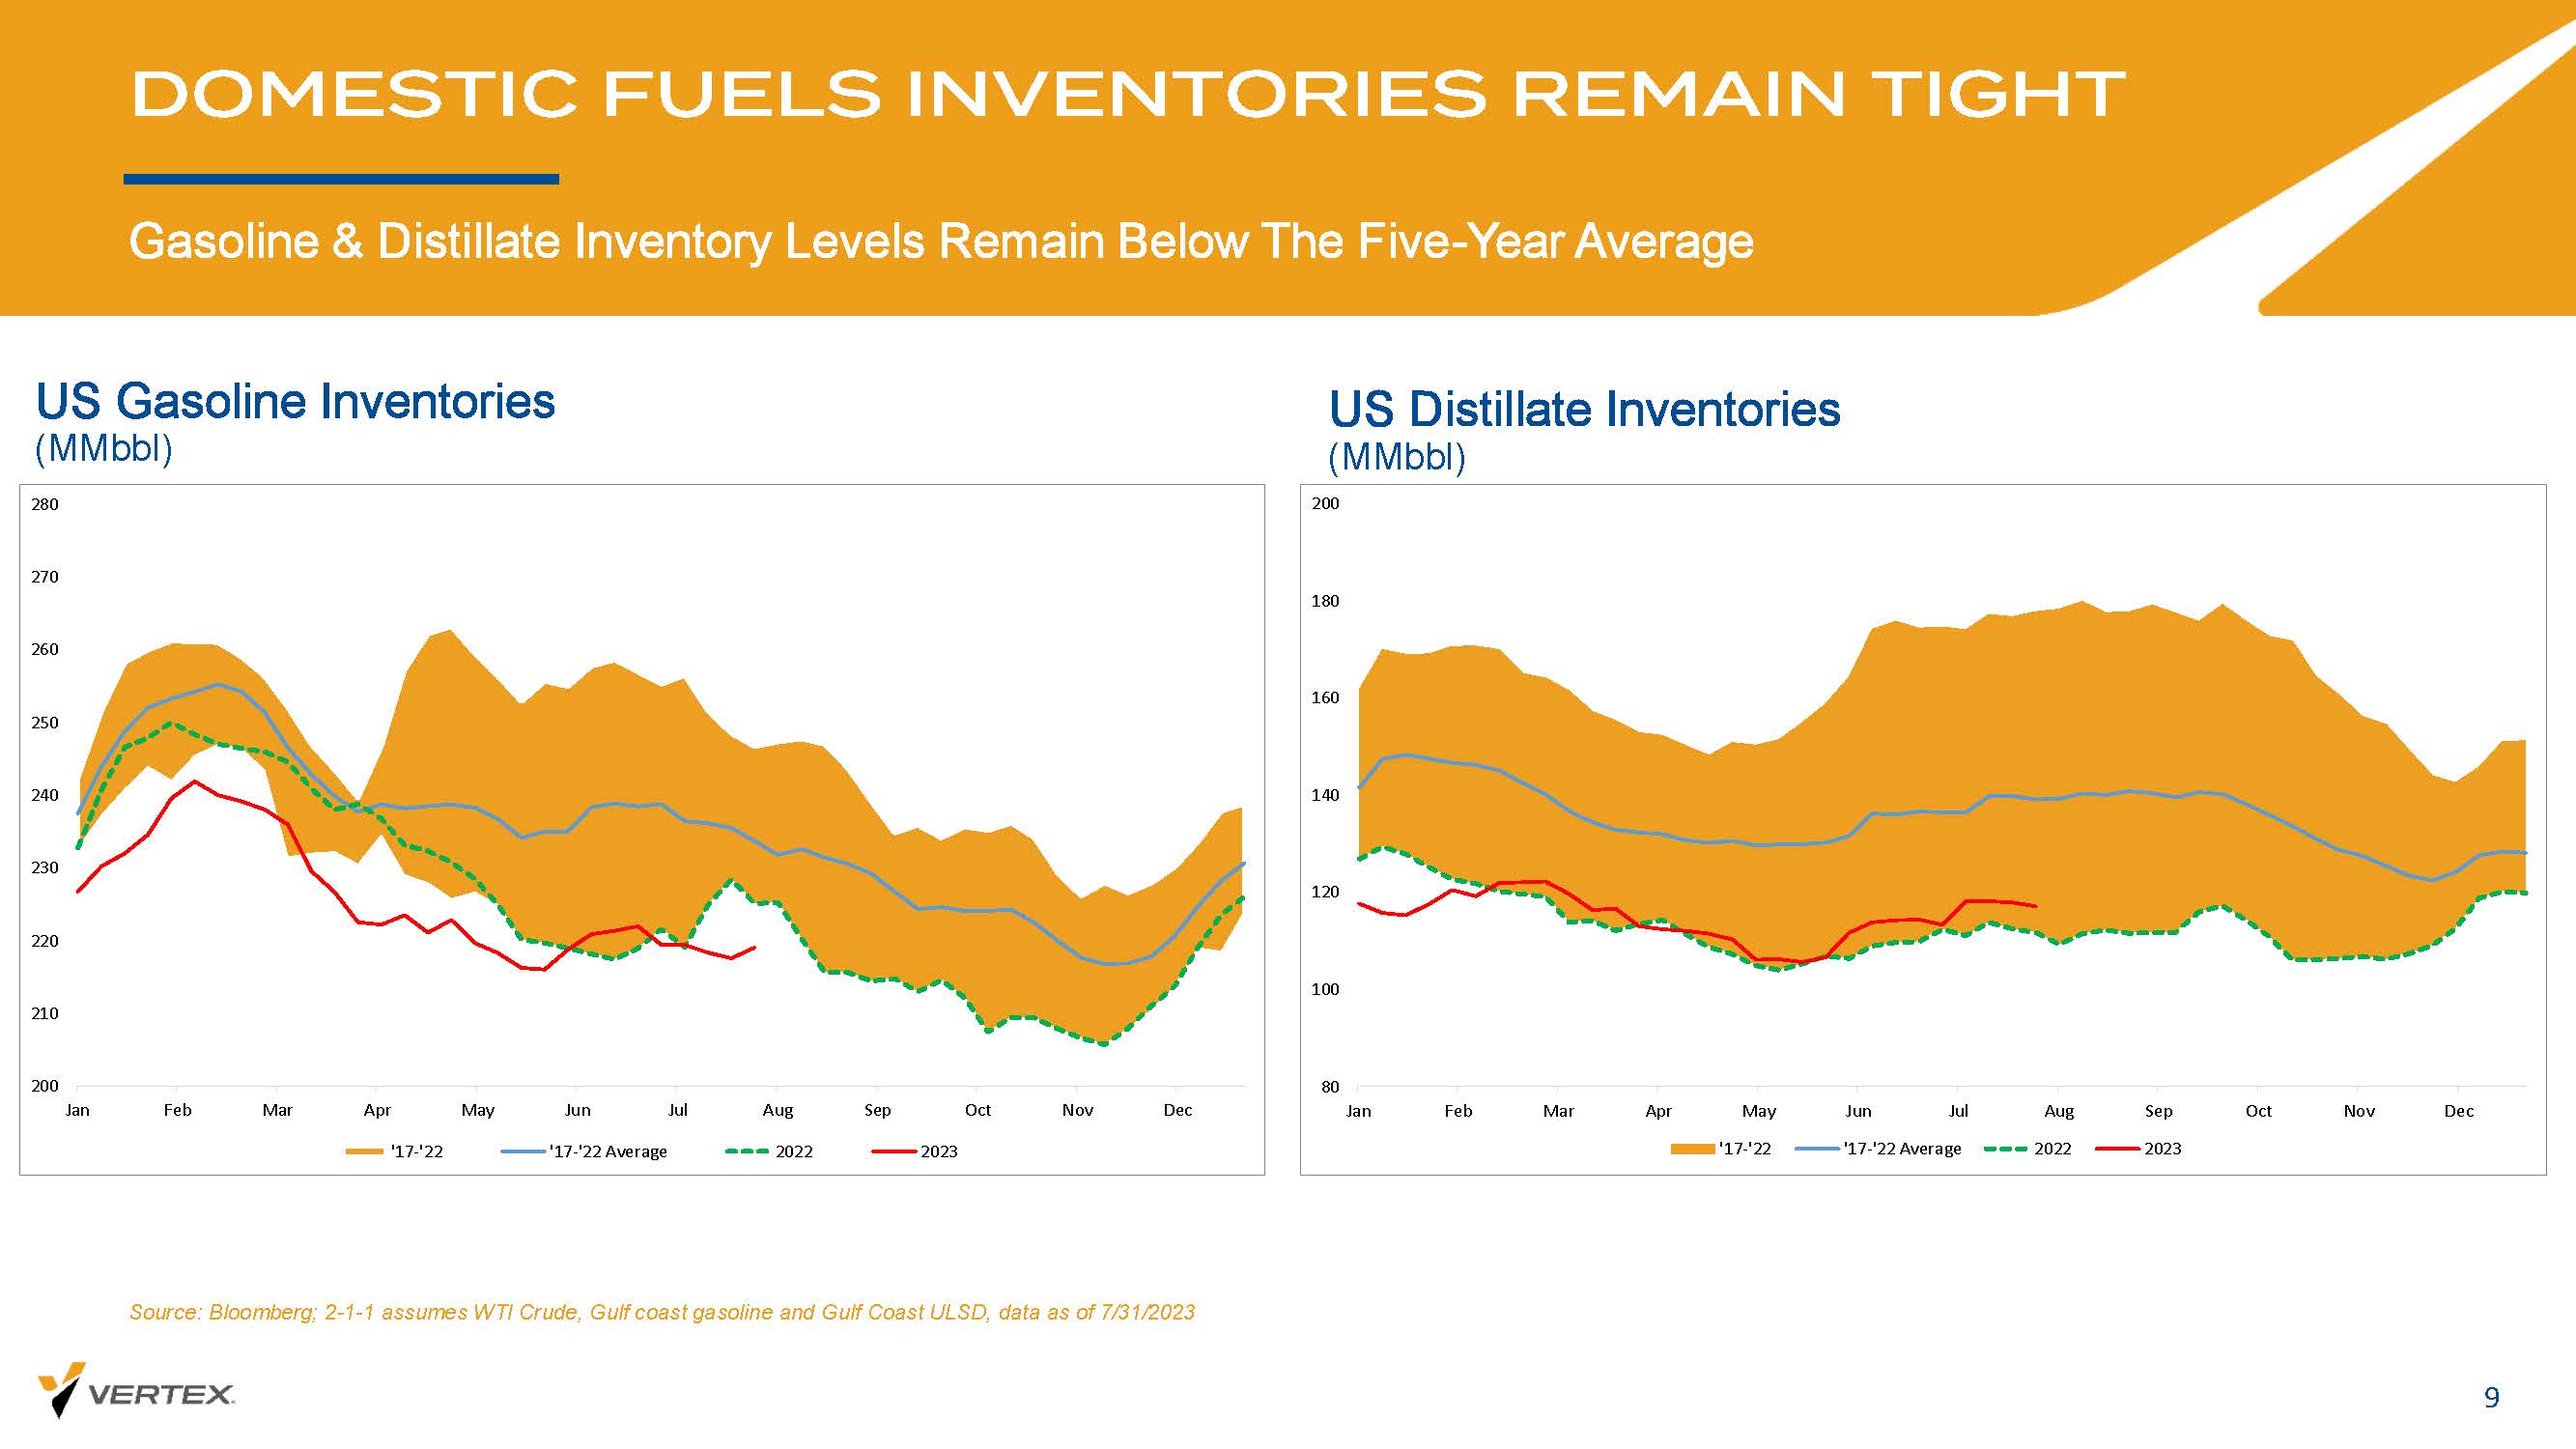
DOMESTIC FUELS INVENTORIES REMAIN TIGHT Gasoline & Distillate Inventory Levels Remain Below The Five - Year Average US Gasoline Inventories 9 ( MMbbl ) US Distillate Inventories ( MMbbl ) Source: Bloomberg; 2 - 1 - 1 assumes WTI Crude, Gulf coast gasoline and Gulf Coast ULSD, data as of 7/31/2023 80 100 120 140 160 180 200 Jan Feb Mar Apr May Jun Jul Aug Sep Oct Nov Dec '17-'22 '17-'22 Average 2022 2023 200 210 220 230 240 250 260 270 280 Jan Feb Mar Apr May Jun Jul Aug Sep Oct Nov Dec '17-'22 '17-'22 Average 2022 2023

DOMESTIC FUELS PRODUCTION LEVELS Production Levels In - Line With Historical Averages US Conventional Gasoline Production 10 ( MMbpd ) US Distillate Production ( MMbpd ) Source: Bloomberg; 2 - 1 - 1 assumes WTI Crude, Gulf coast gasoline and Gulf Coast ULSD, data as of 7/31/2023 2.5 3.0 3.5 4.0 4.5 5.0 5.5 6.0 6.5 Jan Feb Mar Apr May Jun Jul Aug Sep Oct Nov Dec '17-'22 '17-'22 Average 2022 2023 5.0 6.0 7.0 8.0 9.0 10.0 11.0 12.0 Jan Feb Mar Apr May Jun Jul Aug Sep Oct Nov Dec '17-'22 '17-'22 Average 2022 2023

REFINED PRODUCT MARGINS RETREATING FROM RECENT HIGHS Tight Inventories, Robust Demand Remain Supportive 11 Gulf Coast 2 - 1 - 1 Crack Spread 2023 - to - Date Source: Bloomberg; 2 - 1 - 1 assumes WTI Crude, Gulf coast gasoline and Gulf Coast ULSD, data as of 7/31/2023 Gulf Coast 2 - 1 - 1 Crack Spread Long - Term Performance $0 $10 $20 $30 $40 $50 $60 $15 $20 $25 $30 $35 $40 $45
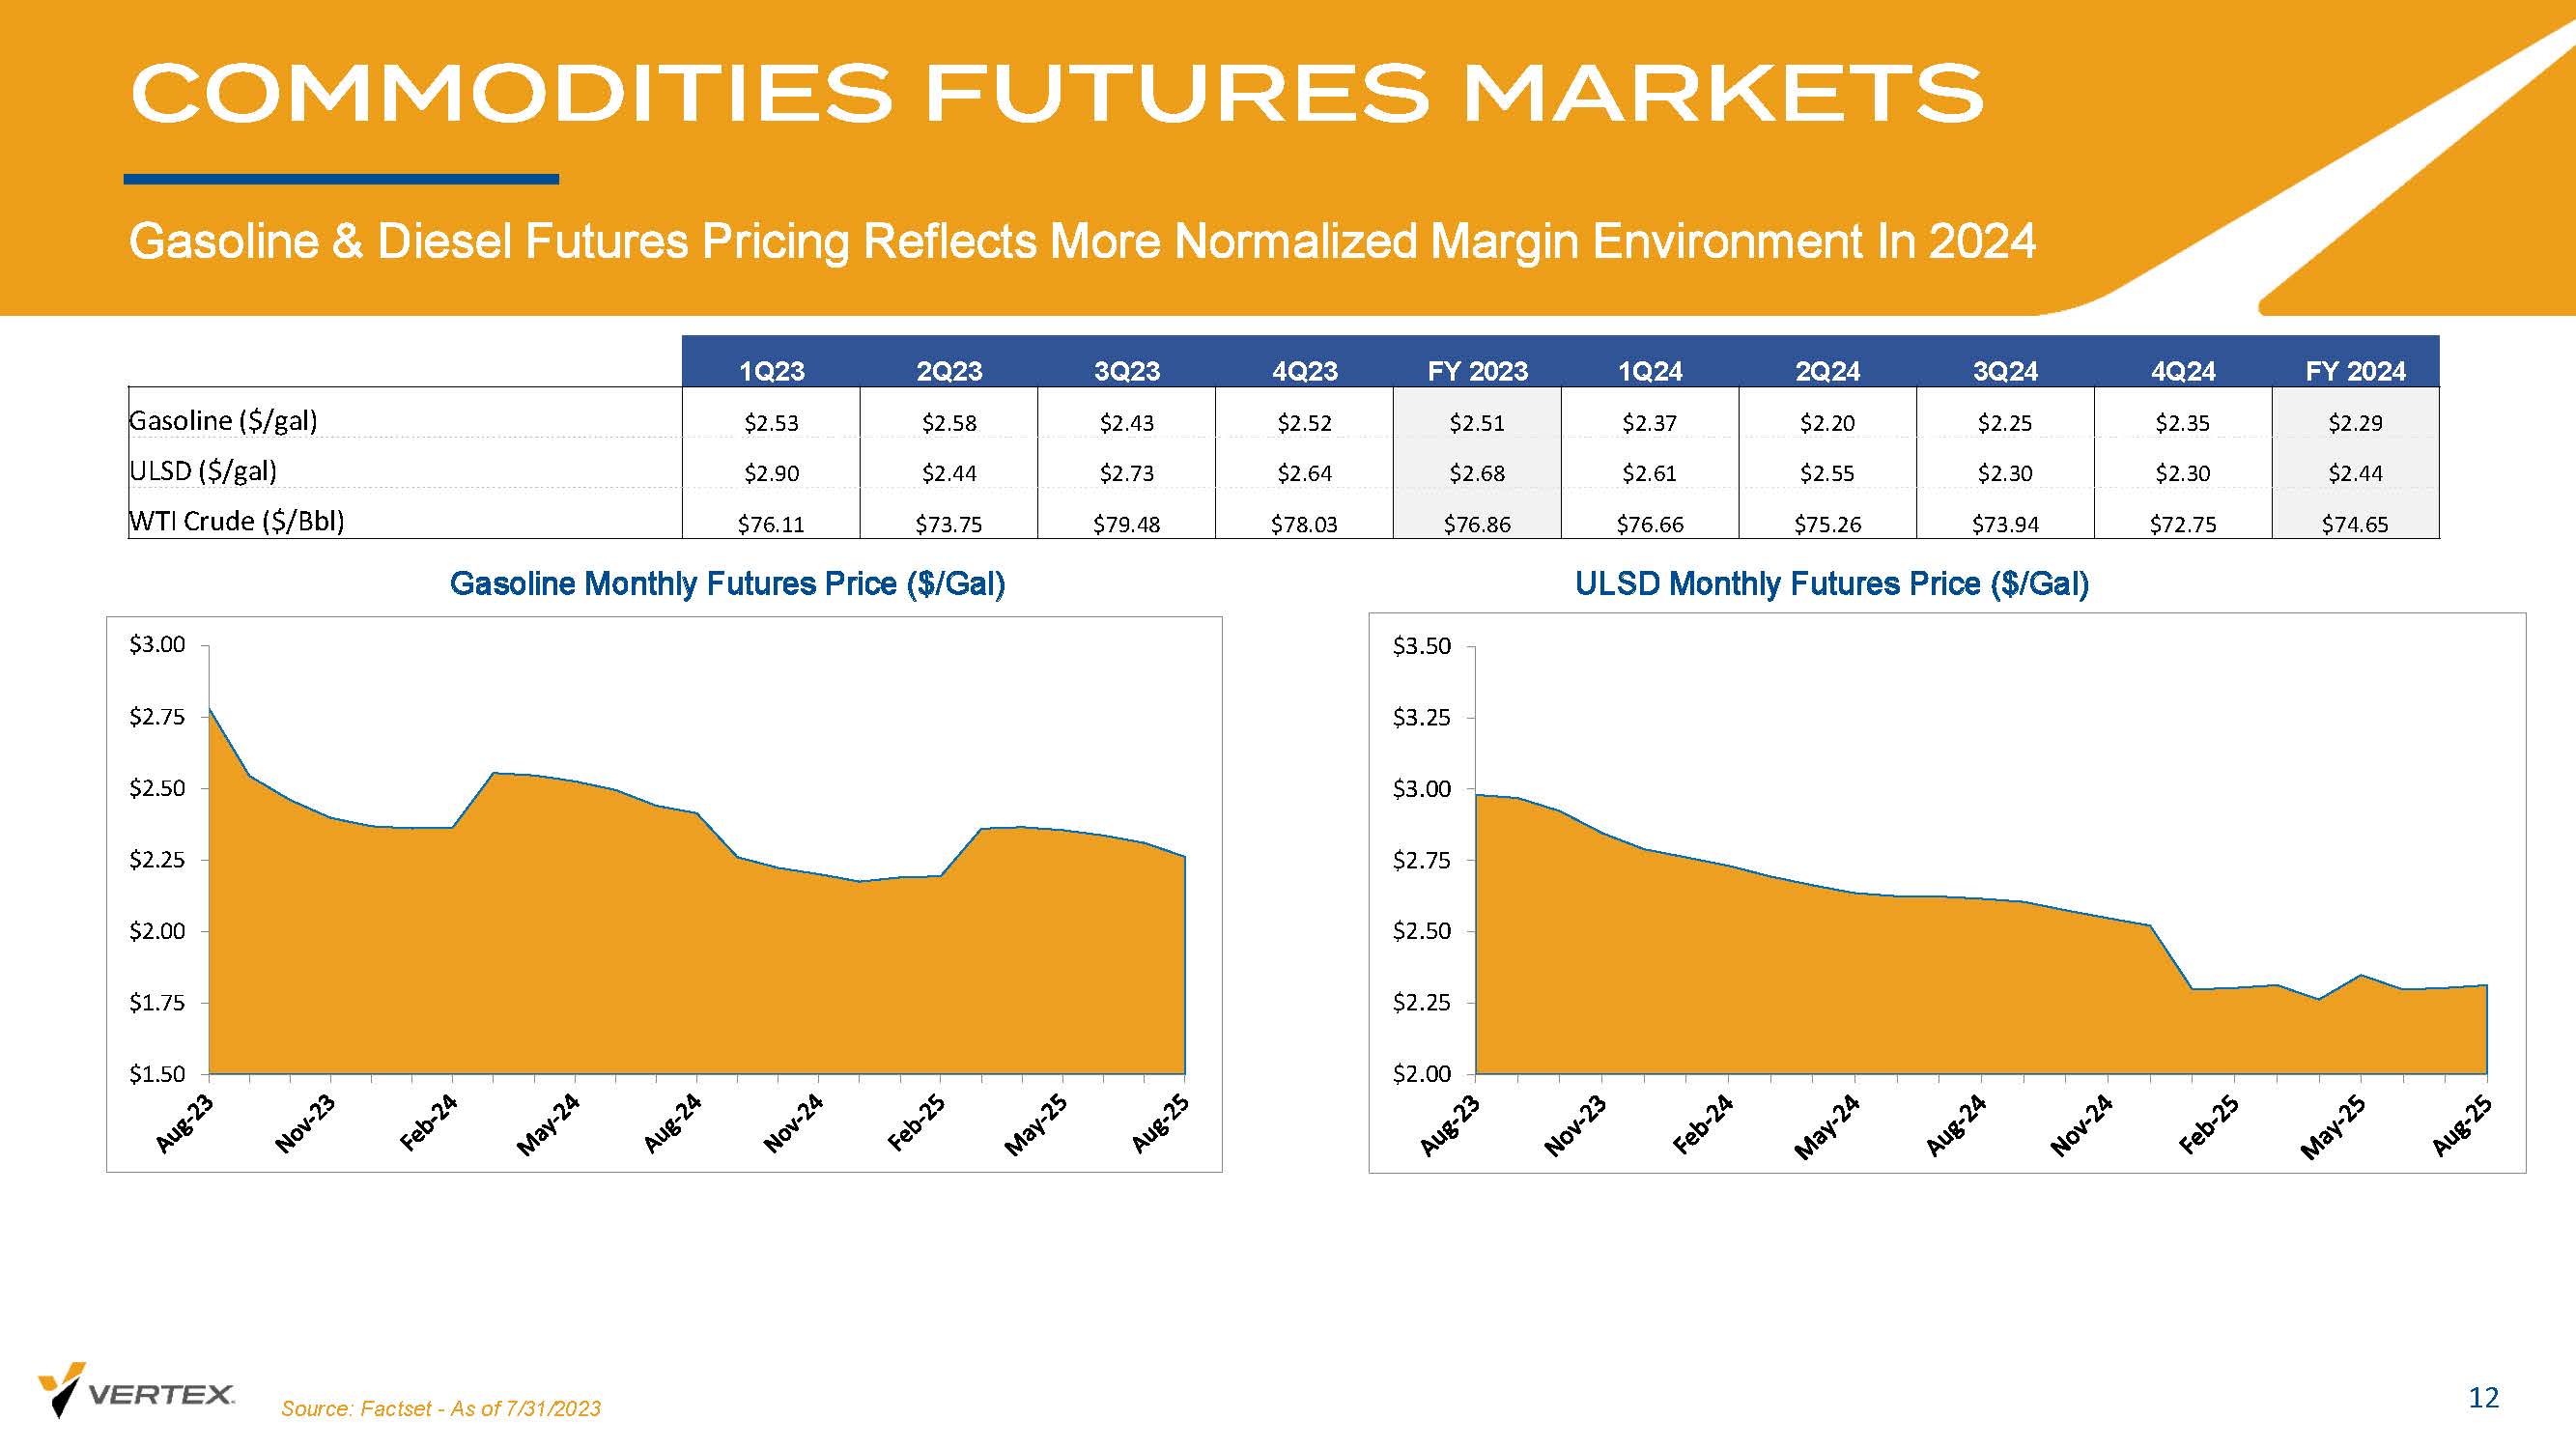
COMMODITIES FUTURES MARKETS Gasoline & Diesel Futures Pricing Reflects More Normalized Margin Environment In 2024 12 Gasoline Monthly Futures Price ($/Gal) ULSD Monthly Futures Price ($/Gal) Source: Factset - As of 7/31/2023 $1.50 $1.75 $2.00 $2.25 $2.50 $2.75 $3.00 $2.00 $2.25 $2.50 $2.75 $3.00 $3.25 $3.50 1Q23 2Q23 3Q23 4Q23 FY 2023 1Q24 2Q24 3Q24 4Q24 FY 2024 Gasoline ($/gal) $2.53 $2.58 $2.43 $2.52 $2.51 $2.37 $2.20 $2.25 $2.35 $2.29 ULSD ($/gal) $2.90 $2.44 $2.73 $2.64 $2.68 $2.61 $2.55 $2.30 $2.30 $2.44 WTI Crude ($/Bbl) $76.11 $73.75 $79.48 $78.03 $76.86 $76.66 $75.26 $73.94 $72.75 $74.65
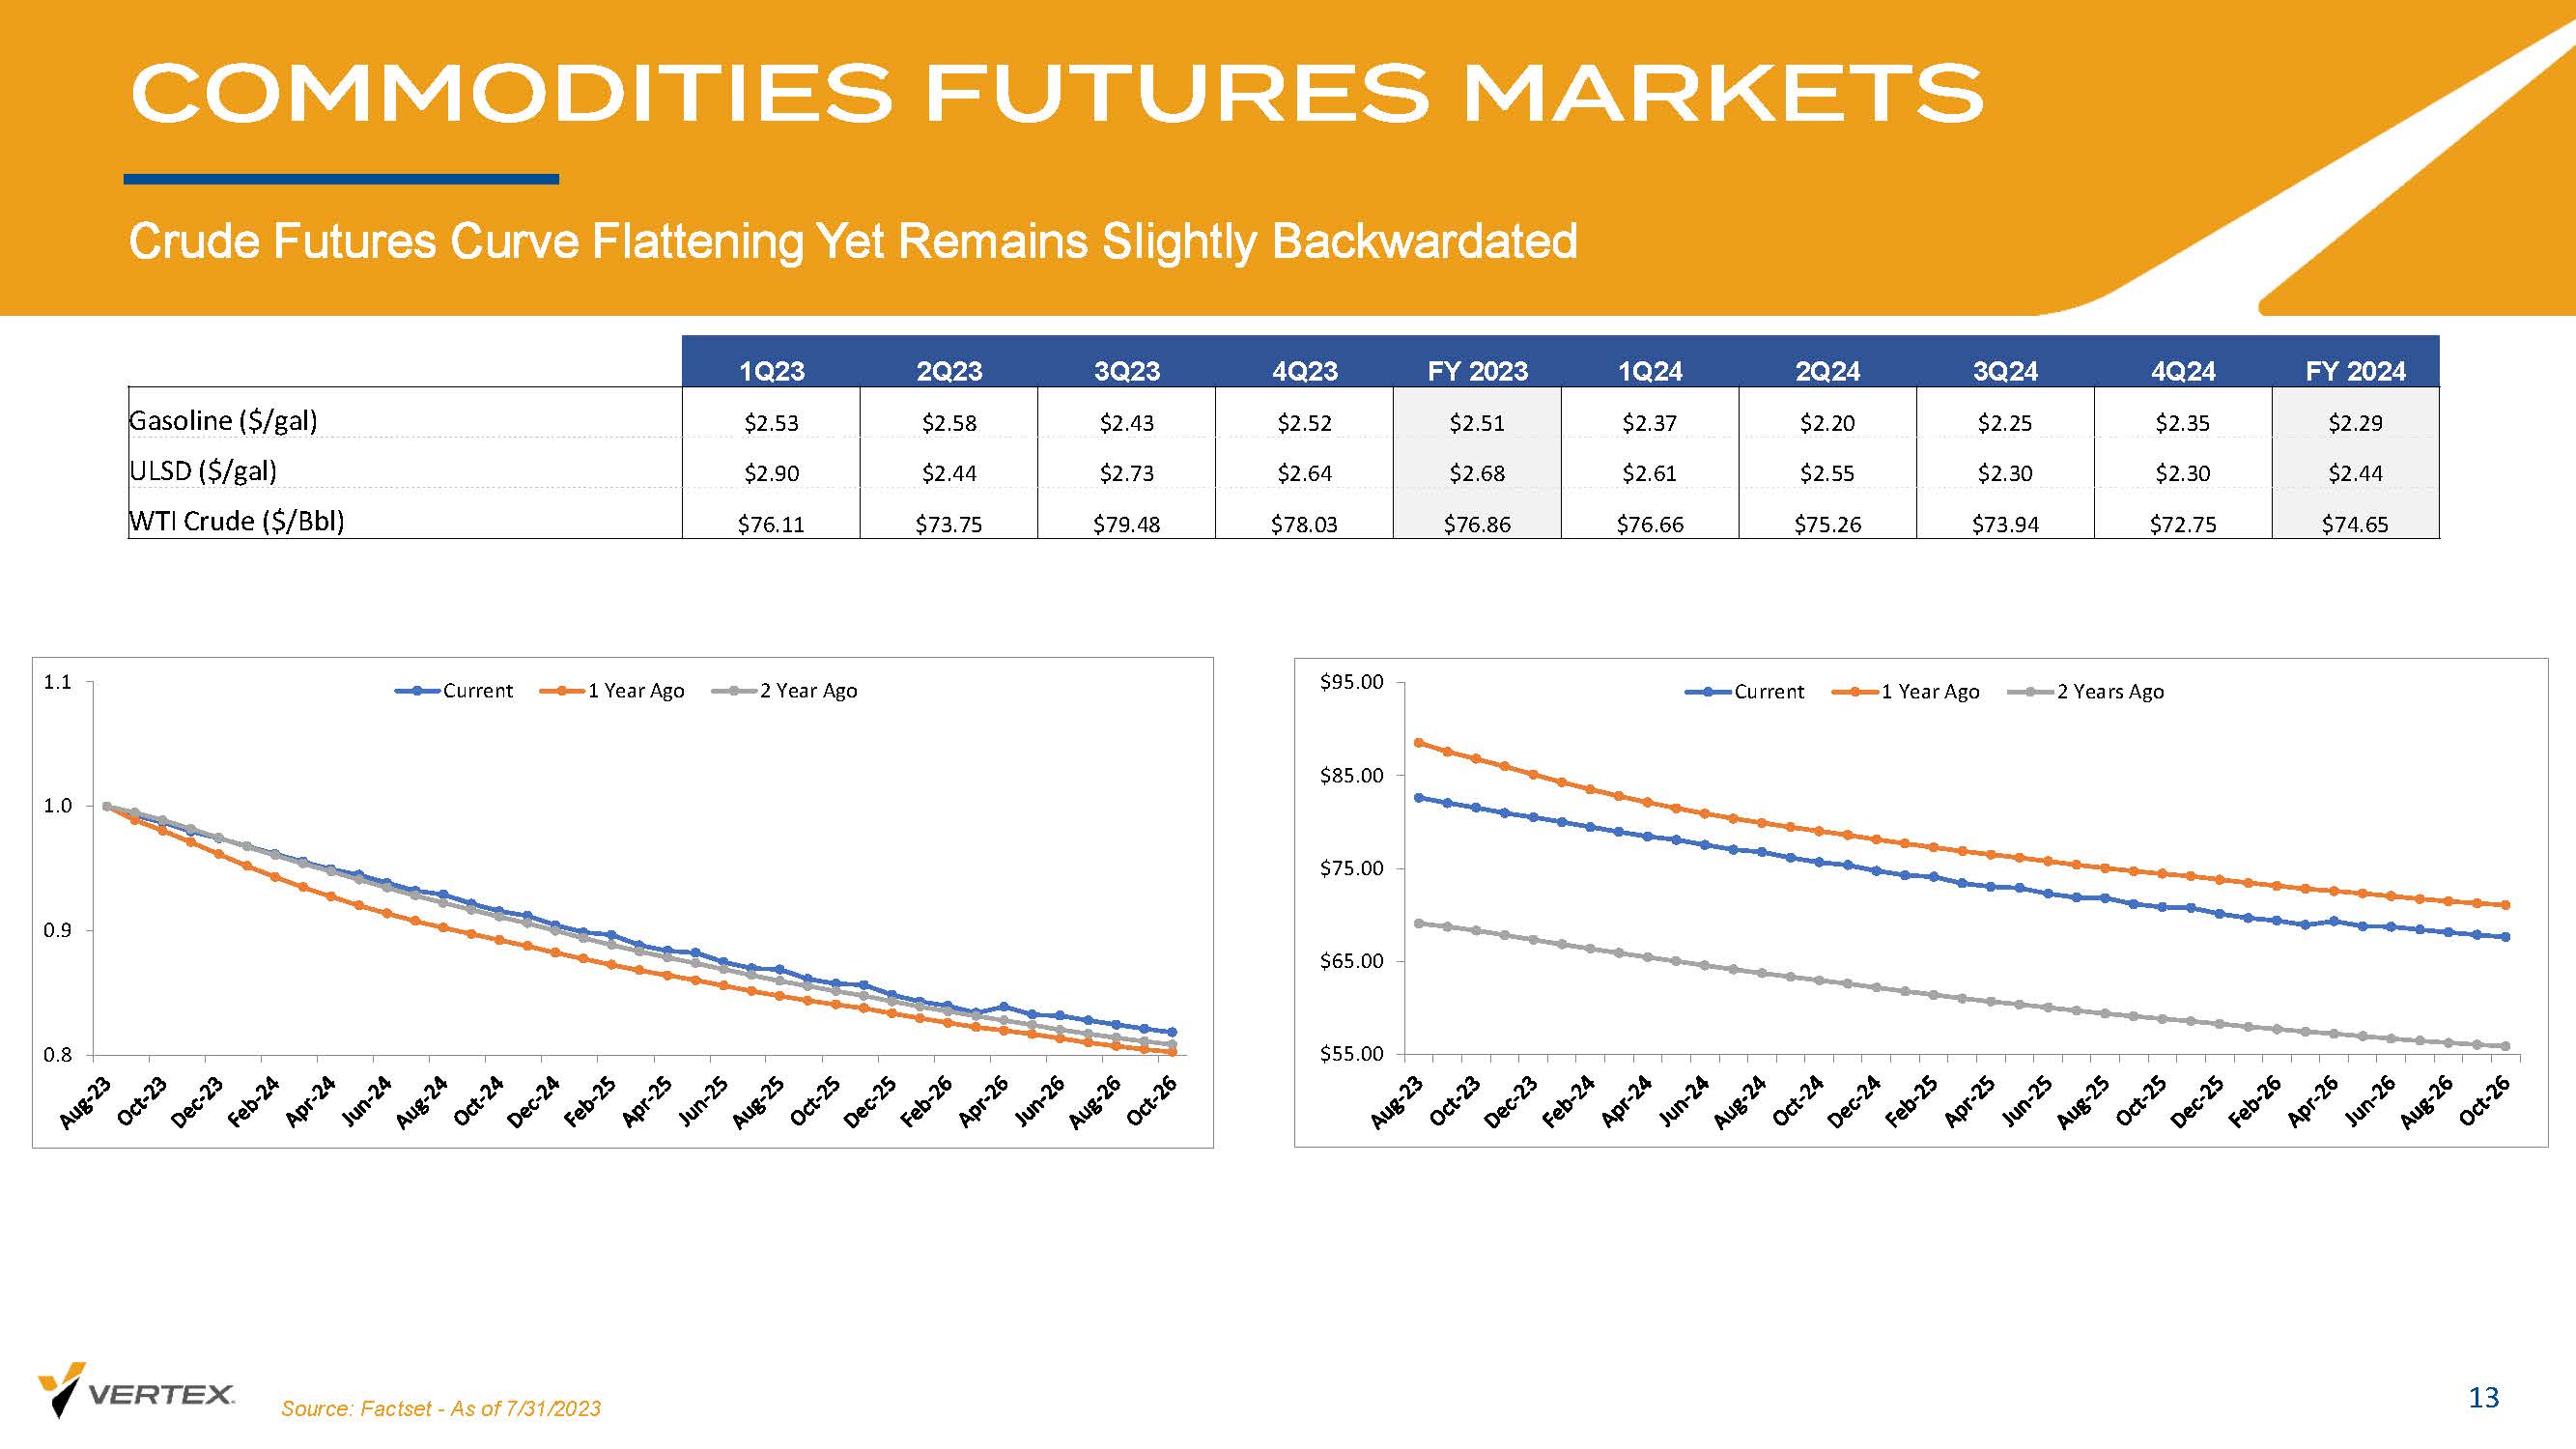
Crude Futures Curve Flattening Yet Remains Slightly Backwardated 13 COMMODITIES FUTURES MARKETS Source: Factset - As of 7/31/2023 0.8 0.9 1.0 1.1 Current 1 Year Ago 2 Year Ago $55.00 $65.00 $75.00 $85.00 $95.00 Current 1 Year Ago 2 Years Ago 1Q23 2Q23 3Q23 4Q23 FY 2023 1Q24 2Q24 3Q24 4Q24 FY 2024 Gasoline ($/gal) $2.53 $2.58 $2.43 $2.52 $2.51 $2.37 $2.20 $2.25 $2.35 $2.29 ULSD ($/gal) $2.90 $2.44 $2.73 $2.64 $2.68 $2.61 $2.55 $2.30 $2.30 $2.44 WTI Crude ($/Bbl) $76.11 $73.75 $79.48 $78.03 $76.86 $76.66 $75.26 $73.94 $72.75 $74.65
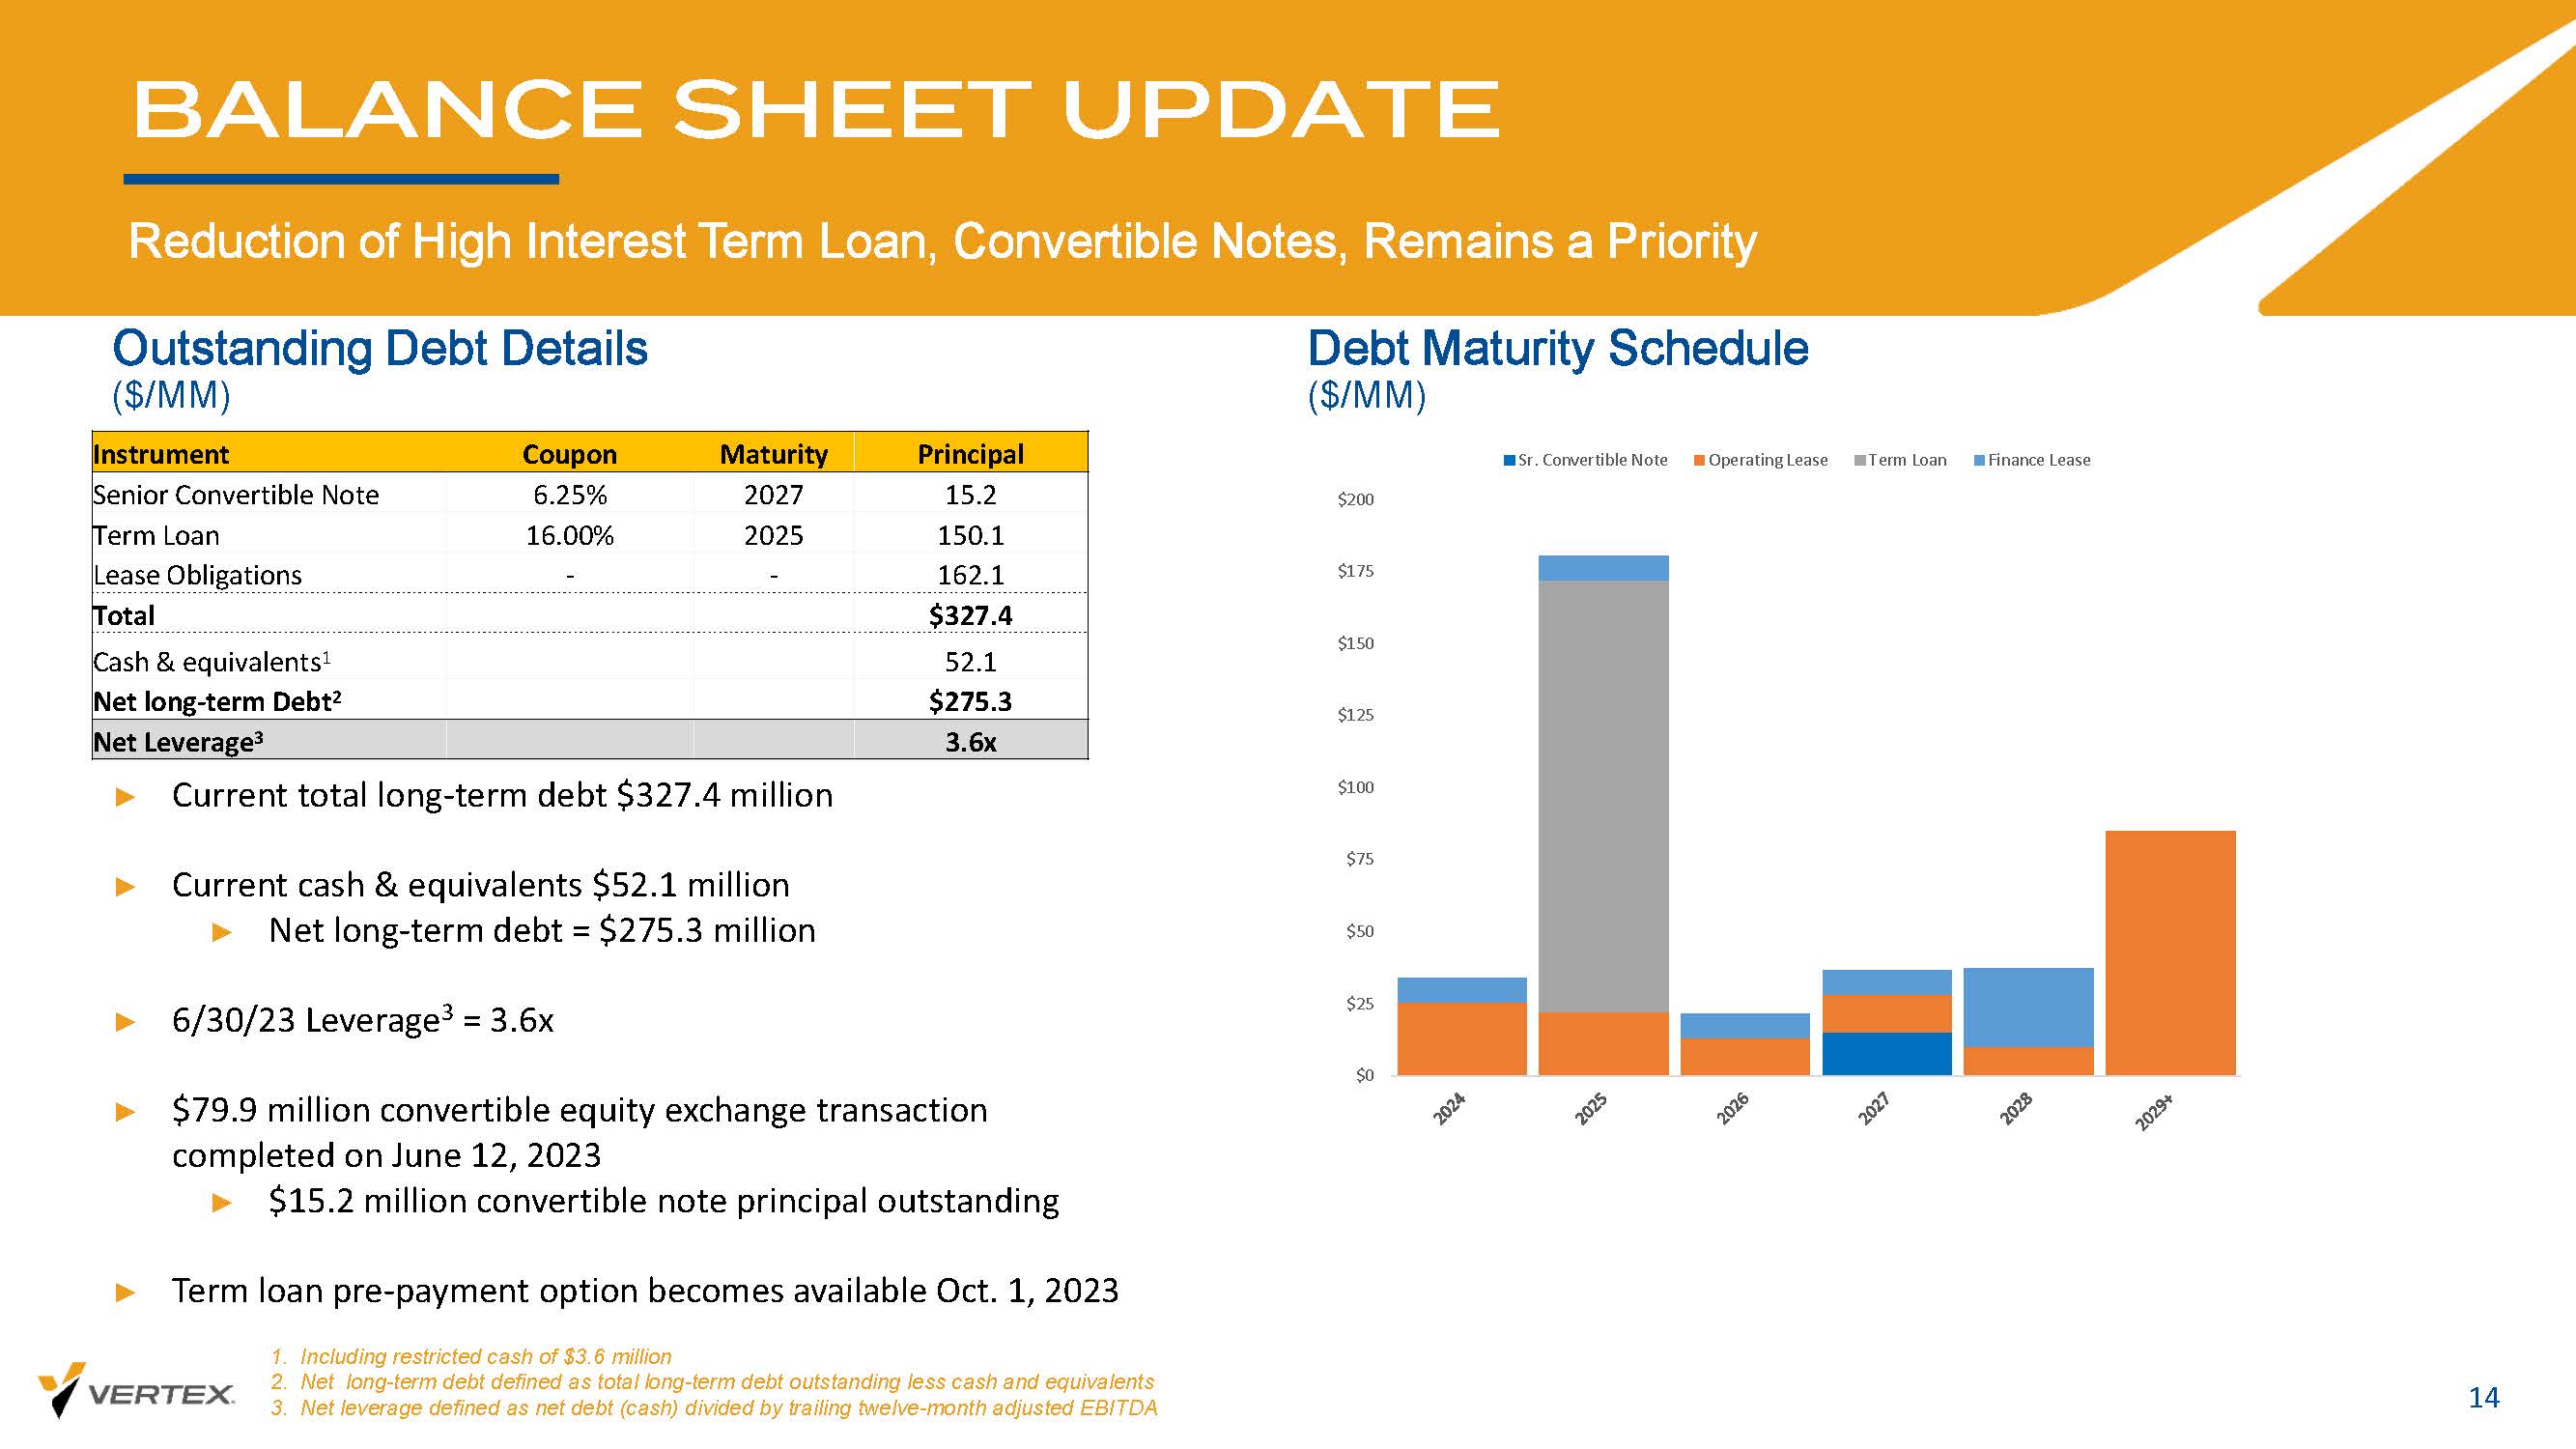
BALANCE SHEET UPDATE Reduction of High Interest Term Loan, Convertible Notes, Remains a Priority 14 Outstanding Debt Details ($/MM) Debt Maturity Schedule ($/MM) ► Current total long - term debt $327.4 million ► Current cash & equivalents $52.1 million ► Net long - term debt = $275.3 million ► 6/30/23 Leverage 3 = 3.6x ► $79.9 million convertible equity exchange transaction completed on June 12, 2023 ► $15.2 million convertible note principal outstanding ► Term loan pre - payment option becomes available Oct. 1, 2023 1. Including restricted cash of $3.6 million 2. Net long - term debt defined as total long - term debt outstanding less cash and equivalents 3. Net leverage defined as net debt (cash) divided by trailing twelve - month adjusted EBITDA Principal Maturity Coupon Instrument 15.2 2027 6.25% Senior Convertible Note 150.1 2025 16.00% Term Loan 162.1 - - Lease Obligations $327.4 Total 52.1 Cash & equivalents 1 $275.3 Net long - term Debt 2 3.6x Net Leverage 3
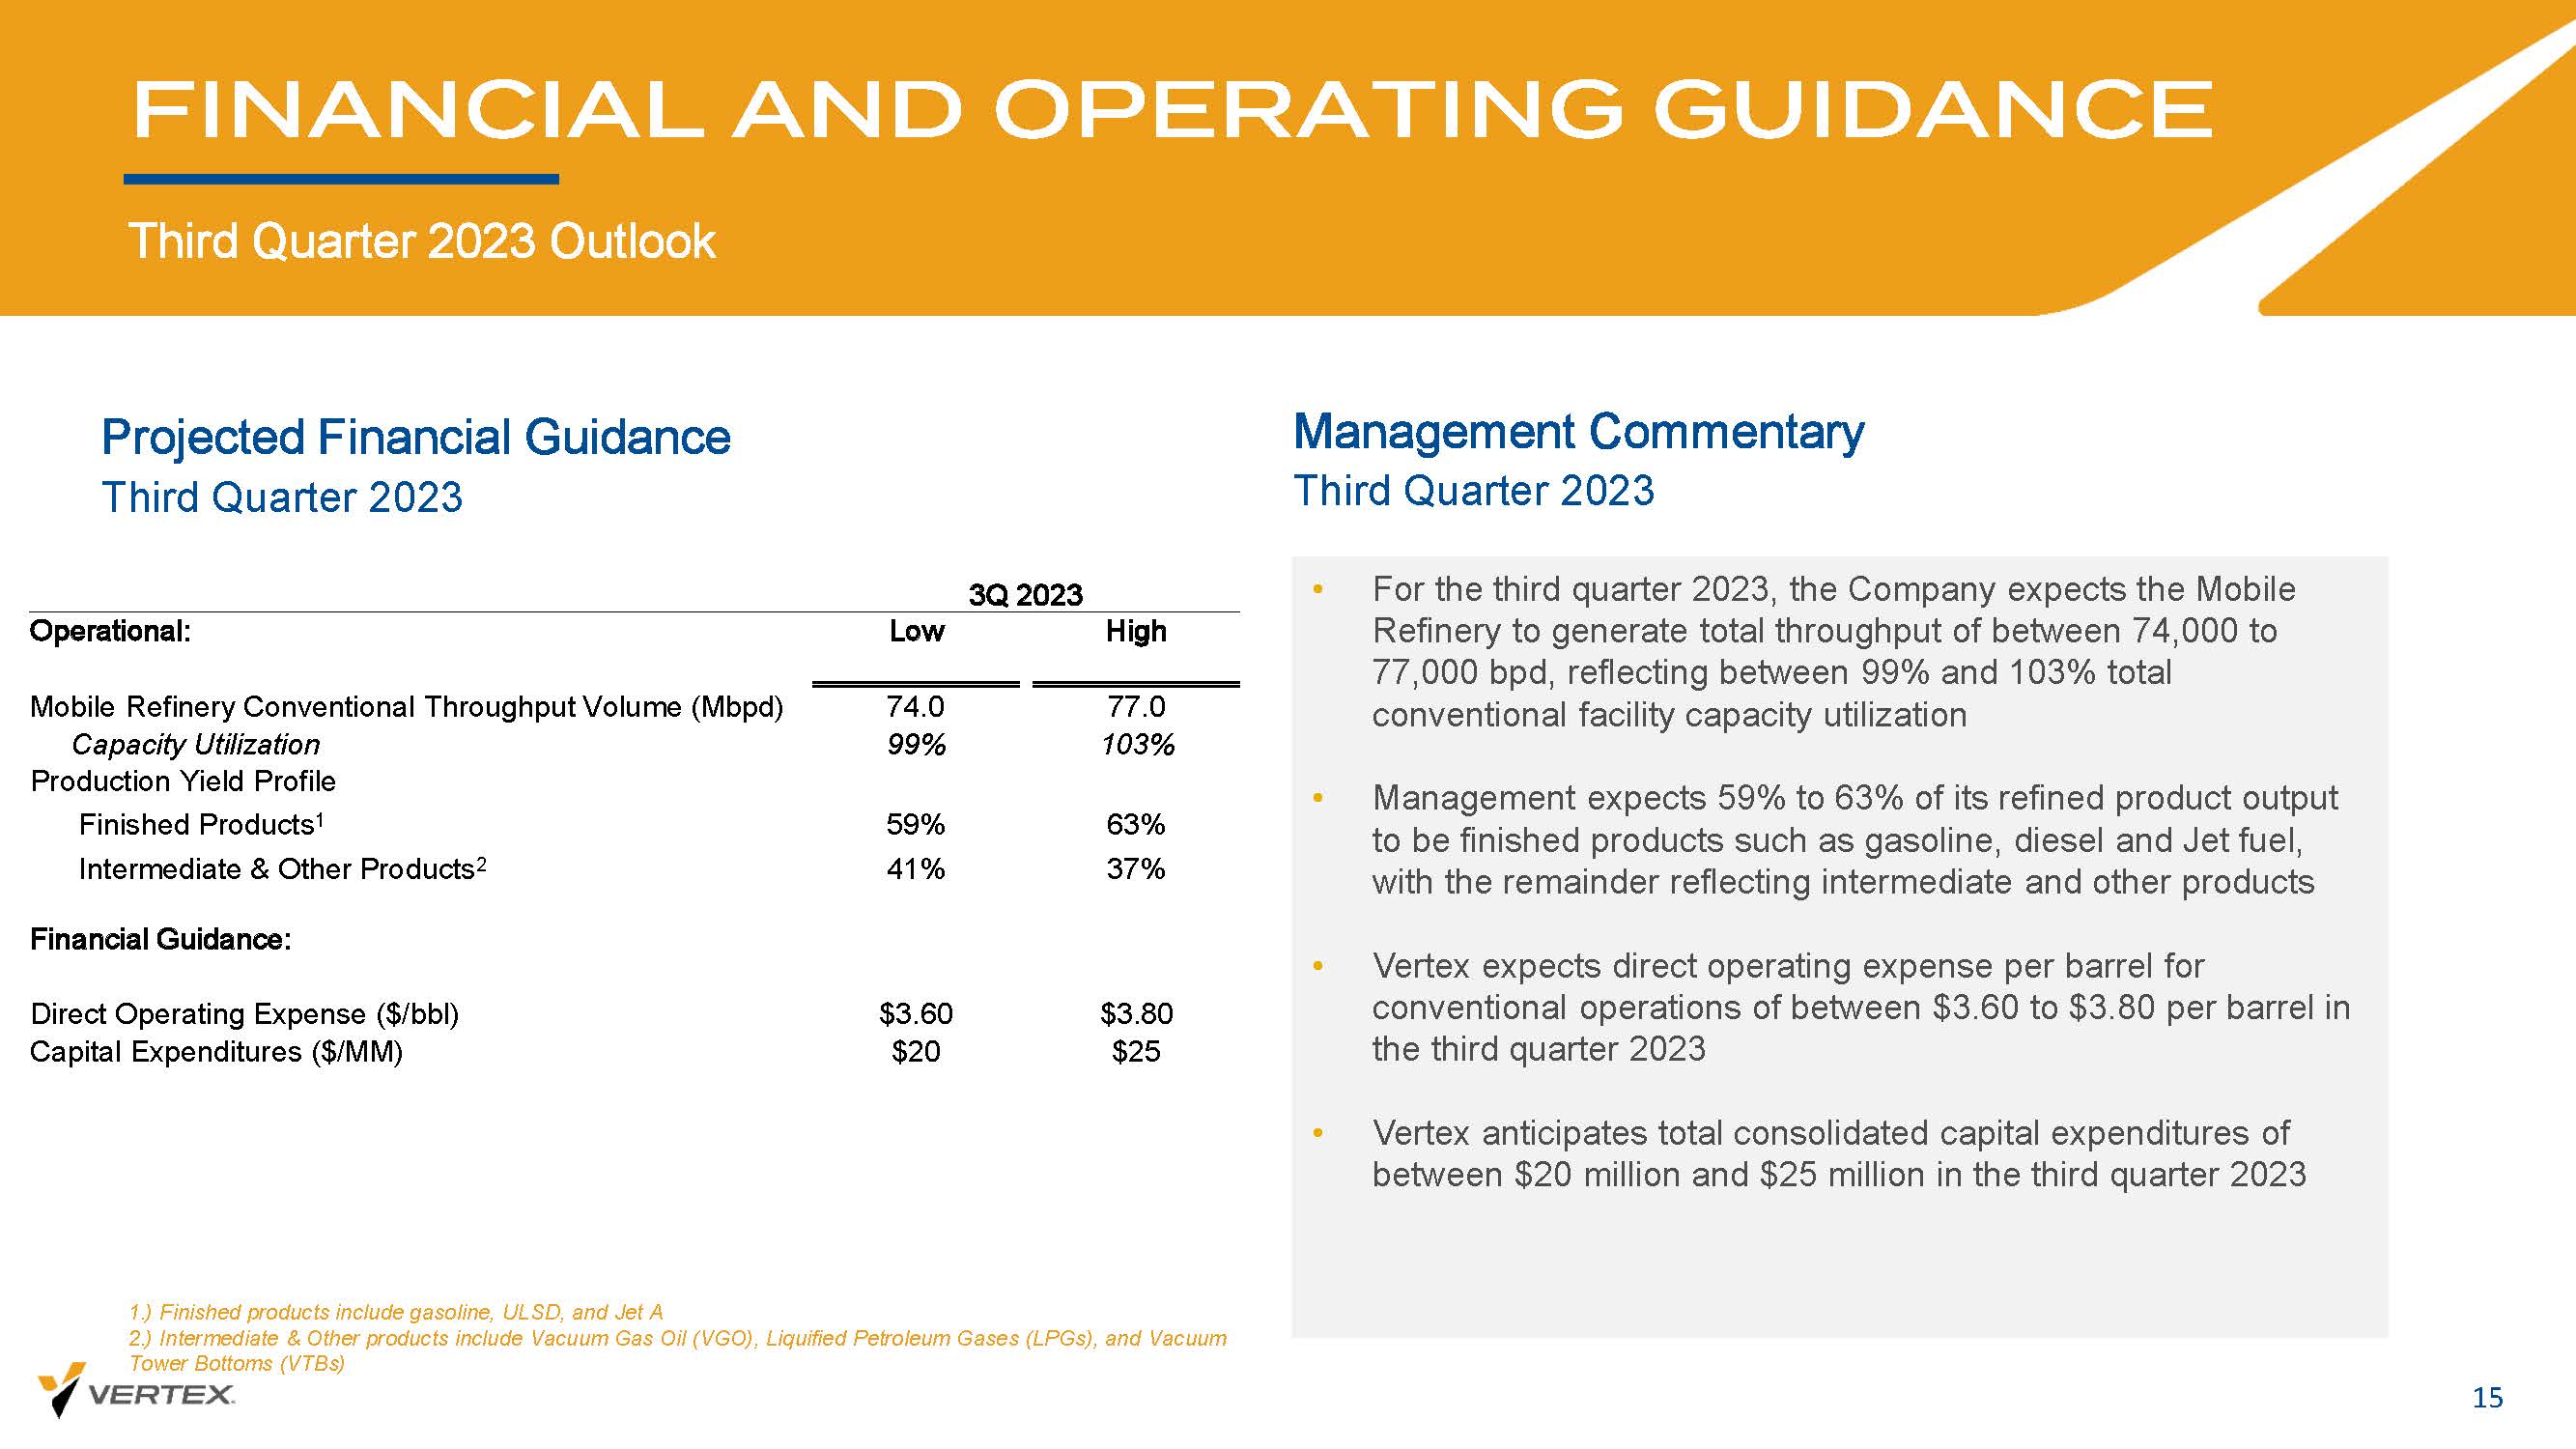
Projected Financial Guidance FINANCIAL AND OPERATING GUIDANCE Third Quarter 2023 Outlook 15 Management Commentary • For the third quarter 2023, the Company expects the Mobile Refinery to generate total throughput of between 74,000 to 77,000 bpd, reflecting between 99% and 103% total conventional facility capacity utilization • Management expects 59% to 63% of its refined product output to be finished products such as gasoline, diesel and Jet fuel, with the remainder reflecting intermediate and other products • Vertex expects direct operating expense per barrel for conventional operations of between $3.60 to $3.80 per barrel in the third quarter 2023 • Vertex anticipates total consolidated capital expenditures of between $20 million and $25 million in the third quarter 2023 Third Quarter 2023 Third Quarter 2023 3Q 2023 High Low Operational: 77.0 74.0 Mobile Refinery Conventional Throughput Volume (Mbpd) 103% 99% Capacity Utilization Production Yield Profile 63% 59% Finished Products 1 37% 41% Intermediate & Other Products 2 Financial Guidance: $3.80 $3.60 Direct Operating Expense ($/bbl) $25 $20 Capital Expenditures ($/MM) 1.) Finished products include gasoline, ULSD, and Jet A 2.) Intermediate & Other products include Vacuum Gas Oil (VGO), Liquified Petroleum Gases (LPGs), and Vacuum Tower Bottoms (VTBs)
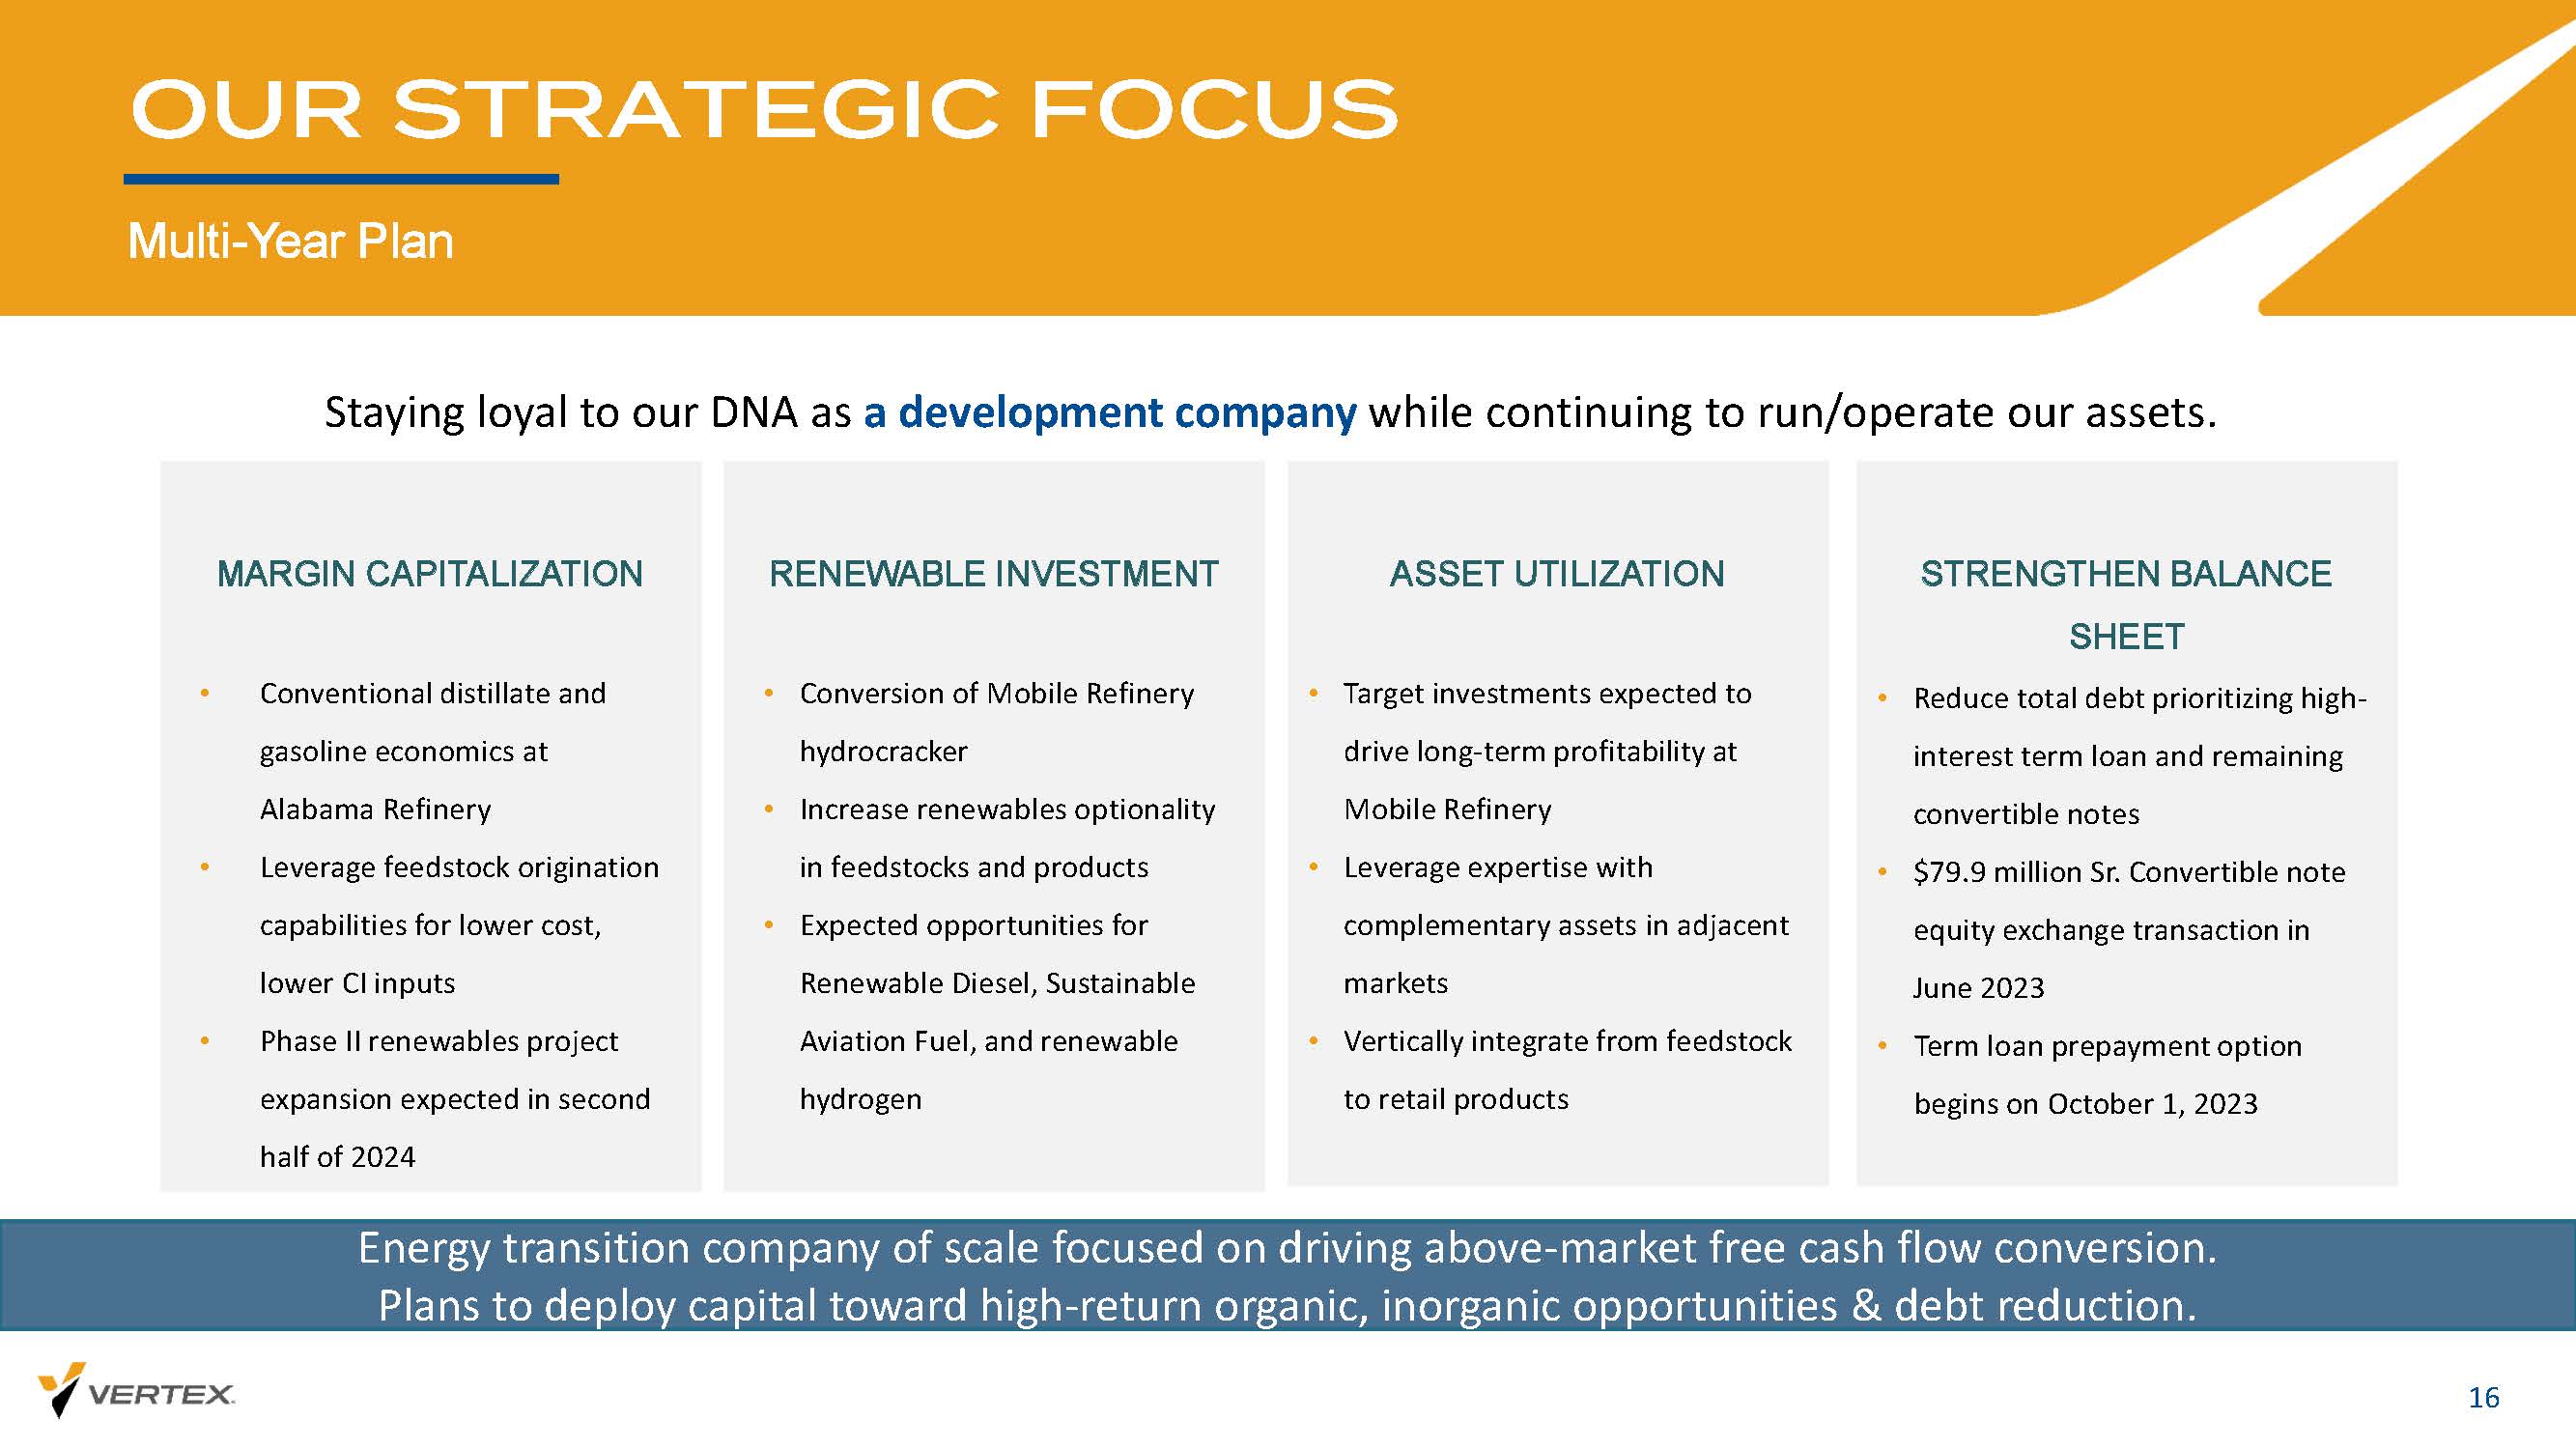
OUR STRATEGIC FOCUS Multi - Year Plan 16 ASSET UTILIZATION • Target investments expected to drive long - term profitability at Mobile Refinery • Leverage expertise with complementary assets in adjacent markets • Vertically integrate from feedstock to retail products MARGIN CAPITALIZATION • Conventional distillate and gasoline economics at Alabama Refinery • Leverage feedstock origination capabilities for lower cost, lower CI inputs • Phase II renewables project expansion expected in second half of 2024 RENEWABLE INVESTMENT • Conversion of Mobile Refinery hydrocracker • Increase renewables optionality in feedstocks and products • Expected opportunities for Renewable Diesel, Sustainable Aviation Fuel, and renewable hydrogen STRENGTHEN BALANCE SHEET • Reduce total debt prioritizing high - interest term loan and remaining convertible notes • $79.9 million Sr. Convertible note equity exchange transaction in June 2023 • Term loan prepayment option begins on October 1, 2023 Energy transition company of scale focused on driving above - market free cash flow conversion. Plans to deploy capital toward high - return organic, inorganic opportunities & debt reduction. Staying loyal to our DNA as a development company while continuing to run/operate our assets.

APPENDIX
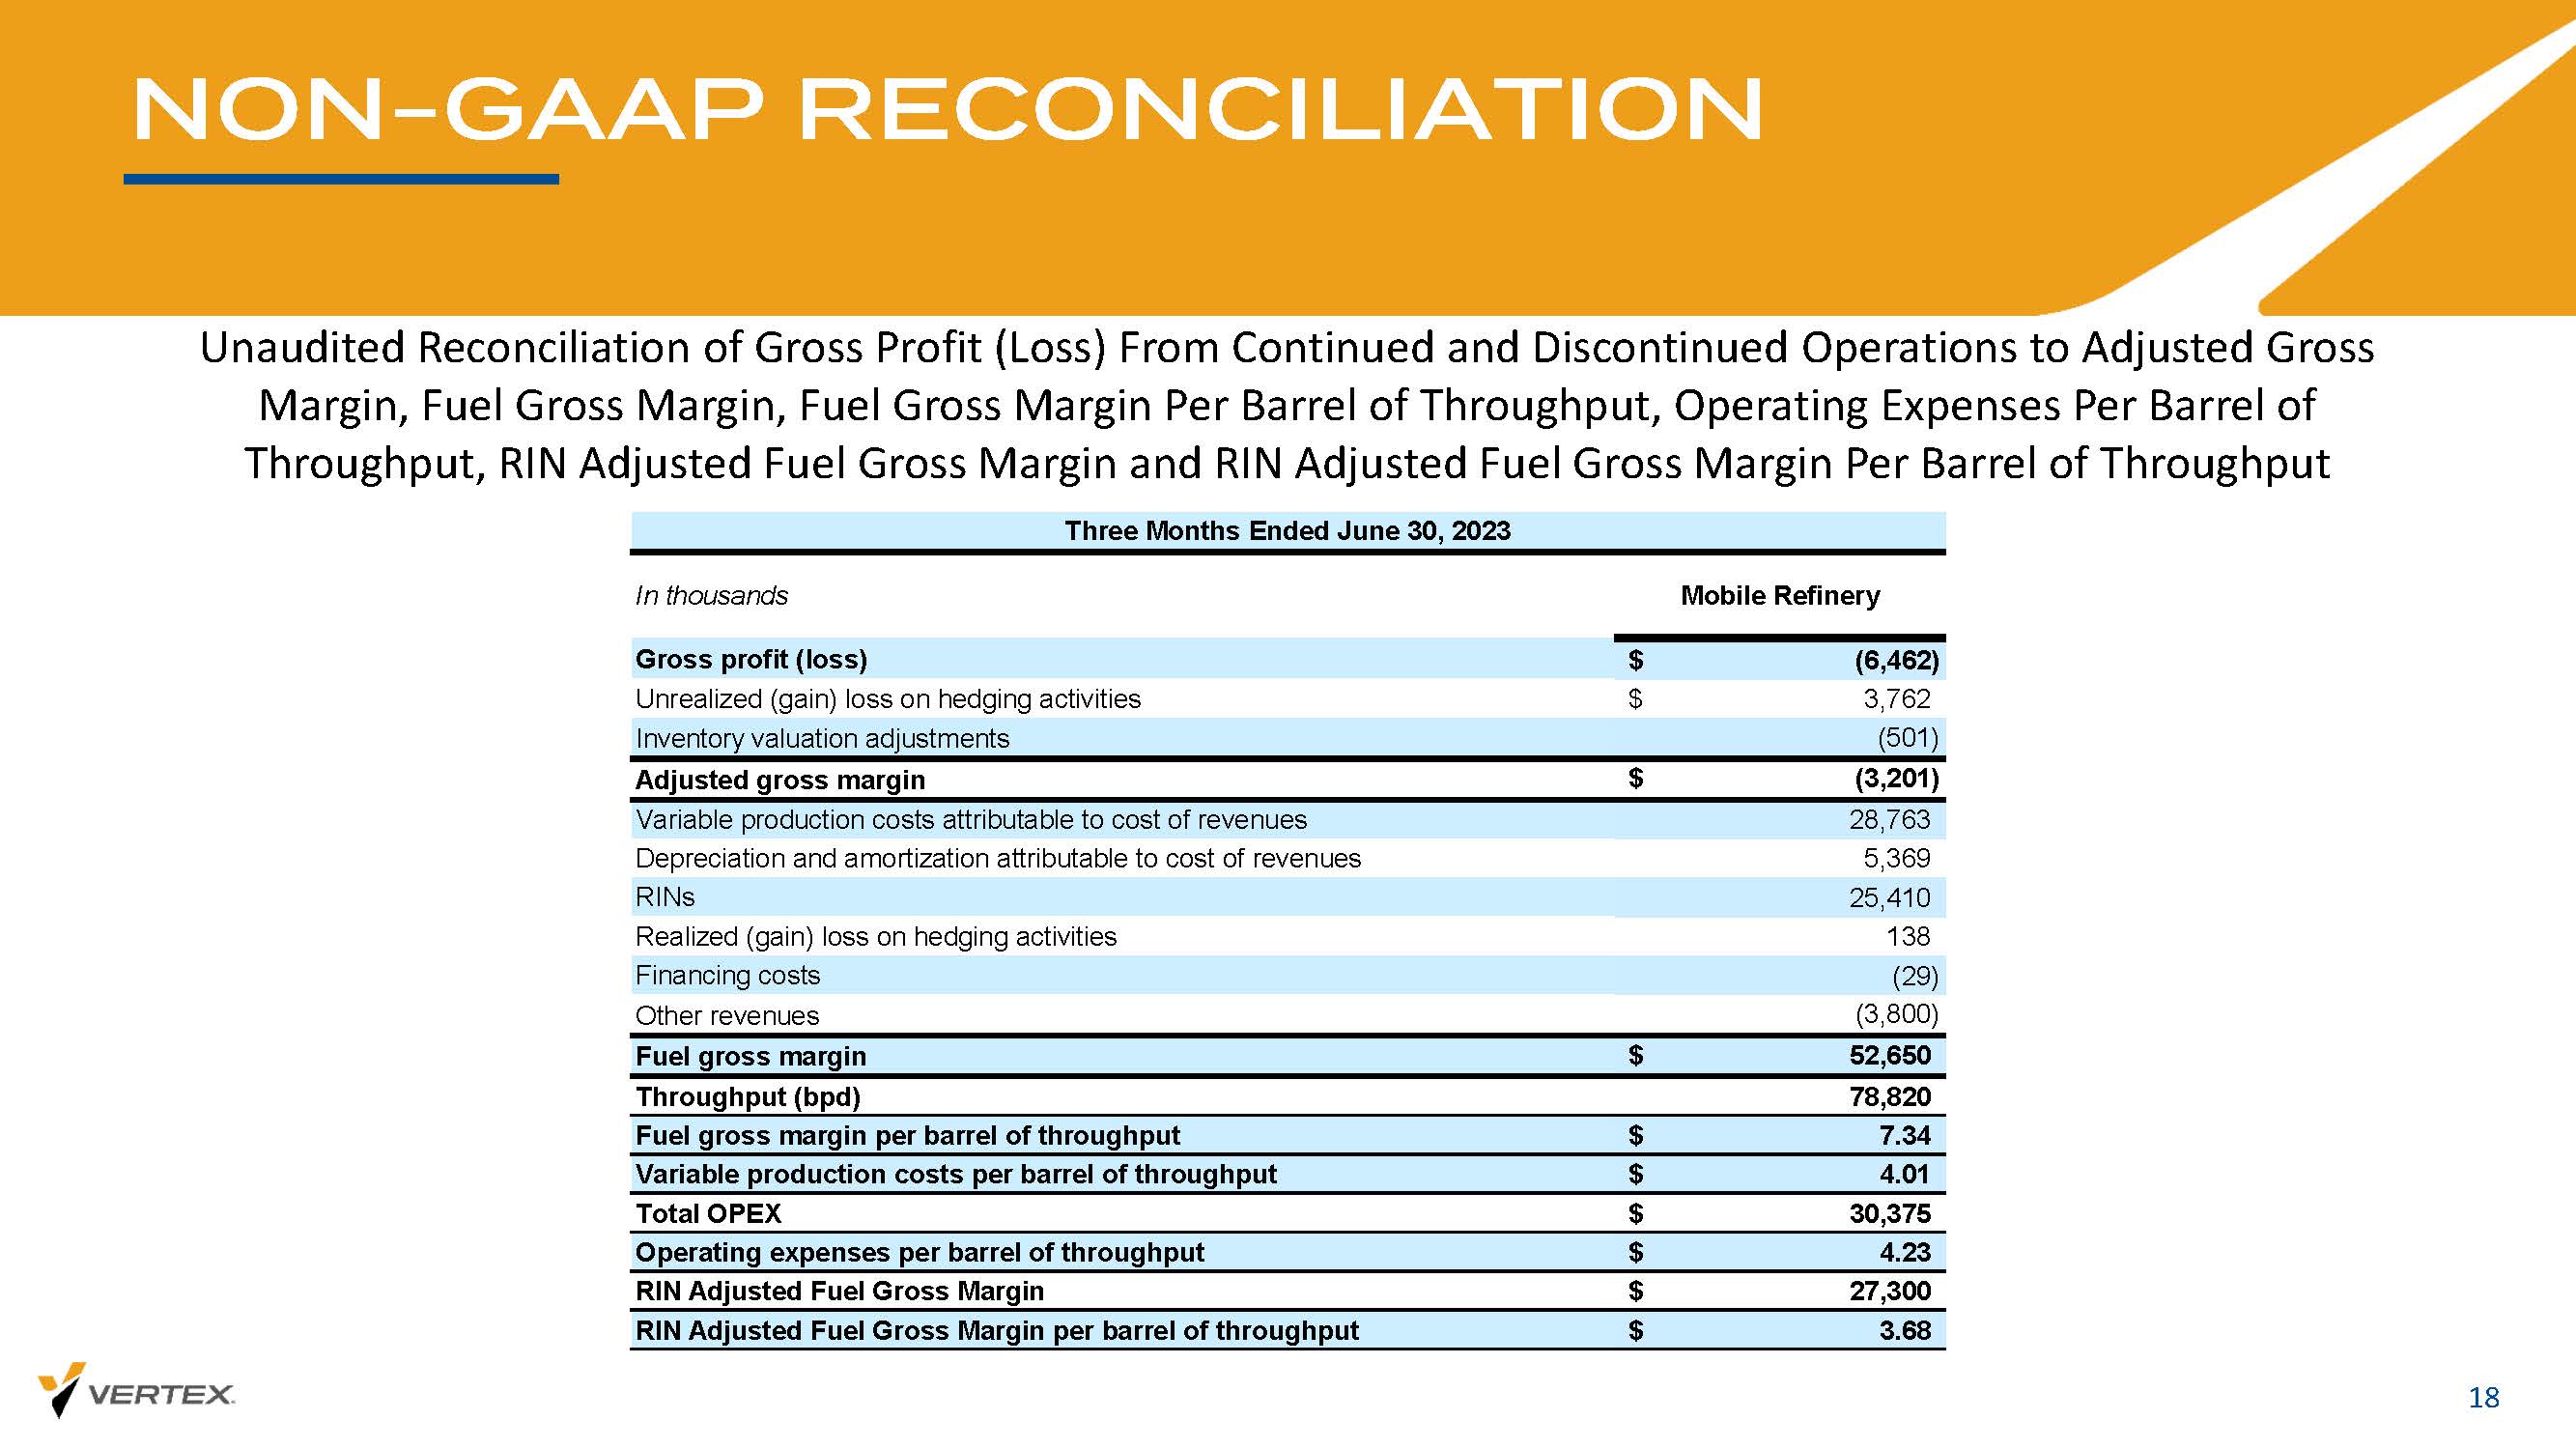
NON - GAAP RECONCILIATION 18 Unaudited Reconciliation of Gross Profit (Loss) From Continued and Discontinued Operations to Adjusted Gross Margin, Fuel Gross Margin, Fuel Gross Margin Per Barrel of Throughput, Operating Expenses Per Barrel of Throughput, RIN Adjusted Fuel Gross Margin and RIN Adjusted Fuel Gross Margin Per Barrel of Throughput
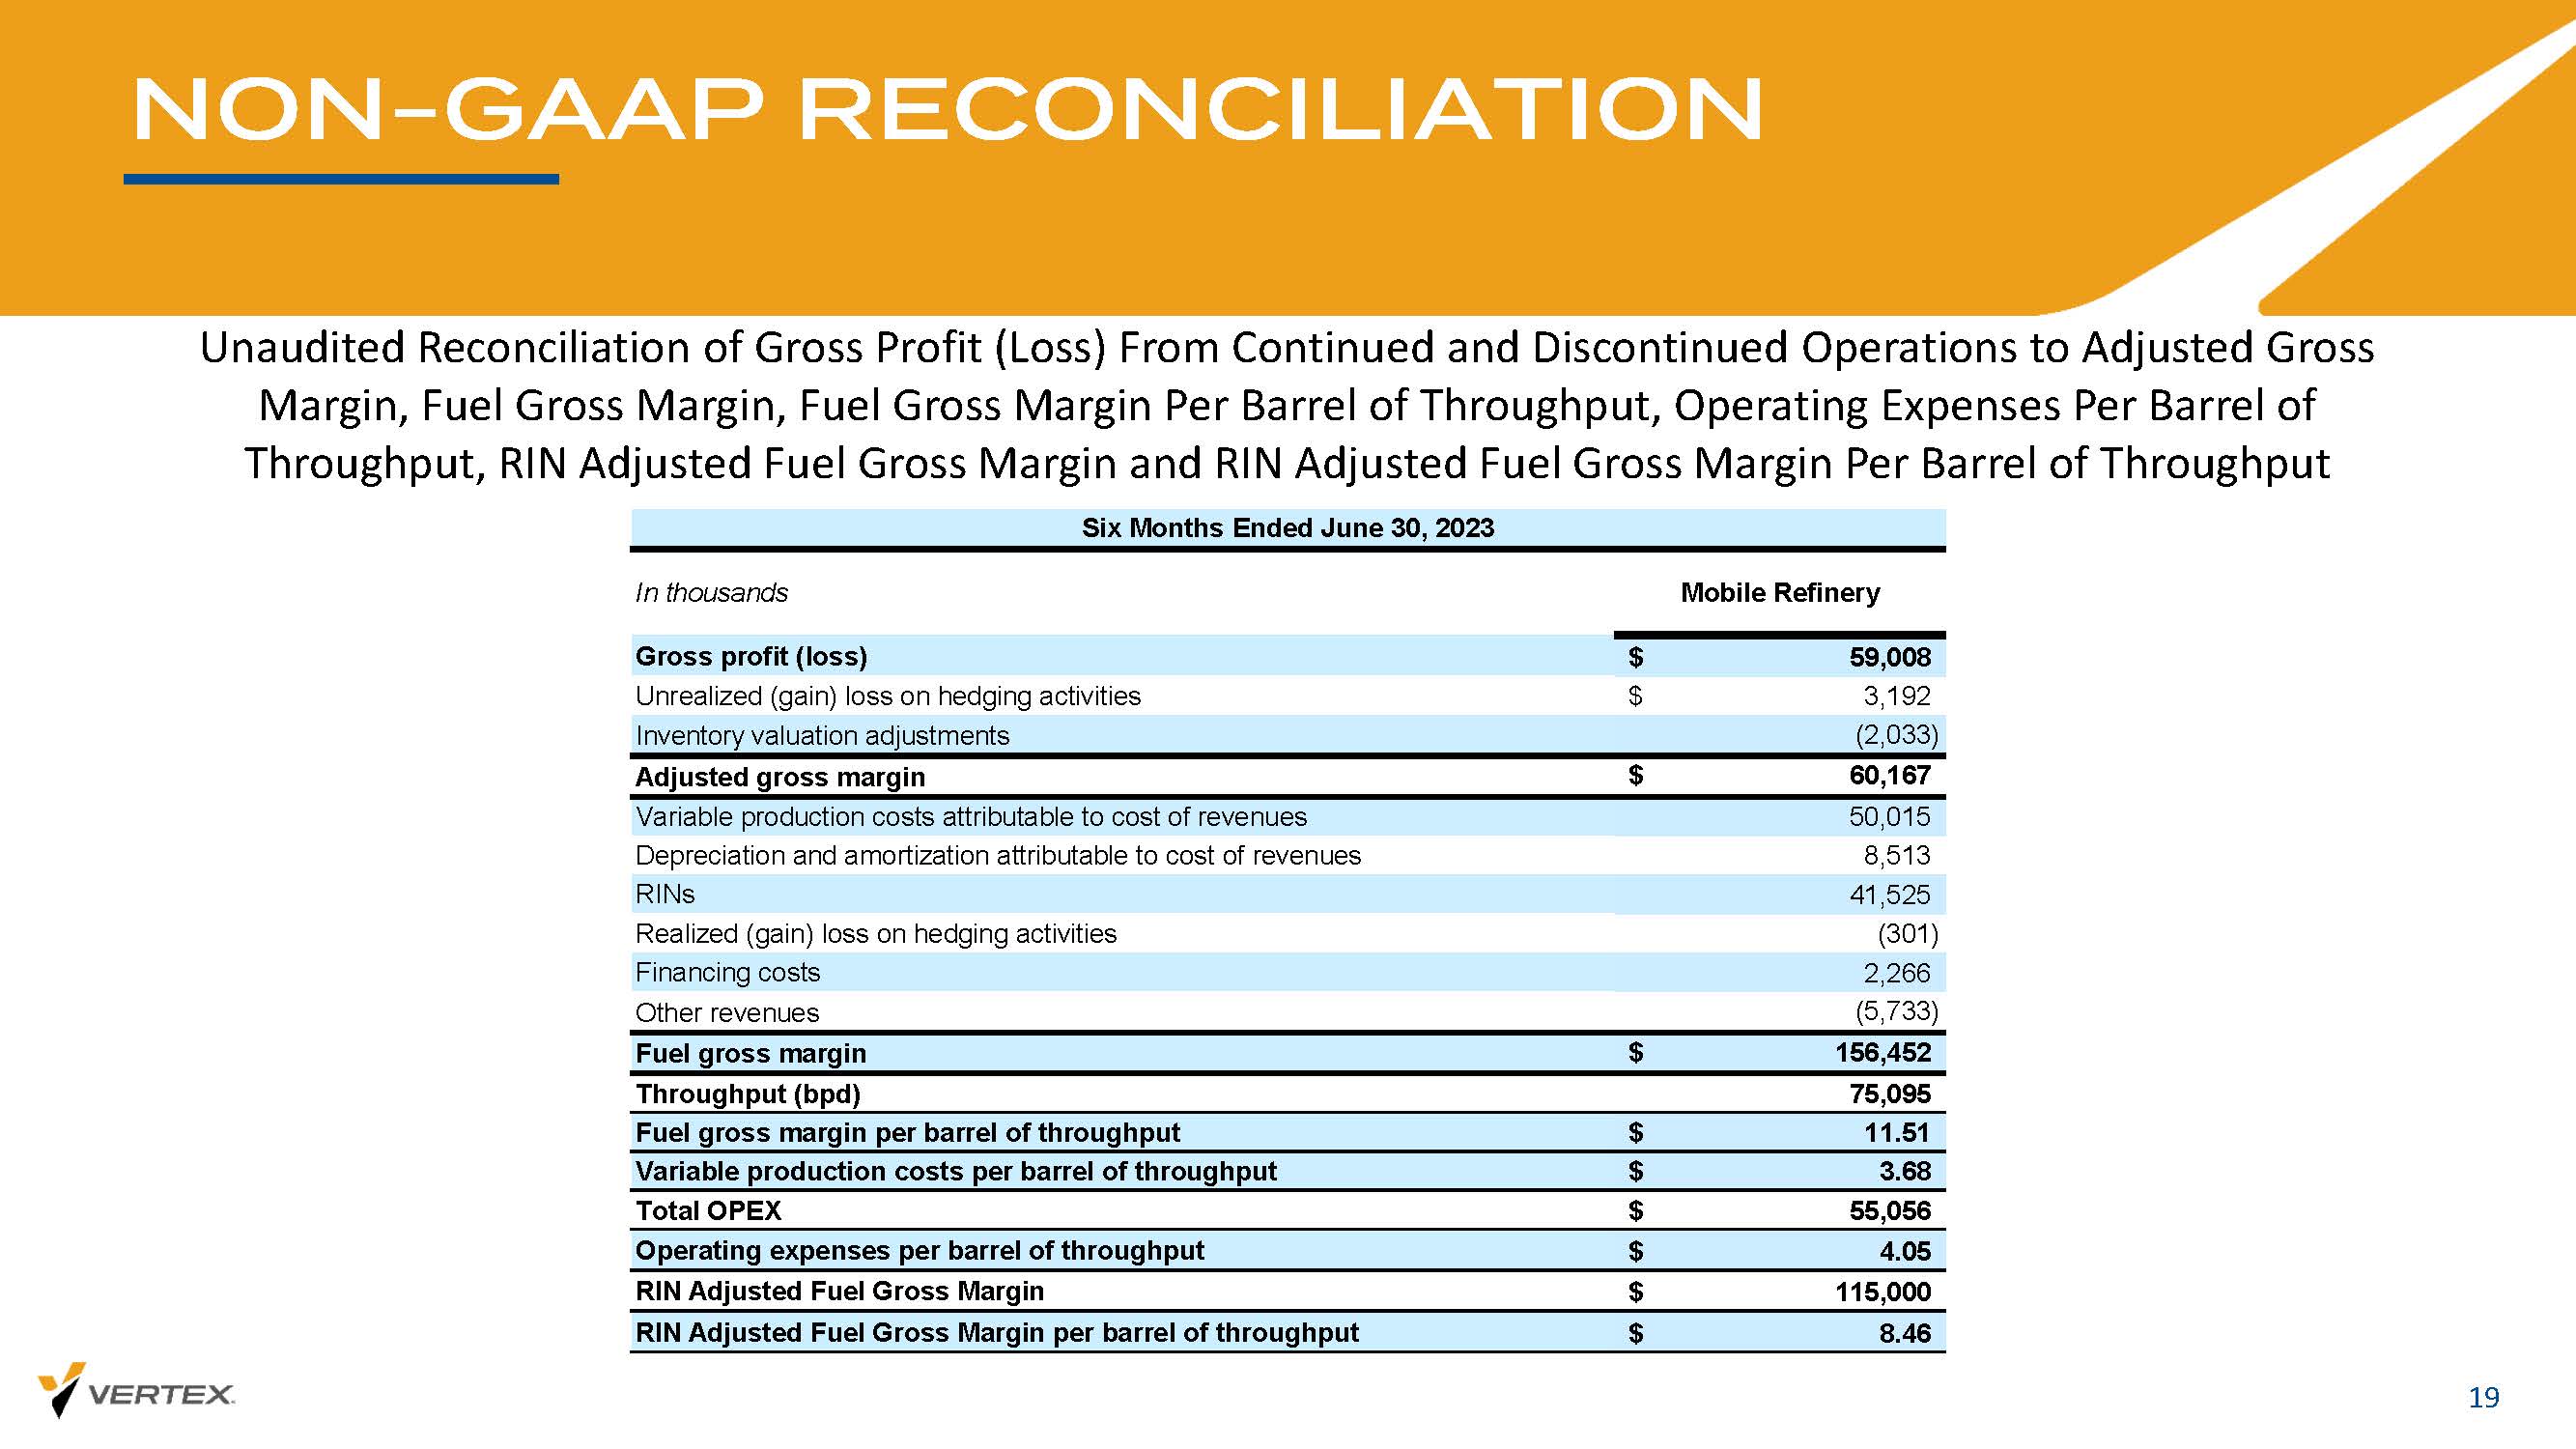
NON - GAAP RECONCILIATION 19 Unaudited Reconciliation of Gross Profit (Loss) From Continued and Discontinued Operations to Adjusted Gross Margin, Fuel Gross Margin, Fuel Gross Margin Per Barrel of Throughput, Operating Expenses Per Barrel of Throughput, RIN Adjusted Fuel Gross Margin and RIN Adjusted Fuel Gross Margin Per Barrel of Throughput
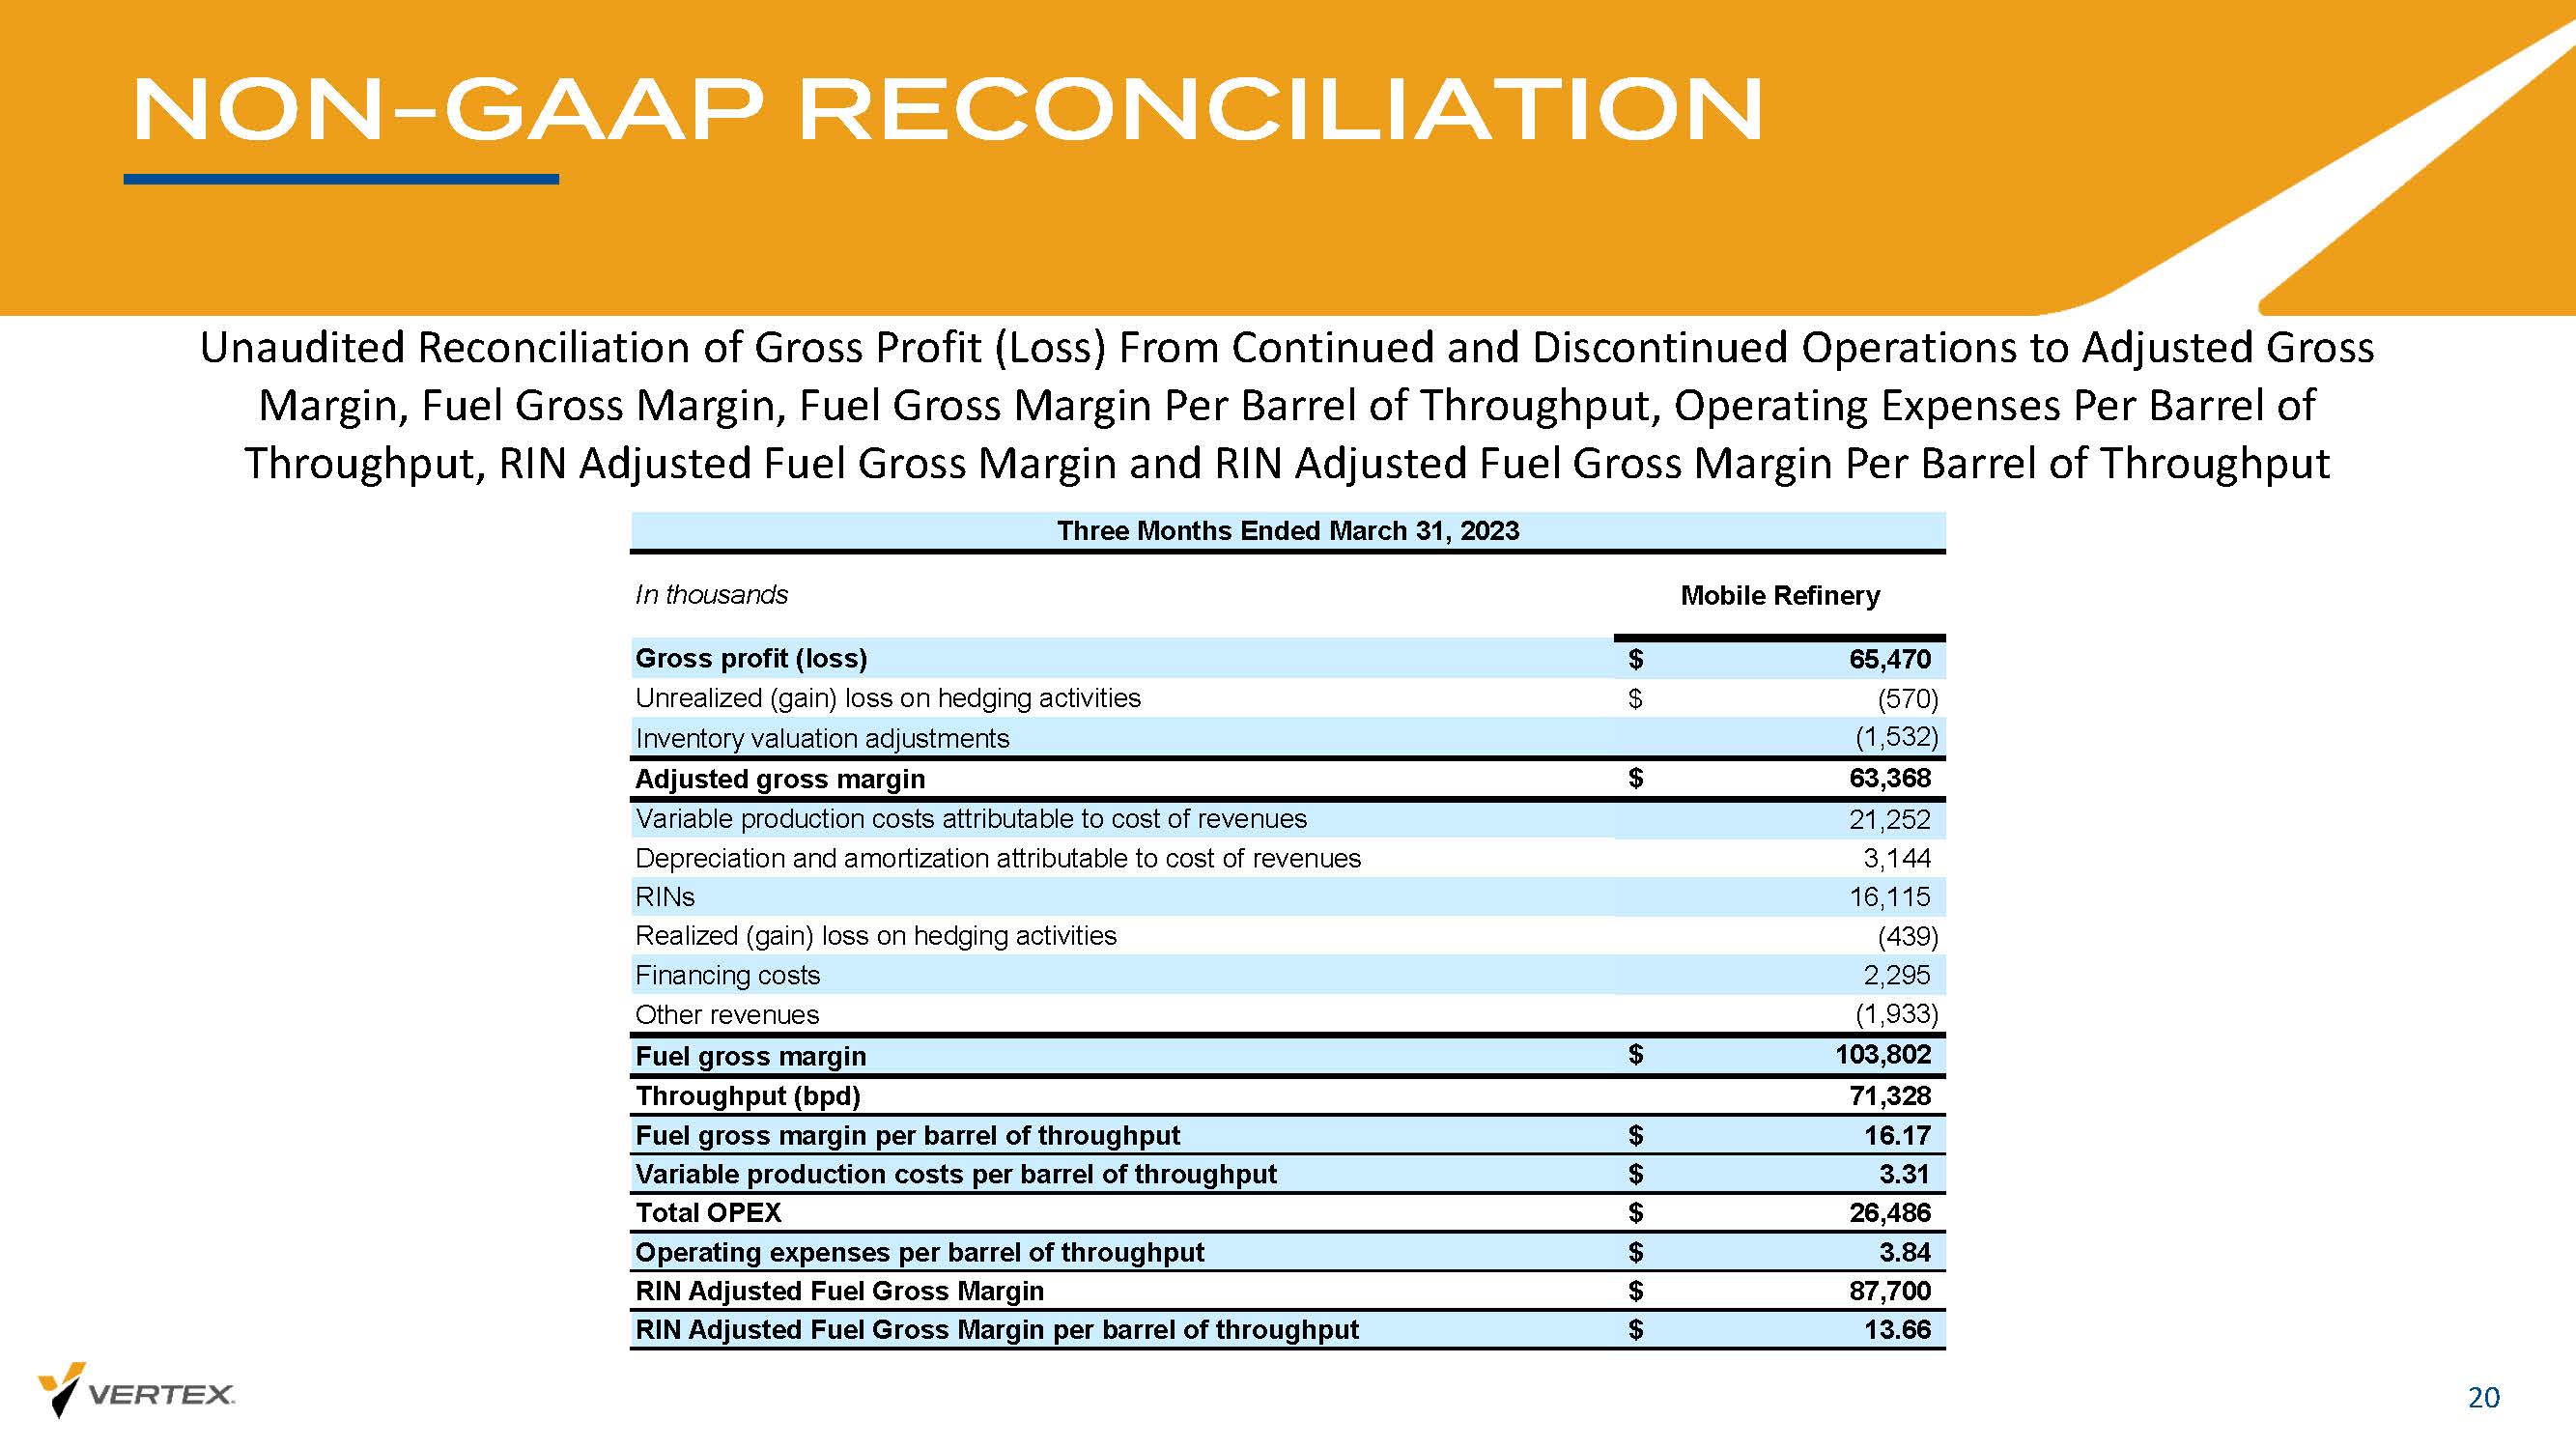
NON - GAAP RECONCILIATION 20 Unaudited Reconciliation of Gross Profit (Loss) From Continued and Discontinued Operations to Adjusted Gross Margin, Fuel Gross Margin, Fuel Gross Margin Per Barrel of Throughput, Operating Expenses Per Barrel of Throughput, RIN Adjusted Fuel Gross Margin and RIN Adjusted Fuel Gross Margin Per Barrel of Throughput
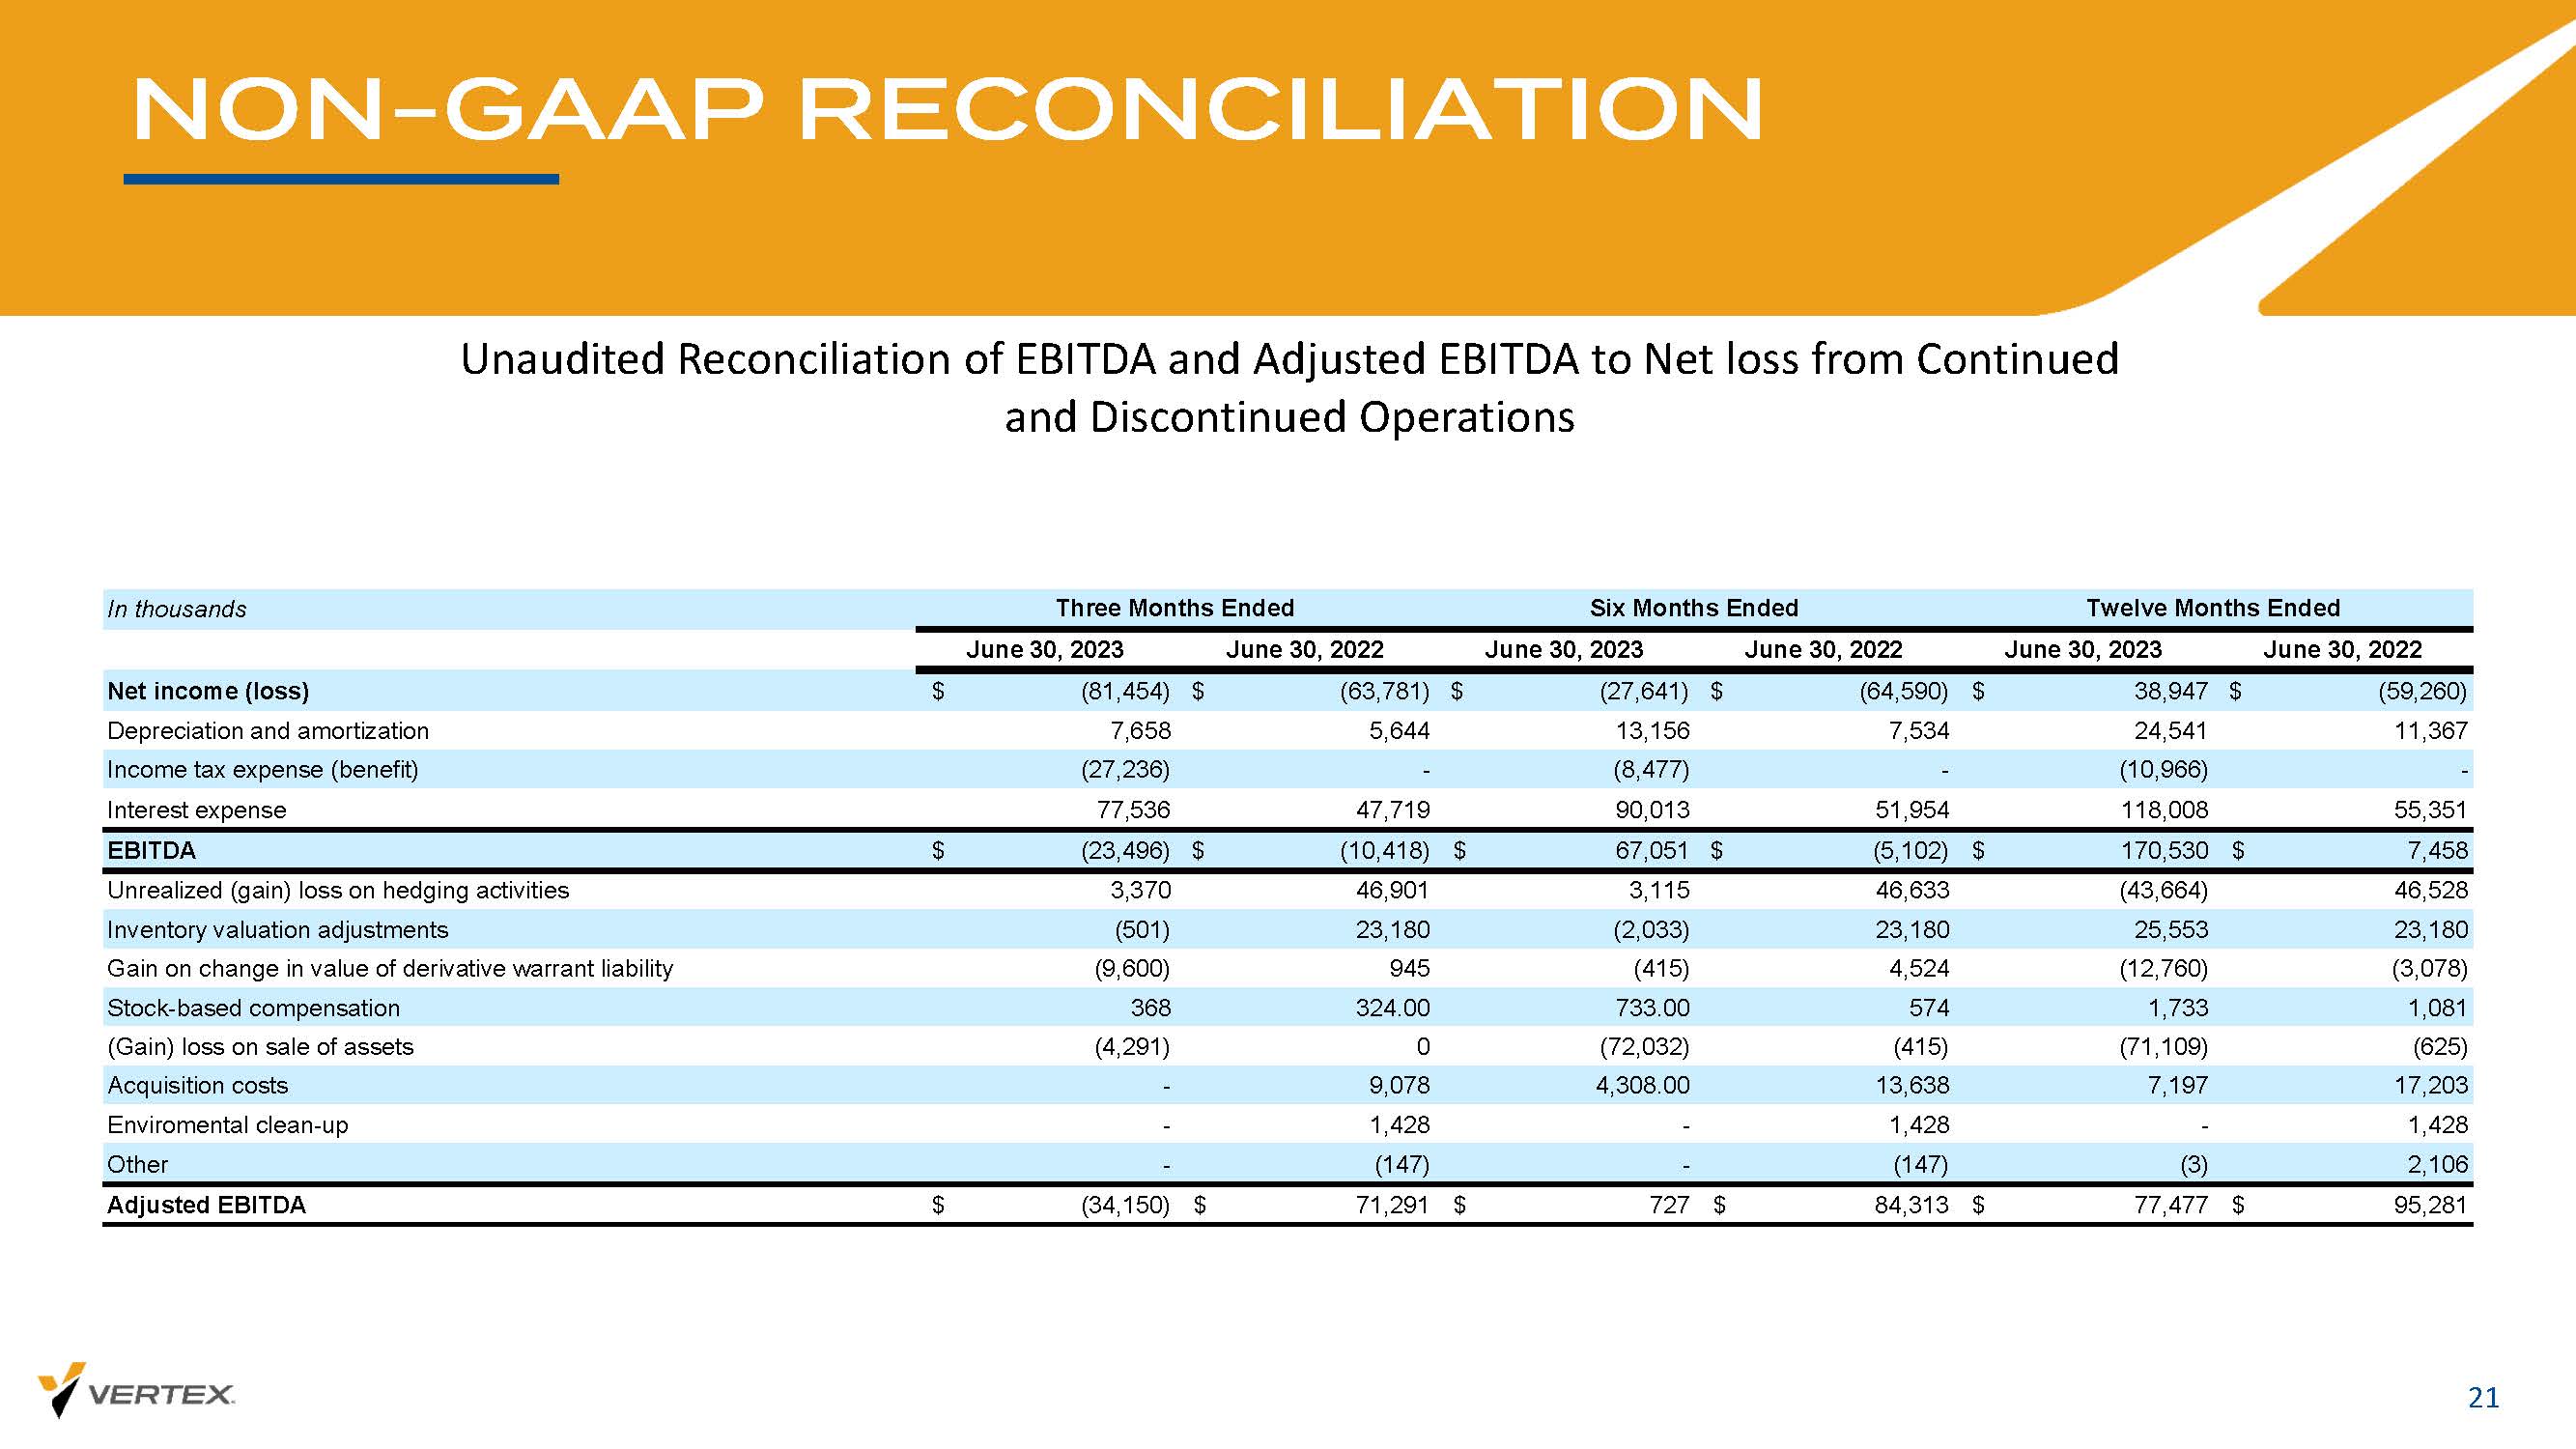
NON - GAAP RECONCILIATION 21 Unaudited Reconciliation of EBITDA and Adjusted EBITDA to Net loss from Continued and Discontinued Operations
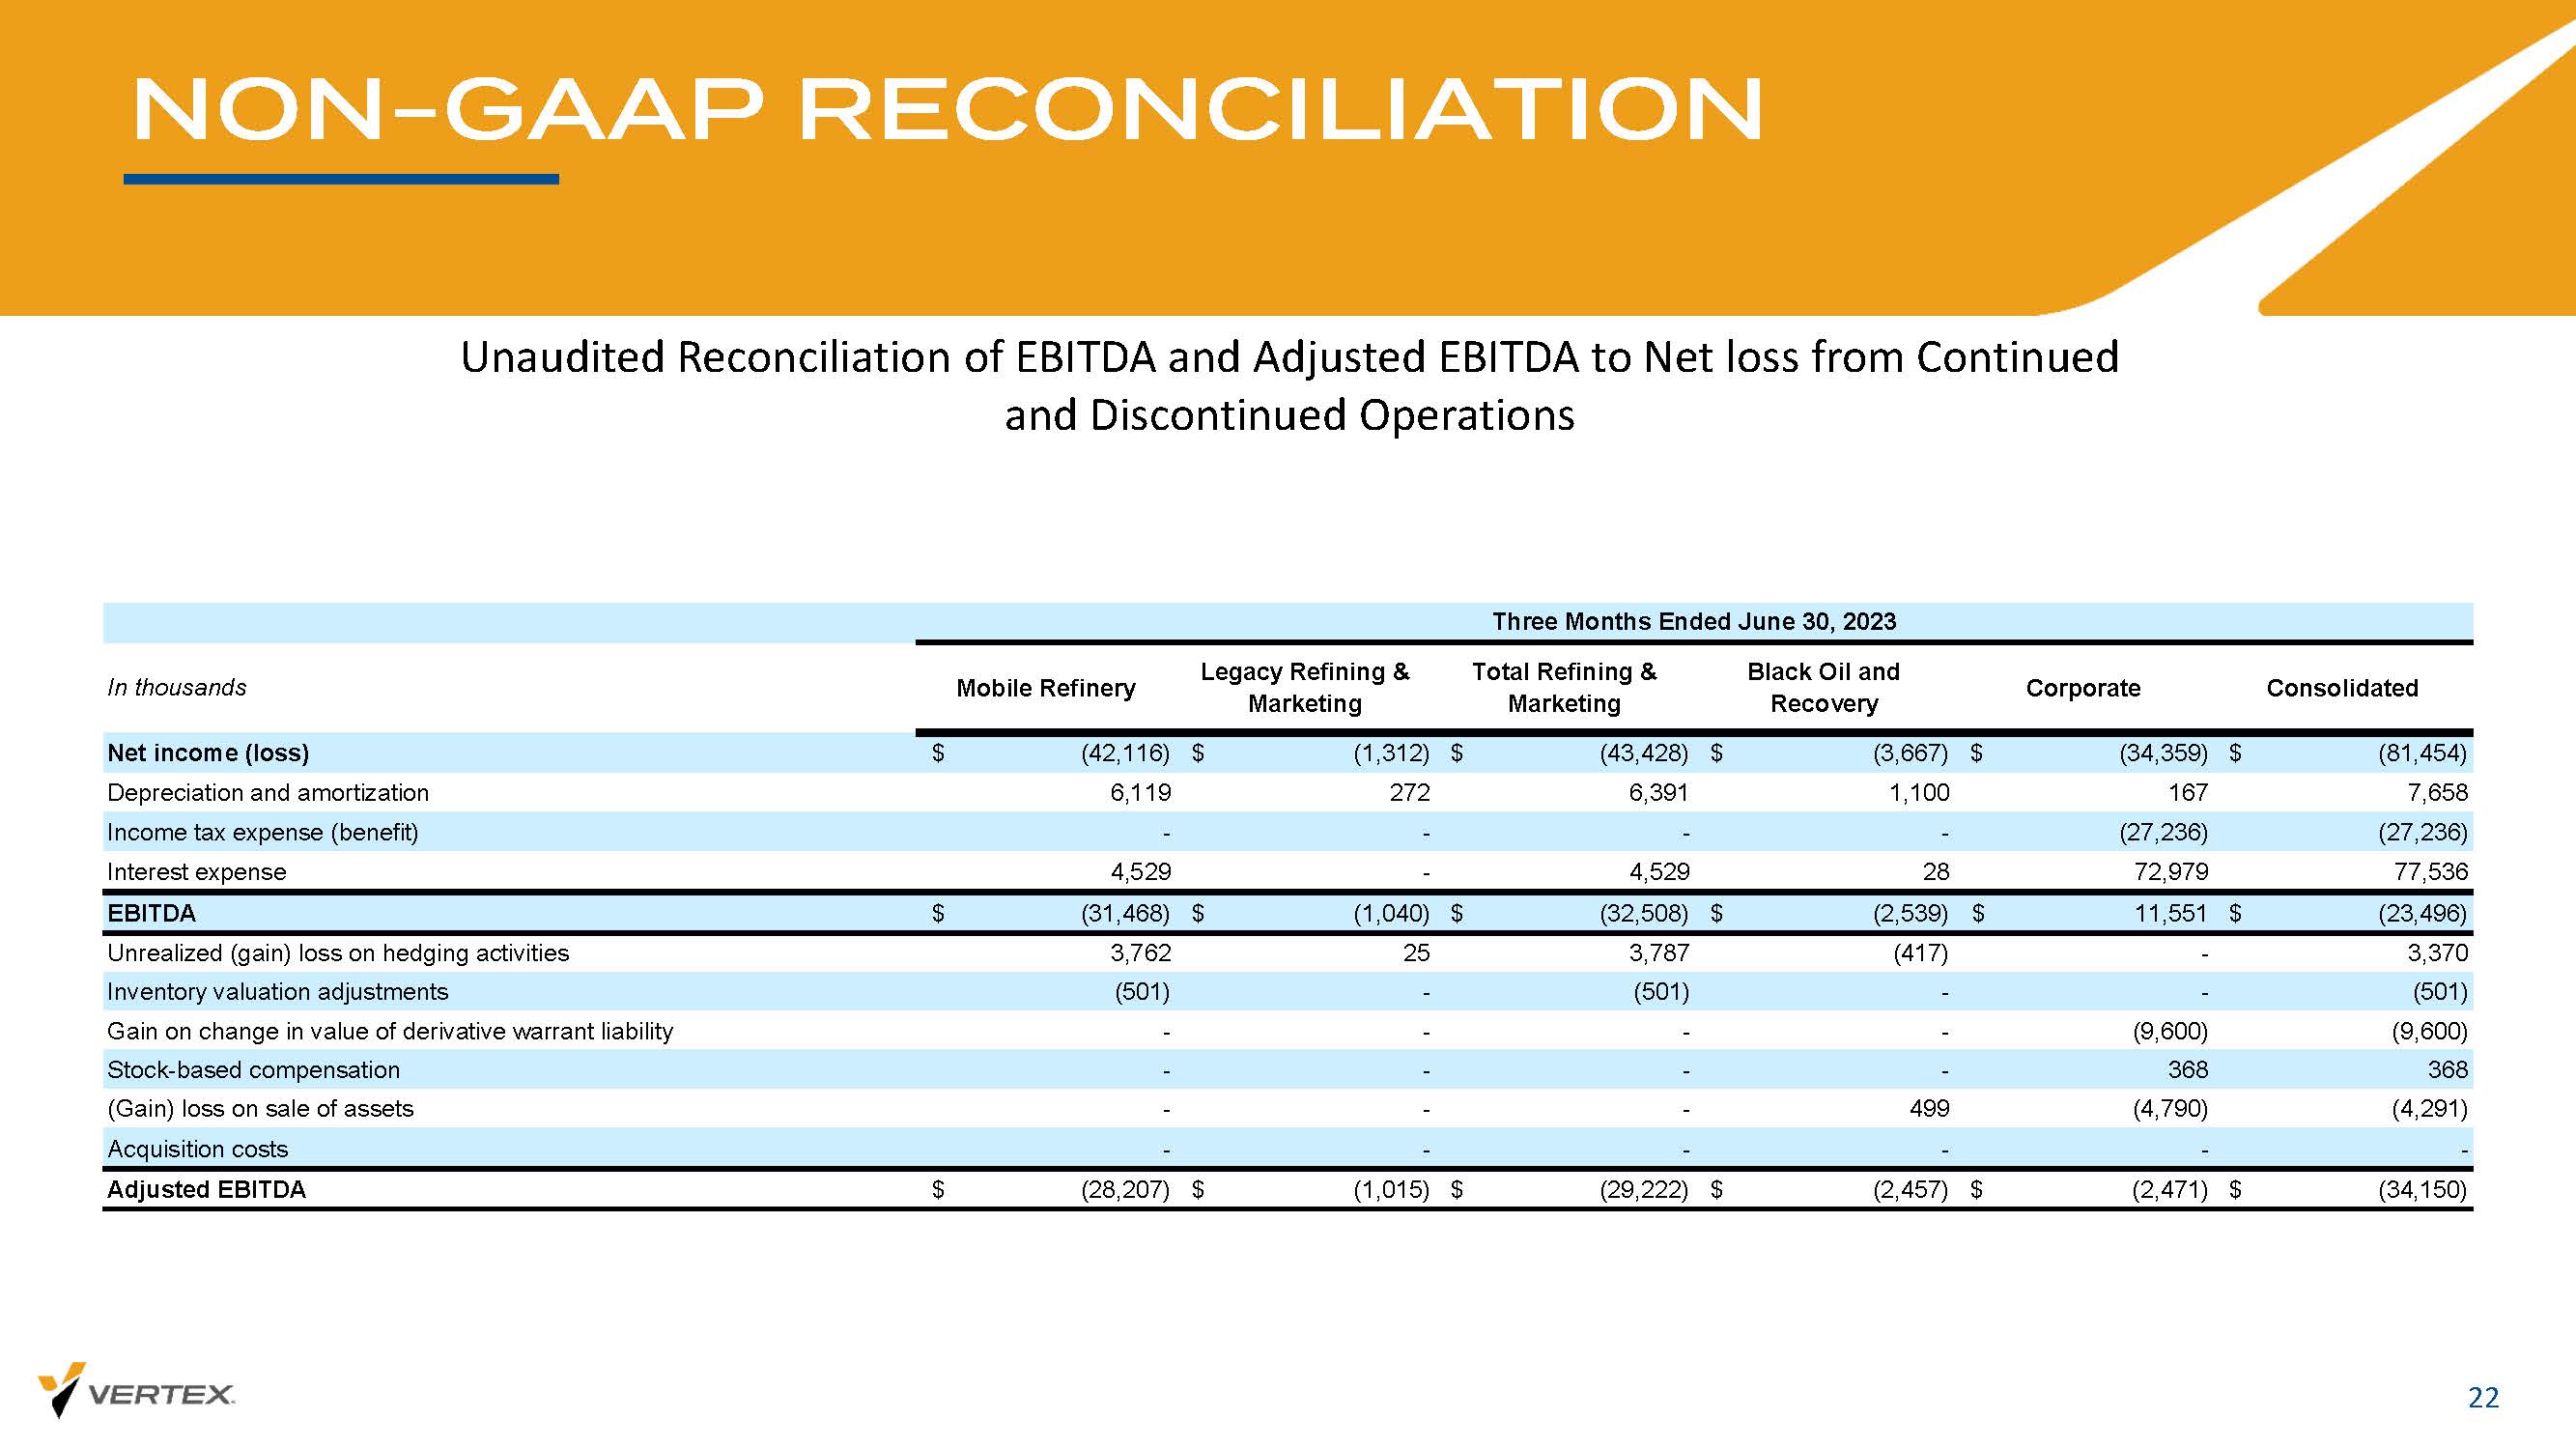
NON - GAAP RECONCILIATION 22 Unaudited Reconciliation of EBITDA and Adjusted EBITDA to Net loss from Continued and Discontinued Operations
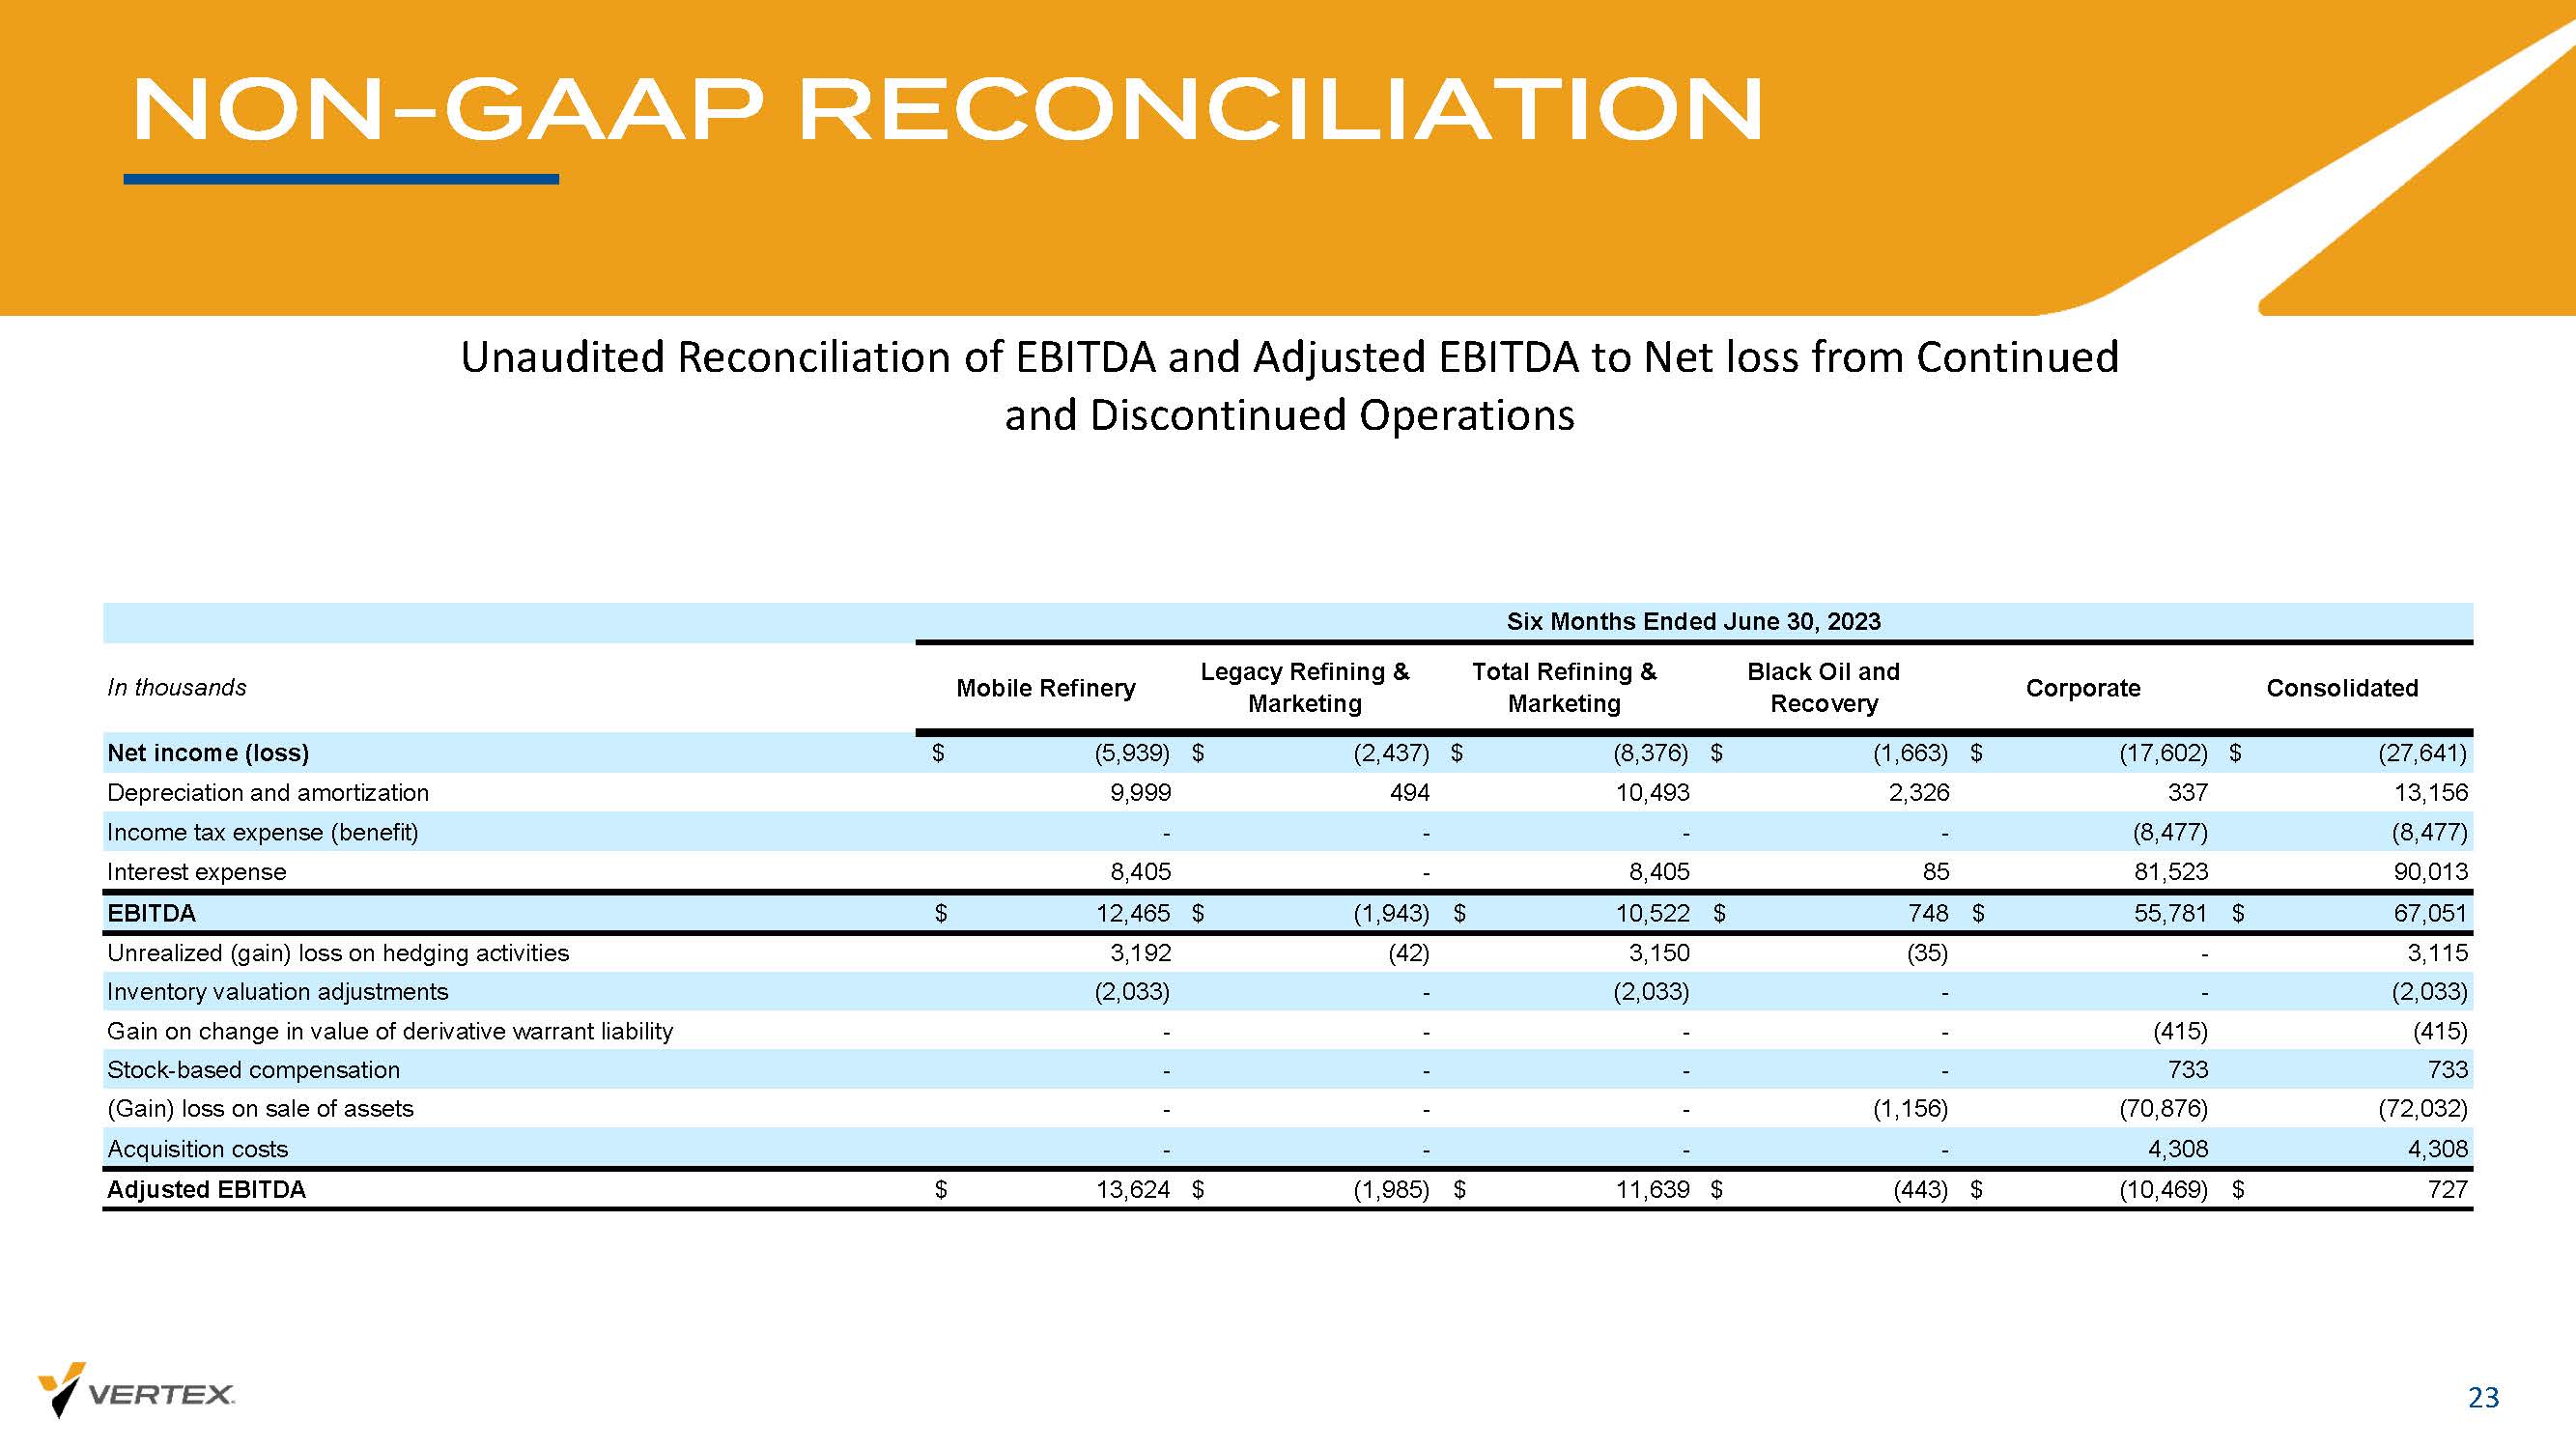
NON - GAAP RECONCILIATION 23 Unaudited Reconciliation of EBITDA and Adjusted EBITDA to Net loss from Continued and Discontinued Operations
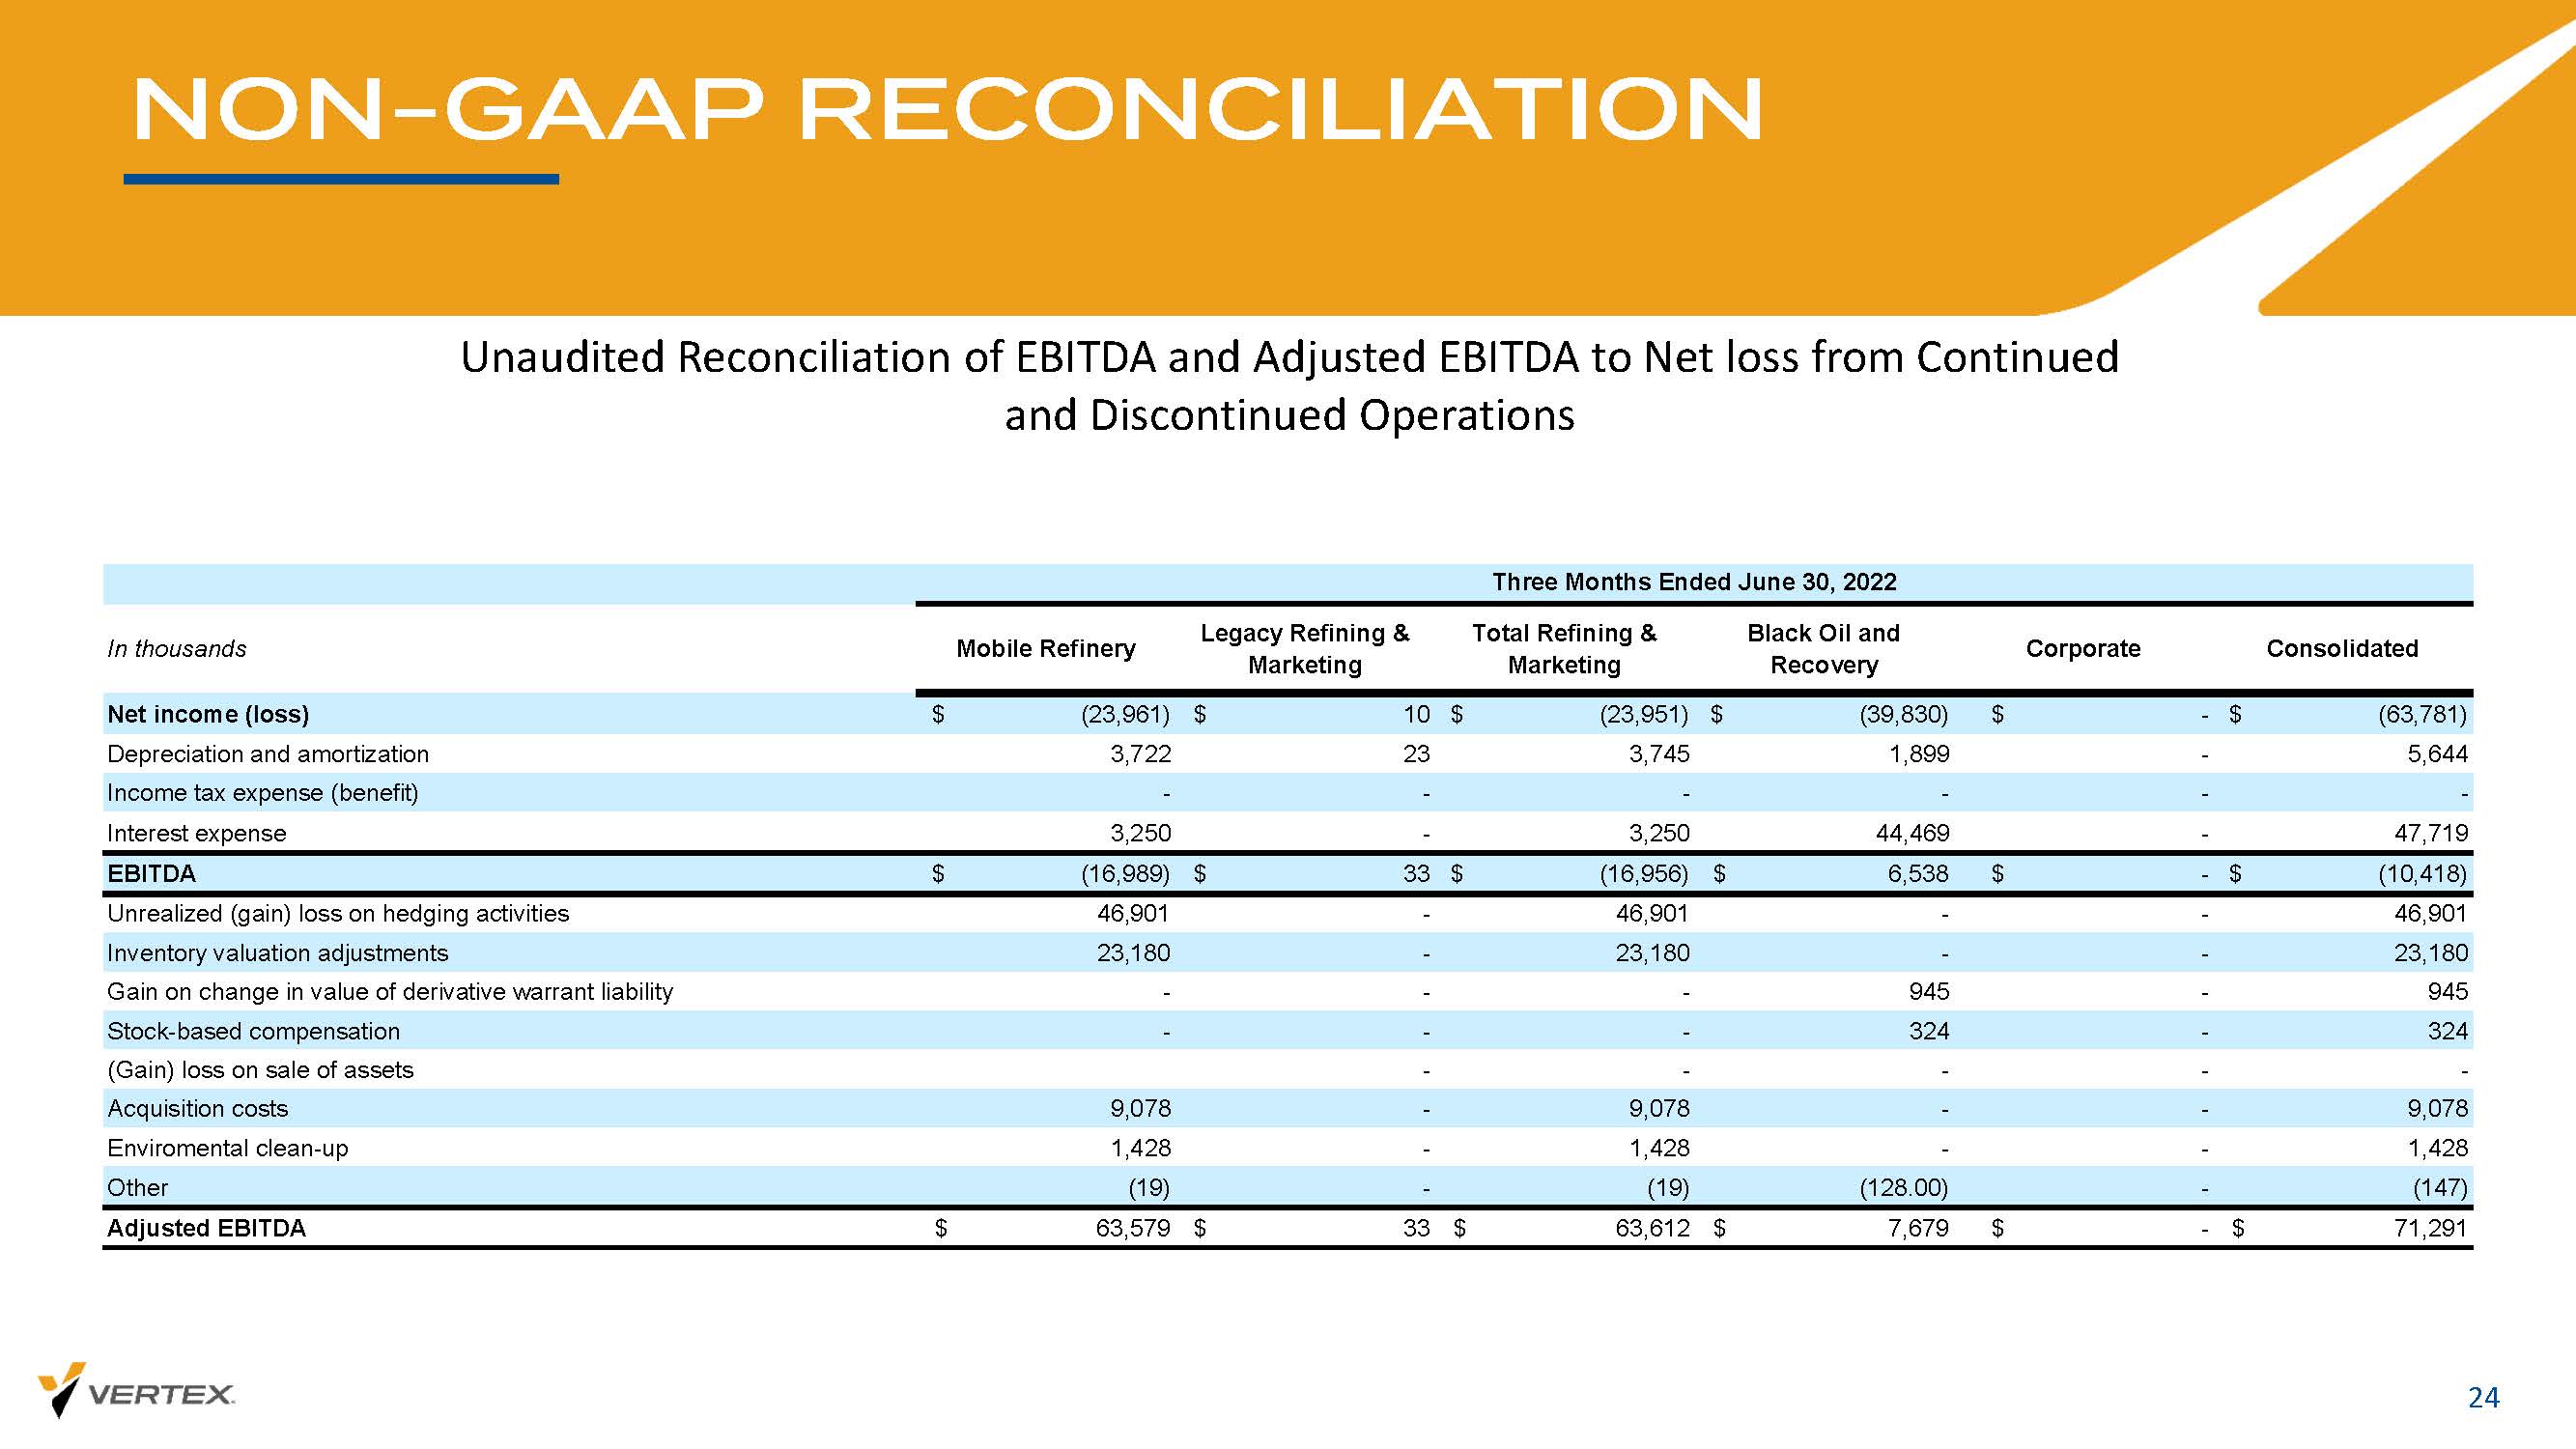
NON - GAAP RECONCILIATION 24 Unaudited Reconciliation of EBITDA and Adjusted EBITDA to Net loss from Continued and Discontinued Operations

NON - GAAP RECONCILIATION 25 Unaudited Reconciliation of EBITDA and Adjusted EBITDA to Net loss from Continued and Discontinued Operations In thousands Mobile Refinery Legacy Refining & Marketing Total Refining & Marketing Black Oil and Recovery Corporate Consolidated Net income (loss) $ (23,961) $ 290 $ (23,671) $ (26,015) $ (14,904) $ (64,590) Depreciation and amortization 3,722 251 3,973 3,315 246 7,534 Income tax expense (benefit) - - - - - - Interest expense 3,250 - 3,250 44,469 4,235 51,954 EBITDA $ (16,989) $ 541 $ (16,448) $ 21,769 $ (10,423) $ (5,102) Unrealized (gain) loss on hedging activities 46,901 - 46,901 (268.00) - 46,633 Inventory valuation adjustments 23,180 - 23,180 - - 23,180 Gain on change in value of derivative warrant liability - - - 945.00 3,579 4,524 Stock-based compensation - - - 324.00 250 574 (Gain) loss on sale of assets - - - (415) - (415) Acquisition costs 9,078 - 9,078 - 4,560 13,638 Enviromental clean-up 1,428 - 1,428 - - 1,428 Other (19) - (19) (128.00) - (147) Adjusted EBITDA $ 63,579 $ 541 $ 64,120 $ 22,227 $ (2,034) $ 84,313 Six Months Ended June 30, 2022
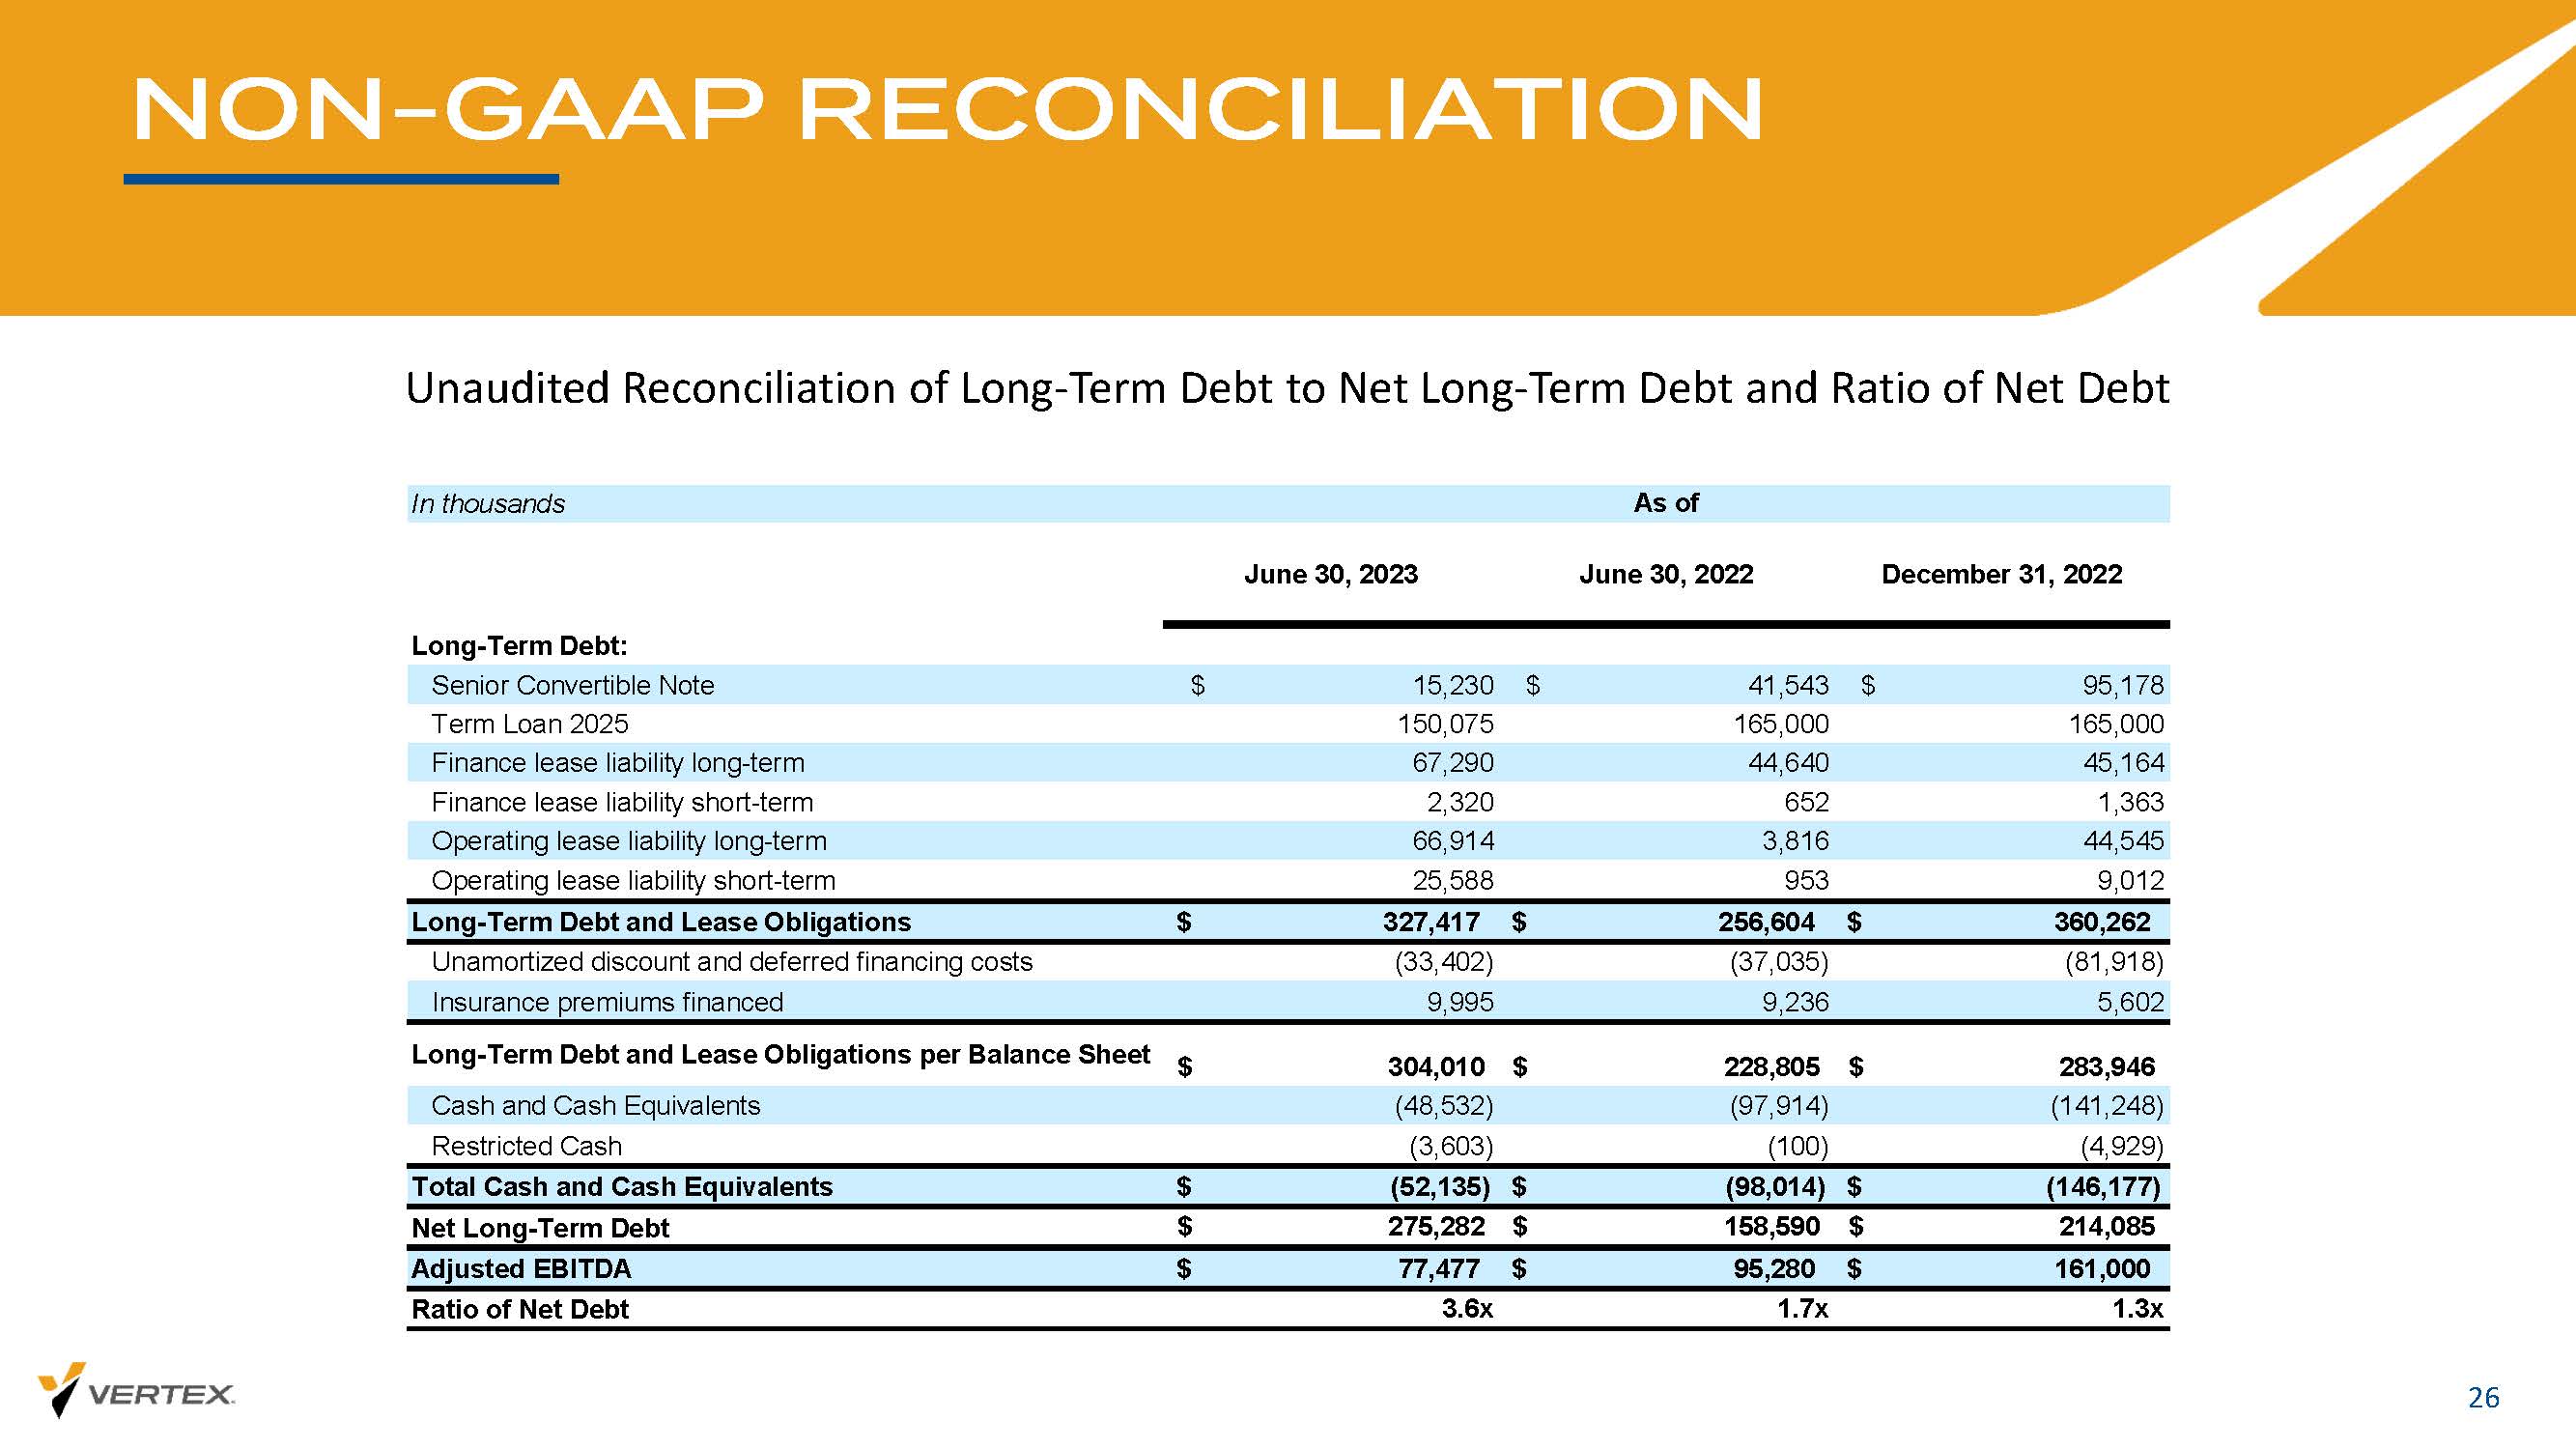
NON - GAAP RECONCILIATION 26 Unaudited Reconciliation of Long - Term Debt to Net Long - Term Debt and Ratio of Net Debt In thousands June 30, 2023 June 30, 2022 December 31, 2022 Long-Term Debt: Senior Convertible Note $ 15,230 $ 41,543 $ 95,178 Term Loan 2025 150,075 165,000 165,000 Finance lease liability long-term 67,290 44,640 45,164 Finance lease liability short-term 2,320 652 1,363 Operating lease liability long-term 66,914 3,816 44,545 Operating lease liability short-term 25,588 953 9,012 Long-Term Debt and Lease Obligations $ 327,417 $ 256,604 $ 360,262 Unamortized discount and deferred financing costs (33,402) (37,035) (81,918) Insurance premiums financed 9,995 9,236 5,602 Long-Term Debt and Lease Obligations per Balance Sheet 304,010$ 228,805$ 283,946$ Cash and Cash Equivalents (48,532) (97,914) (141,248) Restricted Cash (3,603) (100) (4,929) Total Cash and Cash Equivalents $ (52,135) $ (98,014) $ (146,177) Net Long-Term Debt 275,282$ 158,590$ 214,085$ Adjusted EBITDA $ 77,477 $ 95,280 $ 161,000 Ratio of Net Debt 3.6x 1.7x 1.3x As of
v3.23.2
| X |
- DefinitionBoolean flag that is true when the XBRL content amends previously-filed or accepted submission.
| Name: |
dei_AmendmentFlag |
| Namespace Prefix: |
dei_ |
| Data Type: |
xbrli:booleanItemType |
| Balance Type: |
na |
| Period Type: |
duration |
|
| X |
- DefinitionFor the EDGAR submission types of Form 8-K: the date of the report, the date of the earliest event reported; for the EDGAR submission types of Form N-1A: the filing date; for all other submission types: the end of the reporting or transition period. The format of the date is YYYY-MM-DD.
| Name: |
dei_DocumentPeriodEndDate |
| Namespace Prefix: |
dei_ |
| Data Type: |
xbrli:dateItemType |
| Balance Type: |
na |
| Period Type: |
duration |
|
| X |
- DefinitionThe type of document being provided (such as 10-K, 10-Q, 485BPOS, etc). The document type is limited to the same value as the supporting SEC submission type, or the word 'Other'.
| Name: |
dei_DocumentType |
| Namespace Prefix: |
dei_ |
| Data Type: |
dei:submissionTypeItemType |
| Balance Type: |
na |
| Period Type: |
duration |
|
| X |
- DefinitionAddress Line 1 such as Attn, Building Name, Street Name
| Name: |
dei_EntityAddressAddressLine1 |
| Namespace Prefix: |
dei_ |
| Data Type: |
xbrli:normalizedStringItemType |
| Balance Type: |
na |
| Period Type: |
duration |
|
| X |
- DefinitionAddress Line 2 such as Street or Suite number
| Name: |
dei_EntityAddressAddressLine2 |
| Namespace Prefix: |
dei_ |
| Data Type: |
xbrli:normalizedStringItemType |
| Balance Type: |
na |
| Period Type: |
duration |
|
| X |
- Definition
+ References
+ Details
| Name: |
dei_EntityAddressCityOrTown |
| Namespace Prefix: |
dei_ |
| Data Type: |
xbrli:normalizedStringItemType |
| Balance Type: |
na |
| Period Type: |
duration |
|
| X |
- DefinitionCode for the postal or zip code
| Name: |
dei_EntityAddressPostalZipCode |
| Namespace Prefix: |
dei_ |
| Data Type: |
xbrli:normalizedStringItemType |
| Balance Type: |
na |
| Period Type: |
duration |
|
| X |
- DefinitionName of the state or province.
| Name: |
dei_EntityAddressStateOrProvince |
| Namespace Prefix: |
dei_ |
| Data Type: |
dei:stateOrProvinceItemType |
| Balance Type: |
na |
| Period Type: |
duration |
|
| X |
- DefinitionA unique 10-digit SEC-issued value to identify entities that have filed disclosures with the SEC. It is commonly abbreviated as CIK. Reference 1: http://www.xbrl.org/2003/role/presentationRef
-Publisher SEC
-Name Exchange Act
-Number 240
-Section 12
-Subsection b-2
| Name: |
dei_EntityCentralIndexKey |
| Namespace Prefix: |
dei_ |
| Data Type: |
dei:centralIndexKeyItemType |
| Balance Type: |
na |
| Period Type: |
duration |
|
| X |
- DefinitionIndicate if registrant meets the emerging growth company criteria. Reference 1: http://www.xbrl.org/2003/role/presentationRef
-Publisher SEC
-Name Exchange Act
-Number 240
-Section 12
-Subsection b-2
| Name: |
dei_EntityEmergingGrowthCompany |
| Namespace Prefix: |
dei_ |
| Data Type: |
xbrli:booleanItemType |
| Balance Type: |
na |
| Period Type: |
duration |
|
| X |
- DefinitionCommission file number. The field allows up to 17 characters. The prefix may contain 1-3 digits, the sequence number may contain 1-8 digits, the optional suffix may contain 1-4 characters, and the fields are separated with a hyphen.
| Name: |
dei_EntityFileNumber |
| Namespace Prefix: |
dei_ |
| Data Type: |
dei:fileNumberItemType |
| Balance Type: |
na |
| Period Type: |
duration |
|
| X |
- DefinitionTwo-character EDGAR code representing the state or country of incorporation.
| Name: |
dei_EntityIncorporationStateCountryCode |
| Namespace Prefix: |
dei_ |
| Data Type: |
dei:edgarStateCountryItemType |
| Balance Type: |
na |
| Period Type: |
duration |
|
| X |
- DefinitionThe exact name of the entity filing the report as specified in its charter, which is required by forms filed with the SEC. Reference 1: http://www.xbrl.org/2003/role/presentationRef
-Publisher SEC
-Name Exchange Act
-Number 240
-Section 12
-Subsection b-2
| Name: |
dei_EntityRegistrantName |
| Namespace Prefix: |
dei_ |
| Data Type: |
xbrli:normalizedStringItemType |
| Balance Type: |
na |
| Period Type: |
duration |
|
| X |
- DefinitionThe Tax Identification Number (TIN), also known as an Employer Identification Number (EIN), is a unique 9-digit value assigned by the IRS. Reference 1: http://www.xbrl.org/2003/role/presentationRef
-Publisher SEC
-Name Exchange Act
-Number 240
-Section 12
-Subsection b-2
| Name: |
dei_EntityTaxIdentificationNumber |
| Namespace Prefix: |
dei_ |
| Data Type: |
dei:employerIdItemType |
| Balance Type: |
na |
| Period Type: |
duration |
|
| X |
- DefinitionLocal phone number for entity.
| Name: |
dei_LocalPhoneNumber |
| Namespace Prefix: |
dei_ |
| Data Type: |
xbrli:normalizedStringItemType |
| Balance Type: |
na |
| Period Type: |
duration |
|
| X |
- DefinitionBoolean flag that is true when the Form 8-K filing is intended to satisfy the filing obligation of the registrant as pre-commencement communications pursuant to Rule 13e-4(c) under the Exchange Act. Reference 1: http://www.xbrl.org/2003/role/presentationRef
-Publisher SEC
-Name Exchange Act
-Number 240
-Section 13e
-Subsection 4c
| Name: |
dei_PreCommencementIssuerTenderOffer |
| Namespace Prefix: |
dei_ |
| Data Type: |
xbrli:booleanItemType |
| Balance Type: |
na |
| Period Type: |
duration |
|
| X |
- DefinitionBoolean flag that is true when the Form 8-K filing is intended to satisfy the filing obligation of the registrant as pre-commencement communications pursuant to Rule 14d-2(b) under the Exchange Act. Reference 1: http://www.xbrl.org/2003/role/presentationRef
-Publisher SEC
-Name Exchange Act
-Number 240
-Section 14d
-Subsection 2b
| Name: |
dei_PreCommencementTenderOffer |
| Namespace Prefix: |
dei_ |
| Data Type: |
xbrli:booleanItemType |
| Balance Type: |
na |
| Period Type: |
duration |
|
| X |
- DefinitionTitle of a 12(b) registered security. Reference 1: http://www.xbrl.org/2003/role/presentationRef
-Publisher SEC
-Name Exchange Act
-Number 240
-Section 12
-Subsection b
| Name: |
dei_Security12bTitle |
| Namespace Prefix: |
dei_ |
| Data Type: |
dei:securityTitleItemType |
| Balance Type: |
na |
| Period Type: |
duration |
|
| X |
- DefinitionName of the Exchange on which a security is registered. Reference 1: http://www.xbrl.org/2003/role/presentationRef
-Publisher SEC
-Name Exchange Act
-Number 240
-Section 12
-Subsection d1-1
| Name: |
dei_SecurityExchangeName |
| Namespace Prefix: |
dei_ |
| Data Type: |
dei:edgarExchangeCodeItemType |
| Balance Type: |
na |
| Period Type: |
duration |
|
| X |
- DefinitionBoolean flag that is true when the Form 8-K filing is intended to satisfy the filing obligation of the registrant as soliciting material pursuant to Rule 14a-12 under the Exchange Act. Reference 1: http://www.xbrl.org/2003/role/presentationRef
-Publisher SEC
-Name Exchange Act
-Section 14a
-Number 240
-Subsection 12
| Name: |
dei_SolicitingMaterial |
| Namespace Prefix: |
dei_ |
| Data Type: |
xbrli:booleanItemType |
| Balance Type: |
na |
| Period Type: |
duration |
|
| X |
- DefinitionTrading symbol of an instrument as listed on an exchange.
| Name: |
dei_TradingSymbol |
| Namespace Prefix: |
dei_ |
| Data Type: |
dei:tradingSymbolItemType |
| Balance Type: |
na |
| Period Type: |
duration |
|
| X |
- DefinitionBoolean flag that is true when the Form 8-K filing is intended to satisfy the filing obligation of the registrant as written communications pursuant to Rule 425 under the Securities Act. Reference 1: http://www.xbrl.org/2003/role/presentationRef
-Publisher SEC
-Name Securities Act
-Number 230
-Section 425
| Name: |
dei_WrittenCommunications |
| Namespace Prefix: |
dei_ |
| Data Type: |
xbrli:booleanItemType |
| Balance Type: |
na |
| Period Type: |
duration |
|
Grafico Azioni Vertex Energy (NASDAQ:VTNR)
Storico
Da Apr 2024 a Mag 2024

Grafico Azioni Vertex Energy (NASDAQ:VTNR)
Storico
Da Mag 2023 a Mag 2024
