SECURITIES AND EXCHANGE COMMISSION
Washington, D.C. 20549
FORM 6-K
Report of Foreign Private Issuer
Pursuant to Rule 13a-16 or 15d-16 of the
Securities Exchange Act of 1934
For the month of August, 2024
Commission File Number 1-14668
COMPANHIA PARANAENSE DE ENERGIA
(Exact name of registrant as specified in its
charter)
Energy Company of Paraná
(Translation of Registrant's name into English)
José Izidoro Biazetto, 158
81200-240 Curitiba, Paraná
Federative Republic of Brazil
+55 (41) 3331-4011
(Address of principal executive offices)
Indicate by check
mark whether the registrant files or will file annual reports under cover Form 20-F or Form 40-F. Form
20-F ___X___ Form 40-F _______
Indicate
by check mark whether the registrant by furnishing the information contained in this Form is also thereby furnishing the information
to the Commission pursuant to Rule 12g3-2(b) under the Securities Exchange Act of 1934.
Yes _______ No ___X____

List of contents
| 1. Consolidated Results |
2 |
| 1.1 EBITDA |
2 |
| 1.2 Operating Revenue |
3 |
| 1.3 Operating Costs and Expenses |
3 |
| 1.4 Equity in Earnings of Subsidiaries |
5 |
| 1.5 Financial Result |
5 |
| 1.6 Consolidated Net Income |
5 |
| 1.7 Debt |
6 |
| 2. Investments |
7 |
| 3. Copel Geração e Transmissão |
9 |
| 3.1.1 IFRS Effect on the Transmission Segment |
10 |
| 3.2 Operacional Performance |
10 |
| 3.2.1 Generation |
11 |
| 3.2.2 Hydro and Wind Generation |
11 |
| 3.2.3 Thermal Generation |
12 |
| 3.3 Transmission |
12 |
| 3.3.1 RBSE Reprofiling |
12 |
| 4. Copel Distribuição |
13 |
| 4.1 Financial Performance |
13 |
| 4.1.1 Regulatory Efficiency |
14 |
| 4.2 Operacional Performance |
15 |
| 4.2.1 Grid Market (TUSD) |
15 |
| 4.2.2 Captive Market |
15 |
| 4.2.3 Operational Data |
15 |
| 5. Copel Comercialização |
17 |
| 5.1 Financial Performance |
17 |
| 5.2 Operacional Performance |
18 |
| 6. Performance ESG |
19 |
| 6.1 Copel pioneers in ESG in the sector |
19 |
| 6.2 Recent Highlights |
20 |
| 6.3 Indicators |
20 |
| 6.4 Ratings, Rankings, and Indexes |
21 |
| 7. Other highlights |
22 |
| Exhibit |
29 |
1. Consolidated Results
The following analyses refer to the second quarter of 2024 and
the accumulated half-year, compared to the same period in 2023.
1.1 EBITDA
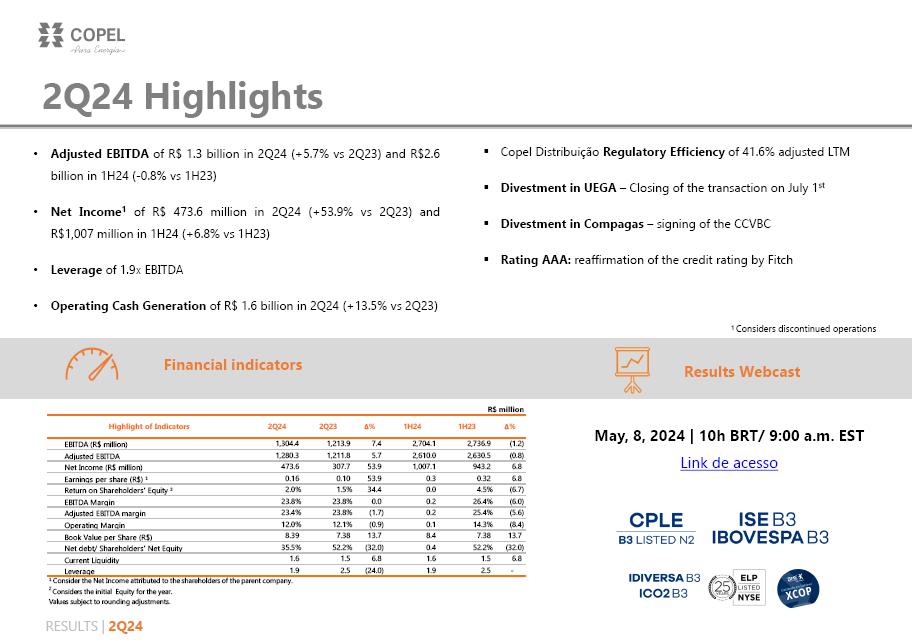
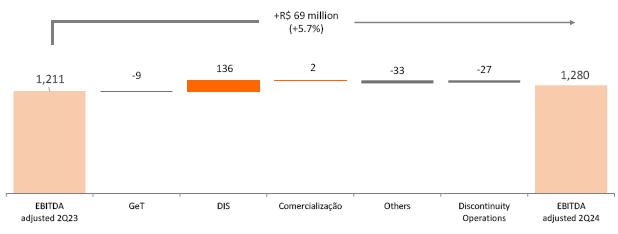
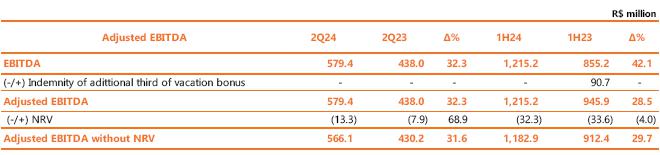
Copel's adjusted EBITDA[1]
was R$1,280.3 million in 2Q24, 5.7% higher than the R$1,211.8 million in 2Q23, mainly reflecting the 31.6% growth in Copel Distribuição's
EBITDA.
Thus, the main factors explaining the result in the quarter
are: (i) the 6.2% growth in the billed grid market, as a result of higher average temperatures in the period; (ii) the tariff adjustment
in June 2023, with an average effect of 6.32% on Tariffs for the Use of the Distribution System (TUSD); and (iii) the control of manageable
costs, which varied by only 0.5% vs. 2Q23, compared to inflation of 3.7% in the same period.
These events were partially offset by (i) the reduction in
the average energy price of Copel GeT's portfolio (R$175.71 compared to R$187.13 in 2Q23, a variation of -6.1%); and (ii) the lower performance
of wind farm complexes due to generation deviation due to the effect of wind volume below certification and unavailability of the generating
park resulting from maintenance, causing revenue frustration of R$ 27.1 million (-192% y/y).
[1]
Excluding non-recurring items, new replacement value (NRV) due to the adjustment to present value of the
compensable asset of Copel Distribuição, and effects of IFRS on assets of transmission contracts.
Adjusted Consolidated EBITDA
Note. Considers discontinued operations
The non-recurring items that were neutralized for the calculation
of adjusted EBITDA are shown in the following table:
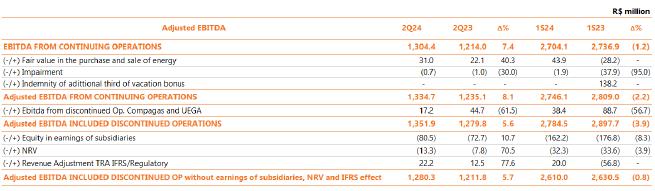
Considering the accumulated result for the semester, adjusted EBITDA
reached R$2,610.0 million, 0.8% lower than the R$2,630.5 million recorded in 1H23, justified mainly by (i) lower performance of Copel
GeT, due to the lower average energy price and the increase in generation deviation from wind farm complexes; and (ii) reduction in Copel
Comercialização's energy marketing margins in the half-year comparison due to the 19.5% lower average energy price; partially
offset by the good operational performance of Copel Dis.
In the context of transmission assets, item 3.1.1 presents the regulatory
accounting of the result for the purpose of verifying the IFRS (International Financial Reporting Standards) effect.
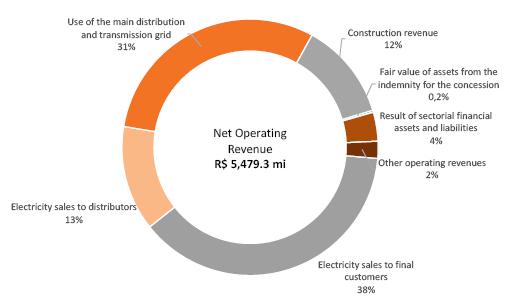
1.2 Operating Revenue
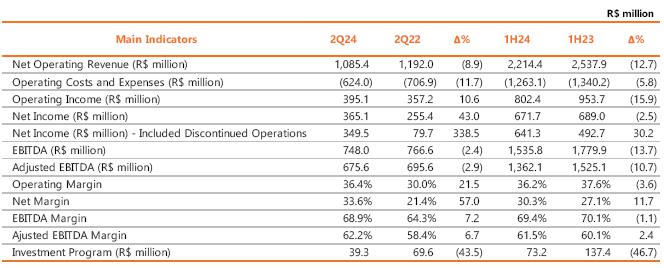
Net operating revenue totaled R$5,479.3 million in 2Q24, up
7.4% from R$5,100.2 million in 2Q23. This result is mainly a reflection of:
| (i) | the R$318.7 million (+23.6%) increase in revenue from Use of the main distribution and transmission grid,
mainly due to the 6.2% growth in Copel Distribuição's billed grid market and the June 2023 tariff adjustment of Copel Distribuição,
with an average effect of 6.32% on tariffs for the use of the distribution system (TUSD); |
| (ii) | the increase of R$253.9 million (+13.9%) in revenue from electricity sales to final customers, mainly
due to the 5.3% growth in the billed captive market and the tariff adjustment applied to the distributor's Energy Tariff (TE) component
in June 2023, with an average effect of 17.4%; and |
| (iii) | (iii) the increase of R$73.2 million (+12.2%) in construction revenue, due to the increase in the volume
of works related to Copel Distribuição's “Transformation” program (see item 2), which includes investments aimed
at improving and modernizing infrastructure and improving customer service. |
These increases were partially offset by (i) the reduction
of R$162.3 million in the result of sectorial financial assets and liabilities (CVA), due to lower energy costs and other financial components
of Copel Distribuição; and (ii) the decrease of R$120.8 million in revenue from electricity sales to distributors, basically
a consequence of the lower average price in the sale of energy (R$175.71 compared to R$187.13 in 2Q23) at Copel GeT.
In the first half of the year, net operating revenue totaled R$10,896.3
million, an increase of 5.1% compared to the R$10,367.8 million recorded in the same period of 2023, with highlights for the following
variations: (i) an increase of R$627.8 million (+22.1%) in revenue from “Use of the main distribution and transmission grid”;
(ii) an increase of R$555.2 million (+14.9%) in “electricity sales to final customers”; (iii) an increase of R$118.5 million
(+10.5%) in construction revenue; (iv) a decrease of R$461.0 million (-76.0%) in the item “result of sectorial financial assets
and liabilities”; and (v) a decrease of R$273.3 million (-15.7%) in revenue from “electricity sales to distributors”.
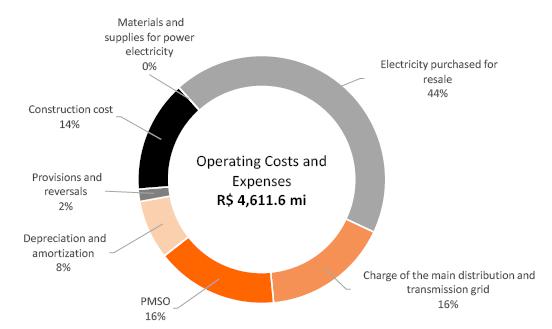
1.3 Operating Costs and Expenses
In 2Q24, operating costs and expenses totaled R$4,611.6 million,
an increase of 7.1% compared to the R$4,307.1 million recorded in 2Q23, mainly due to:
| (i) | the growth of R$135.3 million in electricity purchased for resale (+7.2%) basically due to the increase
of 52.8% (+R$132.0 million) in energy from the distributed generation system; and |
| (ii) | the increase of R$83.1 million (+12.3%) in charge of the main distribution and transmission grid, justified
mainly by the increase in energy consumption in the period. |
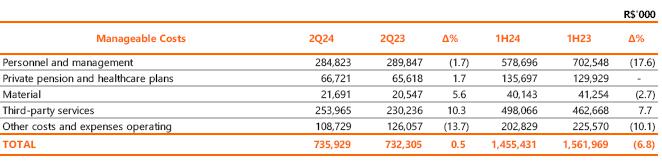
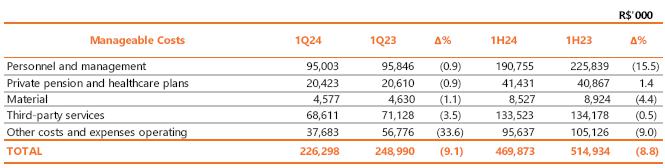
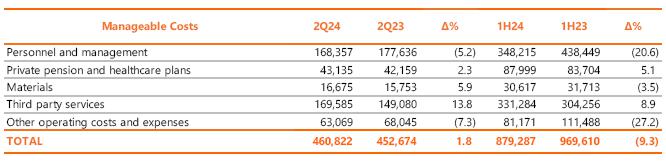
Within the scope of manageable costs, the PMSO, excluding provisions
and reversals, remained practically stable compared to last year, with growth of 0.5%. Third-party service costs increased by R$23.7 million
(+10.3%), primarily due to higher maintenance costs at the distributor; partially offset by a R$17.3 million (-13.7%) reduction in other
operating costs and expenses, primarily due to (a) lower losses related to the deactivation and sale of assets and (b) lower insurance
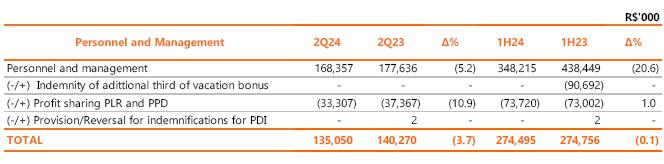
expenses in the amount of R$4.1 million. Personnel and management costs decreased by R$5.0 million (-1.7%) due to the reduction of 258
employees in the workforce.
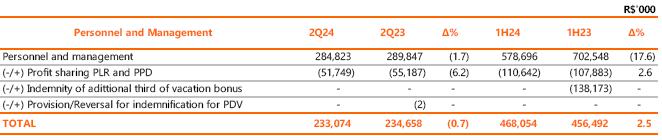
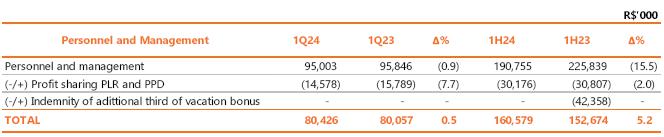
Neutralizing the effects of provisions related to the performance
bonus (PPD), profit sharing (PLR) and voluntary dismissal program (PDV), there was a reduction of 0.7% in the quarterly comparison. Considering
the accumulated inflation of 3.7% measured by the National Consumer Price Index (INPC), there was a decrease in real terms of 4.2%.
Evolution of the establishment plan
Breakdown of Costs and Expenses
In the first six months, total operating costs and expenses
reached R$9,075.1 million, 6.9% higher than the R$8,487.2 million recorded in the same period in 2023. The main variations were: (i)
an increase of R$287.8 million in electricity purchased for resale, mainly due to the 62.3% increase (+R$310.7 million) in financial
compensation for electricity from distributed generation systems; (ii) the increase of R$154.7 million in charge of the main distribution
and transmission grid due to the increase in energy consumption; and (iii) due to the higher amount of provisions, of R$96.0 million,
mainly due to the increase in estimated losses for doubtful debts (PECLD) in the distributor, given the result of the recovery of invoices
due to the end of the collection restrictions imposed on the distributor due to the COVID-19 pandemic in 1H23. These events were partially
offset, especially, by reductions of R$123.9 million in personnel and management, due to the non-recurring effect of the compensation
paid in January 2023 in the amount of R$138.2 million referring to the additional third of vacation bonus, after a collective agreement
signed with employees.
1.4 Equity in Earnings of Subsidiaries
The equity income of Copel's jointly controlled ventures and
other affiliates in 2Q24 increased by 10.7% compared to the same period of the previous year (R$80.5 million, compared to R$72.7 million
in 2Q23). This result is basically due to the periodic tariff review applied to transmission agreements and higher inflation (IPCA) in
2Q24 (1.05% compared to 0.76% in 2Q23). More details can be seen in Exhibit I.
1.5 Financial Result
The financial result was negative by R$289.7 million, compared
to negative R$247.2 million recorded in 2Q23, mainly reflecting (i) the increase of R$55.1 million in expenses with monetary variation
and adjustment to present value on accounts payable linked to the concession, which refers to the balances arising from payments for the
concessions of the Mauá, Colíder, Baixo Iguaçu, Guaricana, Fundão and Santa Clara HPPs, mostly adjusted by
the IPCA + discount rate; (ii) the higher expense (+R$21.4 million) with exchange rate variation on the purchase of electricity from Itaipu,
due to the appreciation of the dollar; and (iii) the increase of R$21.0 million in PIS/Pasep and Cofins on interest on equity (JCP), referring
to the payment of JCP from Copel GeT to Holding, with the payment in 2023 occurring at the end of the year. These events were partially
offset by the R$68.9 million increase in income from financial investments, due to the greater volume of available resources.
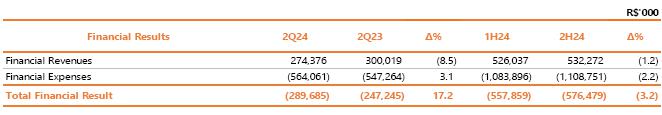
In the year to June 2024, the financial result was negative
by R$557.9 million (R$576.5 million up to June 2023). The result is mainly due to the increase in expenses with monetary variation and
adjustment to present value on accounts payable linked to the concession (UBP) and the higher monetary update of litigation, partially
offset by the growth in income from financial investments.
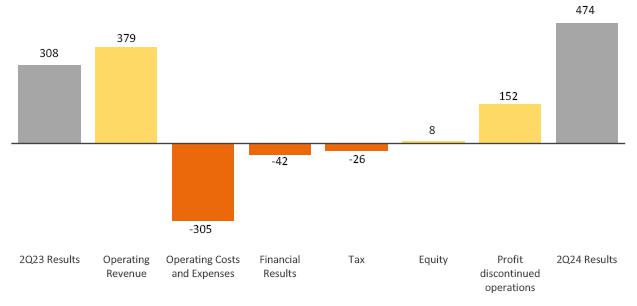
1.6 Consolidated Net Income
Copel reported net income of R$473.6 million compared to R$307.7
million in 2Q23, an increase of 53.9%. In addition to the items already mentioned, the difference is also explained by the impairment
of R$150.4 million in 2Q23 related to UEGA. Of note is the increase of R$26.4 million in the item “Income Tax and Social Contribution”
and the increase of R$8.1 million in the item “depreciation and amortization”.
Considering the accumulated total for the semester, the net income
recorded from discontinued operations was R$1,007.1 million compared to R$943.2 million recorded in the same period of 2023, an increase
of 6.8%.
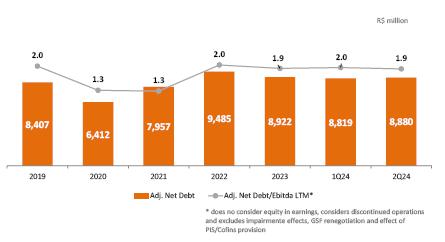
1.7 Debt
Copel's total consolidated debt, considering the result of continued
operations, amounts to R$16,604.9 million on June 30, 2024, a variation of 11.0% in relation to the amount recorded on December 31, 2023,
of R$14,962.3 million. Gross debt represents 63.3% of consolidated equity, which is R$25,033.7 million. Considering adjusted net debt,
the percentage corresponds to 35.5% of equity.
The following table and graphs show the indebtedness of Copel and its
subsidiaries at the end of the second quarter of 2024.
Debt by Subsidiary
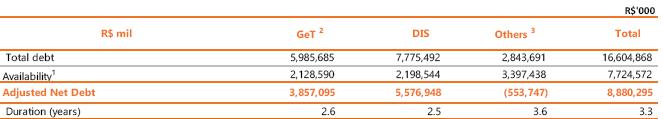
1 The Company has available the amount of approximately
R$ 2.0 billion related to funding in the Primary Share Offering to be allocated to the payment of the Grant Bonus for renewing the concessions
of the FDA, Segredo and Salto Caxias plants.
2 Considered Copel Geração
e Transmissão S.A. (Parent Company).
3 Includes Copel Serviços, wind
farms (Brisa Potiguar, Cutia, Jandaíra, Vilas, Aventura and SRMN) and transmission companies (Costa Oeste and Marumbi).
Adjusted Net Debt/Adjusted EBITDA
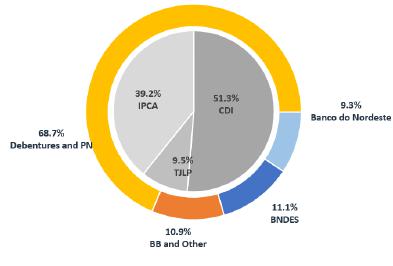
Debt Indexes
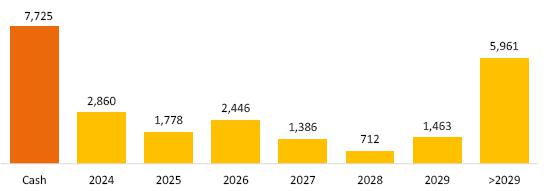
Amortization - R$ million
Average Term: 4.3 years
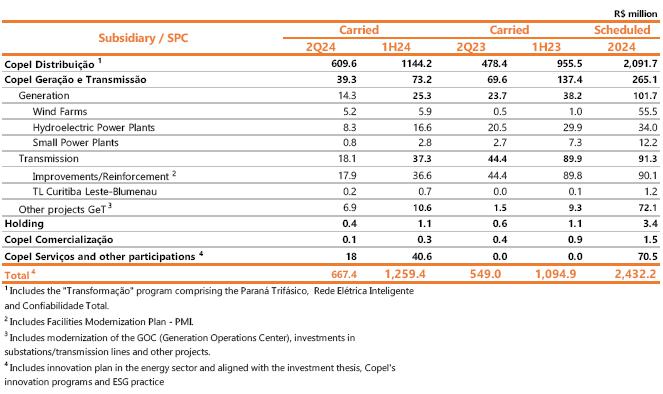
2. Investments
In 2Q24, the investment program amounted to R$667.4 million, of
which 91.3% was invested by Copel Distribuição and 5.9% by Copel Geração e Transmissão.
In the year to date, R$1,259.4 million was invested, of which 90.8%
was invested by Copel Distribuição, with 93.4% allocated to electrical assets and 6.6% to investments in non-electrical
assets and other investments.
The investments made in the distributor are allocated to the following
projects:
| · | Programa Transformação - broad investment plan aimed at modernizing, automating and
renewing the distribution grid and private communication network with standardized technologies to serve automation equipment. Among the
expected benefits are the reinforcement of rural grid to reduce outages and ensure support for the growth of agribusiness in the State
of Paraná, reduction of costs with O&M and commercial services and improvement in the control of the Equivalent Duration of
Interruption per Consumer Unit - DEC and Equivalent Frequency of Interruption per Consumer Unit - FEC indicators. The program consists
of 3 pillar projects to achieve the objectives: |
| o | Paraná Trifásico: represents the improvement and renewal of rural distribution grid in the
Company's concession area, with the implementation of a three-phase grid and creation of redundancy in the main rural branches. By the
end of June 2024, 17,645 km of grid had been completed. |
| o | Smart Grid: aims to implement a private communication network with standardized technology to serve all
distribution grid automation equipment and advanced metering infrastructure. By the end of June 2024, 801,663 smart meters had already
been installed. In the first phase of the program, advances were identified for our operation, with the reduction of man-hours and kilometers
traveled, fewer non-technical losses, improvement in quality and reduction of compensation for violations of quality performance limits. |
| o | Total Reliability: aims to ensure modernity in power grid operations based on the following premises:
maintain full communication between teams and the availability of equipment in the grid, implement automation in special equipment, maintain
the entire municipality of the concession with a substation or special switch and expand the grid circuits and Self Healing equipment.
By the end of June 2024, the project completed 87.15% of the planned schedule. |
“Programa Transformação” covers
the construction of approximately 25 thousand km of new grid, 15 thousand new automated points and the implementation of smart grid technology
in the state of Paraná.
| · | Compact and Protected Grid - deployment of compact grid predominantly in urban areas with a high
degree of afforestation in the vicinity of distribution grid and protected grid exclusively in rural areas. Compact grid avoids cutting
and pruning trees and improves the quality of supply, as it reduces the number of disconnections. Protected grid also improves the quality
and reliability of the system as it avoids interruptions due to contact with vegetation or other objects and bad weather. At the end of
June 2024, the length of the installed compact and protected grid was 30,310 km, compared to 24,676 km in
June 2023, an increase of 5,634 km, or 22.83%, in twelve months. |
| · | Isolated Secondary Grid - investment in low voltage isolated secondary grid (127/220V), which have
significant advantages over the conventional overhead grid, such as: improving DEC and FEC indicators; make energy theft difficult; improve
environmental conditions; reduce pruning areas; increase security; reduce voltage drop across the grid; increase the useful life of transformers
by reducing the number of short circuits in the grid, among others. At the end of June 2024, the length of the installed isolated secondary
distribution grid was 23,245 km, compared to 22,391 km in June 2023, an increase of 854 km, or 3.81%, in twelve months. |
3. Copel Geração e Transmissão
3.1 Financial Performance
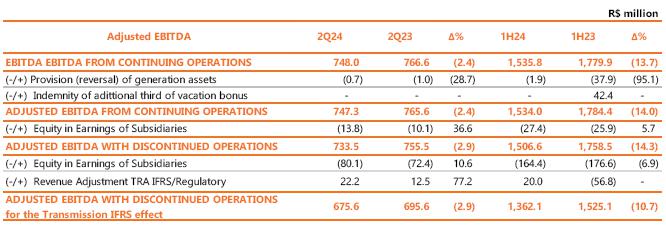
Copel GeT reported adjusted EBITDA[2]
of R$675.6 million, 2.9% lower than the R$695.6 million recorded in 2Q23. This result mainly reflects (i) the lower average price of the
energy portfolio in 2024 (R$175.71 versus R$187.13 in 2Q23), despite the increase in energy sold in the period (5,138 GWh versus 4,965
GWh in 2Q23); and (ii) the lower performance of wind farm complexes due to generation deviation due to the effect of wind volume below
certification, greater curtailment and unavailability of the generating park resulting from maintenance, resulting in revenue shortfall
of R$27.1 million (-192% y/y); partially offset by the R$30.5 million increase in Copel GeT's use of the main transmission grid revenue,
as a result of the periodic tariff review applied to contracts and higher inflation in the comparison between periods (IPCA of 1.05% in
2Q24 compared to 0.76% in 2Q23). Item 3.1.1 presents the regulatory accounting of the result for the purpose of verifying the IFRS (International
Financial Reporting Standards) effect on transmission assets.
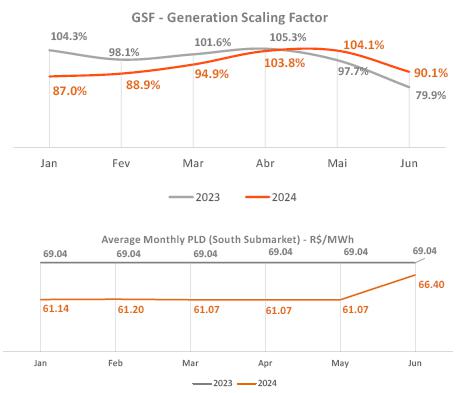
In addition, a reduction in costs with the acquisition of “electricity
purchased for resale” of R$38.1 million was recorded, as a result of better hydrological conditions (average GSF of 99.3%, compared
to 94.3% in 2Q23).
[2]
Excluded non-recurring items and IFRS effects on transmission contract assets.
Expenses with PMSO, excluding provisions and reversals, decreased
by 9.1%, basically influenced by the 33.6% decrease in “Other operating costs and expenses” as a result of net gains from
the sale of properties (+R$15.2 million) and lower insurance costs (-R$2.8 million).
Neutralizing the effects of the provisions related to the PPD
and PLR, there was an increase of 0.5% in personnel and management costs in the quarterly comparison, as a result of the 4.51% salary
adjustment in the Collective Agreement of October 2023. Considering the accumulated inflation of 3.7% measured by the National Consumer
Price Index - INPC, there was a decrease in real terms of 3.1% in personnel costs, as a consequence of the reduction of 78 employees between
the periods.
In the accumulated total, Copel GeT recorded adjusted EBITDA of
R$1,362.1 million, a decrease of 10.7% compared to the same period of the previous year, mainly due to (i) a reduction in revenue from
electricity sales to distributors of R$283.4 million, due to the lower average price of energy and greater generation deviation in wind
complexes and (ii) lower expenditure on electricity purchased for resale in the period of R$26.3 million, explained by better hydrological
conditions in 2Q24 (average GSF 99.3%, compared to 94.3% in 2Q23).
Net income was R$349.5 million compared to R$79.7 million in 2Q23,
due to, in addition to the items already mentioned, (i) the reduction in Income Tax and Social Contribution on Profit, due to the payment
of Interest on Equity (JCP) to Holding; (ii) the reduction of R$54.0 million in financial expenses, due to the lower amount of debt, and
(iii) the better result of discontinued operations since, in 2Q23, there was an impairment provision of R$150.4 million related to UEGA.
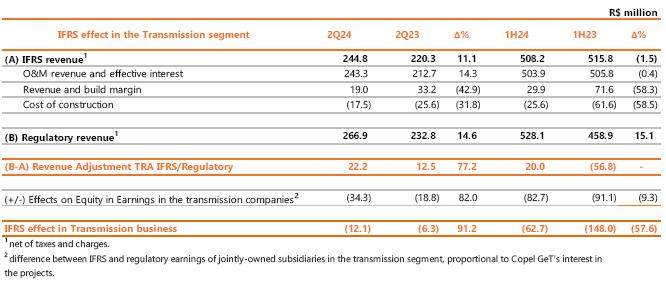
3.1.1 IFRS Effect on the Transmission Segment
3.2 Operational Performance application
of CPC 47 / IFRS 15 on the corporate statements in the transmission segment.
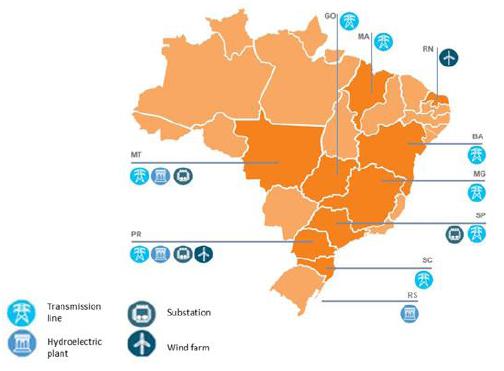
| 3.2 Operacional Performance |
Copel is present in 10 states, operating in the generation and transmission
business.
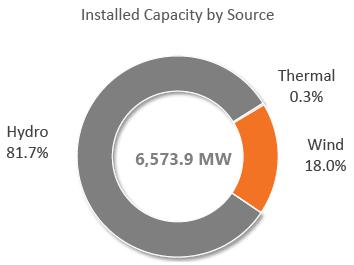
In the Generation business, Copel GET operates a diversified park
of hydroelectric, wind and thermal power plants, totaling 6,573.9 MW of installed capacity and 2,939.8 average MW of assured energy. In
the Transmission business, Copel has a total grid of 9,685 km of transmission lines and 53 basic grid substations, considering the stakes.
For more information on generation and transmission operational
data, see Exhibit IV.
3.2.1 Generation
Copel's
generating complex is composed of 99.7 renewable sources such as hydro and wind.
3.2.2 Hydro and Wind Generation
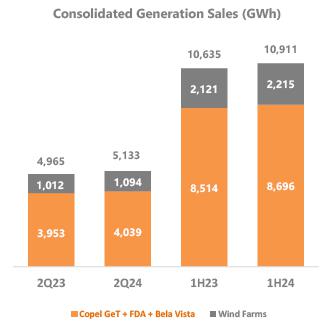
The energy generation of Copel Geração e Transmissão
S.A. and its wind farms until June 2024 was 13,167 GWh compared to 11,212 GWh until June 2023.
In the second quarter of 2024, Copel Geração e Transmissão
(including energy from HPP Foz do Areia and SHP Bela Vista) registered 4,039 GWh of electricity sold, an increase of 2.2%.
For wind farms, the total electricity sold was 1,099 GWh, an increase
of 8.6%, mainly due to the increase in energy sold in the regulated environment (CCEARs) due to the start of supply from the Vilas Wind
Complex[3].
[3] Vila Ceará I, Vila Maranhão I, Vila Maranhão
II and Vila Maranhão III Wind Farms (28°LEN - CCEAR 2024 - 2053).
GSF and PLD
3.2.3 Thermal Generation
TPP Figueira
The 20 MW installed capacity
coal-fired thermoelectric plant is in the process of being divested by the Company, with no current energy supply contracts. In 2Q23,
generation was 2.3 GWh, accumulating a dispatch of 5.3 GWh in the year.
3.3 Transmission
Copel has more than 9,600 km of transmission lines in eight
Brazilian states, considering its own assets and in partnership with other companies. In addition to building, maintaining and operating
its own extensive energy transmission grid, Copel provides services to projects of other concessionaires with the quality of those who
have accumulated 69 years of experience in the sector. The Transmission projects are listed in Exhibit IV, including the Copel Geração
e Transmissão’s SPEs Costa Oeste, Marumbi and Uirapuru Transmissora (100% Copel GeT), as well as the 7 SPEs in which Copel
GeT has a stake.
3.3.1 RBSE Reprofiling
Below we describe the flow of receipt of the portion of the Revenue
related to the Basic Grid of the Existing System – RBSE[4]
for the next cycles. It is important to note that they may be changed in the future, as a result of the tariff review processes and/or
review of parameters used to compose these revenues by the regulatory body. The values below
underwent periodic tariff review, according to Homologation Resolution No. 3,344/2024, and by annual adjustment by the IPCA according
to Homologation Resolution 3,348/2024.
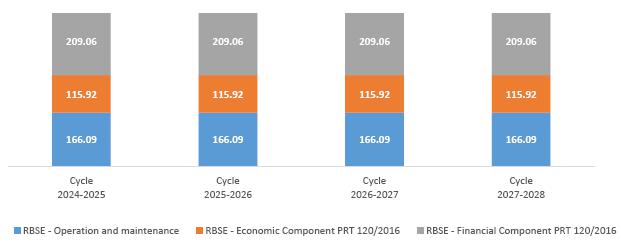
Note:
Economic component: future values based on the 2024-2025 cycle (according
to REH 3.348/2024 of 07/16/2024)
Financial component: values published in REH 2,847/21. Subject to revision
during the current cycle in view of the controversy in the methodology used to calculate these values by the regulatory agency.
APR values up
to the 2027-2028 cycle projected based on the values in REH
3348/2024.
[4]
Refers to concession agreement 060/2001, which represents 41.5% of the annual permitted revenue (APR) from Copel GET transmission and
its proportional participation.
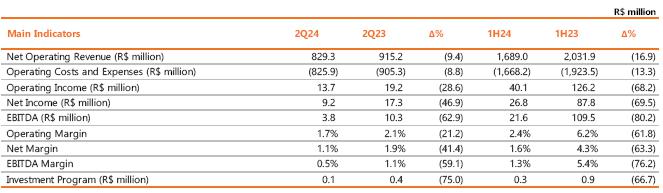
| 4.1 Financial Performance |
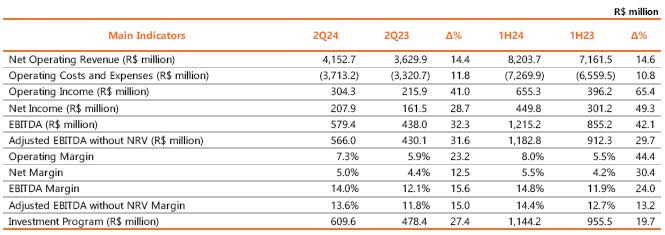
Copel Distribuição reported adjusted EBITDA, excluding
revenue from NRV, of R$566.0 million in 2Q24, an increase of 31.6%, mainly due to the 6.2% growth in the billed grid market (see item
4.2.1) and the tariff adjustment in June 2023, with an average increase of 6.32% in the Tariffs for the Use of the Distribution System
Usage Tariffs (TUSD). In the year to date, adjusted EBITDA, excluding revenue from NRV, reached R$1,182.8 million, an increase of 29.7%.
Manageable costs, excluding provisions and reversals, increased
1.8% compared to 2Q24, mainly due to the R$20.5 million increase in third-party services, substantially linked to the maintenance of the
electrical system. This increase was partially offset by (i) the 5.2% (-R$9.3 million) reduction in personnel and management costs, due
to the reduction of 176 employees in Copel Distribuição's workforce, and (ii) the 7.3% (-R$5.0 million) reduction in other
operating costs and expenses, mainly due to the reduction in losses on the deactivation of assets and rights. In the year to date, manageable
costs fell 9.3%, mainly due to the compensation of the additional third of vacation pay at the beginning of 2023.
The personnel and management
account, excluding the effects of the PPD and PLR provision, recorded a reduction of 3.7%, even with the salary adjustment applied in
the collective agreement and salary policy. In the year to date, excluding these effects and the amounts related to the additional third
of vacation compensation, there was a reduction of 0.1%. Considering the accumulated inflation measured by the INPC, of 3.70%
between 2Q23 and 2Q24, the personnel and management cost line recorded a reduction in real terms of 7.2%.
Copel Distribuição's net income in 2Q24 was R$207.9
million, an increase of 28.7%, driven by the good operating results in the second quarter. Year-to-date, net income was R$449.8 million,
an increase of 49.3%, due to the good operating results in the second quarter and the even better operating results in the first quarter.
The following are Copel Distribuição's main indicators:
In 2Q24, the following also stand out:
| (i) | the 25.1% growth in revenue from use of the main distribution and transmission grid, mainly due to the
6.2% growth in the billed grid market, which considers the offset energy from Mini and Micro Distributed Generation – MMGD, and
the June 2023 tariff adjustment, with an average effect of a 6.32% increase in tariffs for
the use of the distribution system (TUSD); |
| (ii) | the 26.3% increase in revenue from electricity sales to final customers, due to the 5.3% growth in the
billed captive market in the quarter and the average effect of a 17.4% increase in the Energy Tariff (TE) component in the 2023 tariff
adjustment; |
| (iii) | the 70.3% reduction in revenue from electricity sales to distributors, due to the reduction in revenue
from the settlement of energy in the CCEE Spot Market; |
| (iv) | the R$176.4 million increase in electricity purchased for resale (+11.8%) mainly due to higher costs with
energy from the distributed generation system; |
| (v) | the 44.8% reduction in the item Sectorial assets and liabilities result, mainly due to lower energy costs
in the period; |
| (vi) | the 17.7% increase in costs with charges of main transmission grid, the effect of higher expenses with
charges for the use of the basic grid (+R$94.6 million), given the readjustment of the APR of the transmission companies and with the
transmission of power from Itaipu (+R$23.0 million), given the increase in the tariff; and |
| (vii) | provisions and reversals, which remained practically stable, with an increase of R$5.5 million in provisions
for litigation, mainly labor-related, offset by a reduction of R$5.2 million in PECLD, which went from R$29.6 million to R$24.4 million,
mainly due to the 16.76% increase in invoice recovery. |
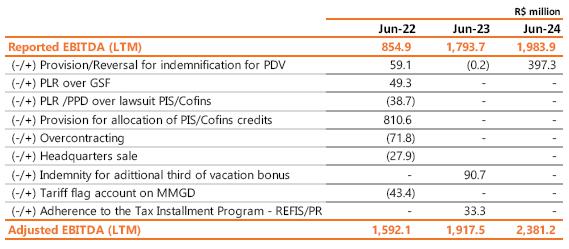
4.1.1 Regulatory Efficiency
Copel Distribuição recorded adjusted EBITDA of R$2,381.2
million in the last 12 months, equivalent to an efficiency of R$699.7 million, 41.6% above the regulatory EBITDA.
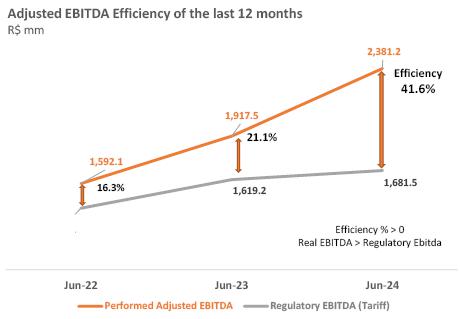
Note: Regulatory EBITDA is calculated based on the WACC
values on Remuneration Base + Special Obligations + LPLT/RGR, and QRR published in ANEEL Technical Notes in Tariff Revision or Adjustment
events.
4.2 Operacional Performance
4.2.1 Grid Market (TUSD)
Copel Distribuição's grid market, made up of the captive
market, the supply to concessionaires and licensees within the State of Paraná and all the free customers existing in its concession
area, had an 8.2% increase in electricity consumption in 2Q24 compared to the same period of the previous year and 9.2% in the year to
date, mainly due to the high temperatures in 2024. The billed grid market, which considers the offset energy from Mini and Micro Distributed
Generation - MMGD, increased 6.2% in 2Q24 and 7.1% in the year to date.
4.2.2 Captive Market
The captive market showed an 8.7% increase
in electricity consumption in 2Q24 compared to the same period of the previous year and 4.1% year-to-date. The billed captive market,
which considers the offset energy from MMGD, showed an increase of 5.3% in 2Q24 and 6.5% year-to-date.
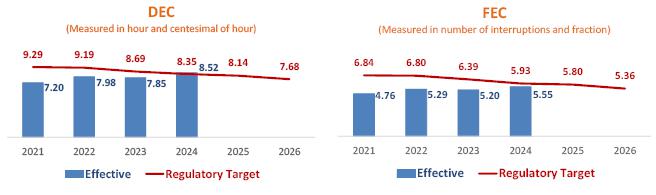
4.2.3 Operational Data
In December 2015, the Company signed the fifth amendment to the
Public Service Concession Agreement for the Distribution of Electric Energy No. 46/1999 of Copel Distribuição S.A., which
extends the concession until July 7, 2045. Copel Distribuição complied with the conditioning requirements of economic-financial
efficiency and quality for the inspection cycle of the initial 5 years. From the sixth year following the conclusion of the contract,
non-compliance with the quality criteria for three consecutive years or economic and financial management for two consecutive years implies
the opening of the forfeiture process. For the criterion of quality of distribution service provision, ANEEL defined the limits of Equivalent
Duration of Interruption per Consumer Unit (DEC) and Equivalent Frequency of Interruption per Consumer Unit (FEC) for the years 2021 to
2026. For the DEC, the result for the last 12 months calculated in June 2024 was 8.52 hours. For the FEC, the result in the same period
was 5.55 interruptions. In recent months, there has been a significant increase in severe weather events in the state of Paraná,
causing damage to the system and, consequently, reducing the resilience of the grid, increasing the number of outages and making it difficult
for maintenance teams to perform their tasks. Investments that will increase the robustness of the grid are underway, such as the “Paraná
Trifásico”, Smart Grid and Total Reability projects.
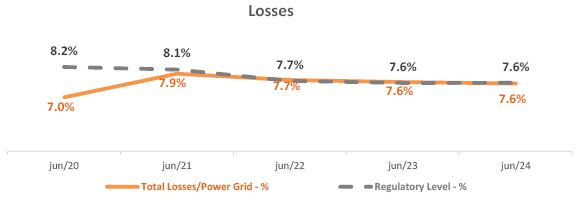
Losses - Distribution losses can be defined as the difference
between the electricity purchased by distributors and the electricity billed to their consumers, being segmented as Technical and Non-technical.
Technical Losses are inherent to the activity of electricity distribution and Non-Technical Losses, originate mainly from theft (clandestine
connection, direct diversion of the grid), fraud (meter tampering or deviations), reading, measurement and billing errors.
At the end of June 2024, Technical Losses for the last 12 months
were 2,230 GWh, compared to 2,052 GWh for the same period of the previous year, and Non-Technical Losses were 681 GWh, compared to 645
GWh for the same period of the previous year. Total losses for the last 12 months totaled 2,911 GWh at the end of June 2024.
| GWh - 12 Months |
jun/20 |
jun/21 |
jun/22 |
jun/23 |
jun/24 |
| Injected Energy |
32,186 |
33,996 |
35,063 |
35,459 |
38,545 |
| Distribution Losses |
2,263 |
2,693 |
2,694 |
2,697 |
2,911 |
| Technical Losses |
1,946 |
2,056 |
2,029 |
2,052 |
2,230 |
| Non-Technical Losses |
317 |
637 |
665 |
645 |
681 |
* Losses
reflect the difference between the measured load and the billed market. In 2020, with the onset of the Covid-19 pandemic, cargo suffered
a rapid retraction and the market did not respond at the same speed, due to the mismatch between the measurement schedule and the consumer
billing calendar, reducing the volume of losses in this period.
Non-Technical Losses are largely associated with the management
of the concessionaire and the socioeconomic characteristics of the concession areas. In this sense, the Company maintains a Program to
Combat Non-Technical Losses through the following actions:
| ü | Improvement of actions to combat irregular procedures; |
| ü | Investments aimed at the provision and/or acquisition of equipment for inspection; |
| ü | Elaboration and execution of specific training related to commercial losses; |
| ü | Conducting inspections, both in Medium and Low Voltage; |
| ü | Educational notes in the press and messages on the electricity bill. |
| ü | Joint operations with the Civil Police and the Public Prosecutor's Office; |
| ü | Opening of a police investigation in the regions where significant numbers of irregular procedures were
found. |
The tariff pass-through of efficient loss levels is provided for
in the concession contracts and these losses are included in the energy purchase costs up to the regulatory limit stipulated by ANEEL.
Copel Distribuição remained within regulatory limits in recent tariff processes.
5. Copel Comercialização |
| 5.1 Financial Performance |
In 2Q24, Copel Comercialização reported adjusted EBITDA
of R$34.8 million, 7.2% higher than the R$32.4 million recorded in 2Q23, mainly reflecting the improvement in the energy sales margin
in the period.
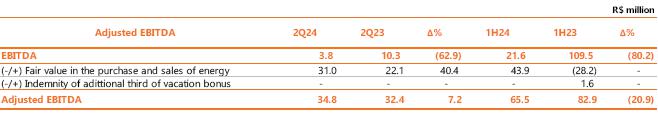
In the quarter, the fair value of energy purchase and sale contracts
(marking to market) - the amount determined by the difference between the contracted price and the future market price estimated by the
Company - was mainly affected by the execution of contracts that were not included in the base and the shift in the PLD of the Northeast
in relation to other regions.
Manageable costs fell by 6.9% in 2Q24, mainly impacted by the
decrease in expenses with renewable energy certification (-R$0.6 million) and insurance (-R$0.2 million), partially offset by the increase
in personnel and administrative costs (+R$0.3 million).

The personnel and management costs, excluding the PLR and
PPD effects, registered an increase of 3.3% in 2Q24, mainly due to the effects of the 2022/2024 ACT with salary adjustments of 4.51%
in October 2023. Considering the accumulated inflation measured by the National Consumer Price Index - INPC, of 3.70%
between the quarters, the personnel and management cost line registered a reduction in real terms of -0.4%. In the accumulated, disregarding
the effects of the PLR and PPD, PDV compensation and compensation
for the additional third of vacation bonus, the personnel account reduced by 33.5%.

Net income in 2Q24 was R$9.2 million, 46.9% lower than the R$17.3
million in 2Q23. This result is mainly due to the change in mark-to-market (negative R$31.0 million in 2Q24 compared to negative R$22.1
million in 2Q23).
In the first half of 2023, adjusted EBITDA decreased by 20.9%,
mainly due to the lower margin in sales due to the lower average energy price of 19.5% and higher provision for doubtful debtors and higher
personnel costs. Copel Comercialização's net income was R$26.8 million compared to R$87.8 million recorded in the first
half of 2023, as a result of the drop in EBITDA and also due to the variation in mark-to-market.
5.2 Operacional Performance
Copel was a pioneer in creating an energy trader and the first to
sell energy to free consumers, when this category was created in the country, in 1995. Copel Comercialização, created in
2016, is among the largest in the country in terms of energy volume sold in a free contracting environment, offering more savings and
peace of mind for customers in all regions of Brazil.
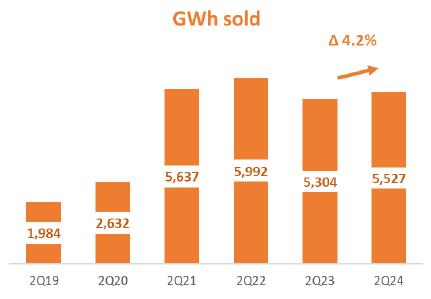
Copel Comercialização is responsible for
the sale of energy and provision of services in the ACL. In June 2024, the Company registered 1,532 customers/contracts, a reduction of
10.9% compared to the same period of the previous year, due to the lower execution of contracts for Free Customers (-14.1%), partially
offset by the increase of 39.8% in bilateral contracts, especially for traders. The amount of energy sold reached 5,527 GWh sold in 2Q24,
an increase of 4.2% compared to the same period of the previous year, due to the effect of the increase in sales to traders in bilateral
contracts (+23.8%). The graph below shows the evolution of Copel Comercialização in terms of the amount of GWh sold and
the number of end consumers.

|
6. Performance ESG |
| 6.1 Copel pioneers in ESG in the sector |
Copel was the 1st company in the sector to produce an Environmental
Impact Report for a generation project, and the 1st company in the energy sector in Brazil to become a signatory to the UN Global Compact
in 2000. The Company promotes actions for the dissemination of the UN 2030 Agenda and the implementation of the SDGs in the electricity
sector. Copel adhered to the "Pact for Water and Energy Resilience" Commitment and also received the Pro-Gender and Race Equity
Seal from the Federal Government. The Company received the Pro-Ethics Seal, 2018-2019 and 2020-2021 editions, granted by CGU and the
ETHOS Institute, for the voluntary adoption of integrity measures, with public recognition for the commitment to implement measures aimed
at the prevention, detection and remediation of acts of corruption and fraud. Copel participates in the 100% Transparency Movement of
the UN Global Compact, the first and largest initiative to promote corporate transparency in Brazil.
Environmental
| § | It has a Copel 2030 Neutrality Plan, approved by the Board of Directors: focusing on science-based targets
(SBTi), with the purpose of neutralizing Scope 1 Greenhouse Gas (GHG) Emissions, for the assets that Copel has operational control over
(according to the concept established in the GHG Protocol methodology) by 2030; |
| § | Net Zero Ambition Movement – Copel joined the Net Zero Ambition Movement. The movement is part of
the strategies developed by the Global Compact so that large companies together can promote actions that result in the reduction of greenhouse
gases by 2030; |
| § | It is part of the Brazilian Business Commitment to Biodiversity with the Brazilian Business Council for
Sustainable Development (CEBDS). |
Social
| § | Actions and Programs – Solidary Selective Collection; Cultivate Energy Program; Electricidania;
Good Neighbor Program; Diversity Commission; Human rights; EducaODS; Enlightening Generations; More than Energy, among others. |
| § | It reformulated its Sustainability Policy, which now includes corporate policies on Human Rights, Stakeholder
Engagement, Private Social Investment, Climate Change, Biodiversity and Environmental. |
| § | It has a Policy, People Management, Occupational Health and Safety, among others. |
| § | Copel's EletriCidadania corporate volunteering program completed 20 years of existence. Created institutionally
in 2004, since then it has brought together more than 1,200 volunteers, in more than 30,000 hours of activities. It is estimated that
at least 190,000 people have benefited from these solidarity actions. |
Governance
| § | It has statutory advisory committees to the Board of Directors: Statutory Audit Committee - CAE; Statutory
Sustainable Development Committee (CDS), Investment and Innovation Committee (IIC) and People Committee (CDG); |
| § | The Board of Directors is composed mostly of independent members; |
| § | The Statutory Audit Committee (CAE) is made up of independent members, one of whom is an external member; |
| § | Establishment of Variable Compensation with ESG goals – 2023: 30% of the PPD; |
| § | Listed in Level 2 of B3's Governance; |
| § | Review of Corporate Policies for Transactions with Related Parties and Conflict of Interest and Integrity; |
| § | On 08/11/2023, Copel was transformed into a Corporation. As a result, the company became a company with
dispersed capital and no controlling shareholder. |
| § | Joined the 100% Transparency Movement of the UN Global Compact; |
Priority SDGs for the Brazilian Electricity Sector

6.2 Recent Highlights
| § | In line with the strategic guideline of having a 100% renewable energy matrix, Copel completed the divestment
of all shares of Copel's stake (81.2%1) in UEG Araucária (“UEGA”) to Âmbar Energia S.A, after fulfilling all
the conditions set forth in the respective Share Purchase and Sale Agreement (CCVA). |
| § | Copel published the 2023 Integrated Report, which details the company's actions within the ESG scope and
highlights Copel's commitment to sustainable and responsible practices, reaffirming its dedication to caring for the environment, social
responsibility and corporate governance. The report, prepared in accordance with the best international transparency and governance practices,
follows the standards of the international standard Global Reporting Initiative (GRI) and is an essential reference for various stakeholders,
serving as a basis for external assessments that analyze the performance
of companies in terms of sustainability. ▪ Copel's transformation into a Corporation led to the review of several Corporate Policies,
Bylaws and Bylaws, keeping the Company's Governance aligned with the best market practices. |
| § | Due to the heavy rains that hit Rio Grande do Sul in 2024, Copel promoted a campaign to collect donations,
which were allocated by the Civil Defense of Paraná to the population affected by the floods in that state. Copel employees contributed
4,500 items of clothing, 3,400 liters of water, approximately two tons of food and animal feed, as well as 18,500 cleaning and hygiene
items. Additionally, the Company sent 1,200 mattresses and another 1,300 cleaning items - such as buckets, brooms, brushes and gloves
- to a Civil Defense collection center in RS, in addition to 51,000 plastic bags for various purposes. The donations also included a truck
with wooden pallets for use in shelters in the São Leopoldo region. |
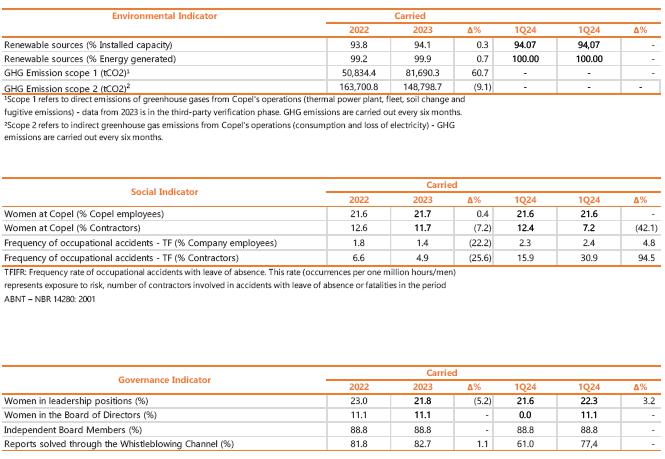
6.3 Indicators
Regarding the GHG scope 1 indicator (tCO2), the increase recorded
is due to the return of commercial operations at UTE Figueira, on 12/7/2022, by ANEEL Order No. 2502/2022, with generation until September
2023. In line with the plan to have a 100% clean generation matrix. According to Material Fact 03/24, the thermal plant is in the process
of divestment by the Company.
6.4 Ratings, Rankings, and Indexes
| Index |
Ranking |
Reference
Year |
 |
15th position
4º in SEB |
2023 |
 |
CSA Score 70 |
2023 |
 |
A- |
2023 |
 |
Sim |
2023 |
 |
Medium Risk |
2023 |
 |
A |
2023 |
Available Cash Flow and Dividends
Available Cash Flow is defined in the Dividend Policy as: DCF
= Cash generated by Operating activities, deducted from net cash used by investment activities, being: (a) Cash Generated by Operating
Activities: cash generated by operating activities in the fiscal year, before taxes, contributions (IRCS) and financial charges; (b) Net
cash used by Investment activities: amount invested in the fiscal year in non-current assets. The Table below demonstrates the calculation
of the FCD on June 30, 2024:

On June 28, the Company
made a total payment of R$632 million in dividends to its shareholders, totaling a Payout of 50%, in accordance with the Dividend Policy.
Divestment of Compagas
On July 1, a Controlling
Block Purchase and Sale Agreement was signed with Compass Dois Ltda., a subsidiary of Compass Gás e Energia S.A., for the sale
of all shares representing 51% of Companhia Paranaense de Energia – Compagas. The sale price (equity value) was R$906.0 million,
to be adjusted as provided for in the contract. The conclusion of the Transaction is subject to the non-exercise of the preemptive right
of the current shareholders and the verification of usual conditions for transactions of this nature, including approval by the competent
bodies. More information is available in Material Fact 06/24.
Conclusion of Divestment in UEGA
On July 1, the Company
concluded the divestment of all shares of Copel's 81.2% stake in UEG Araucária to Âmbar Energia after fulfilling all conditions
set forth in the Share Purchase and Sale Agreement (CCVA). With the divestment, the Company takes another step towards meeting the strategic
guideline of having a 100% renewable energy matrix, strengthening the pillars for the sustainability and sustainable growth of its business.
Copel Distribuição Tariff
Adjustment
As of June 24, 2024,
Copel Distribuição's new tariff structure came into effect, with an adjustment approved by the National Electric Energy
Agency (ANEEL), whose average effect to be perceived by consumers was 0.00%. More information is available in Notice to the market 20/2024.
Fitch Reaffirms Copel and its Subsidiaries'
'AAA(bra)' Rating
On May 24, 2024, the
credit rating agency Fitch Ratings (“Fitch”) reaffirmed the Long-Term 'AAA(bra)' rating of Copel and its wholly-owned subsidiaries
Copel Geração e Transmissão, Copel Distribuição and Copel Serviços, the highest possible on
Fitch's scale. At the same time, the outlook for the corporate ratings was maintained as stable. The conservative financial leverage,
the strong business profile, the efficiency gains in Distribution and the positive free cash flow stand out as relevant points of the
rating.
New CFO
Economist Felipe Gutterres
took office as the Company's Chief Financial and Investor Relations Officer (“CFO”) on July 1, 2024. The new officer has a
solid professional trajectory in national and international companies, with extensive experience in corporate finance, leadership, business
development and sustainability, complex negotiations, corporate innovation, operational risk management and investor relations, with a
recognized track record in large companies in the Infrastructure, Logistics, Oil and Gas and Technology segments.
New CEO of Copel Comercialização
On June 3, 2024, engineer
Rodolfo Lima was sworn in as the new CEO of Copel Comercialização. With extensive experience in the electricity sector,
the new director brings with him a history of leadership and innovation, with in-depth knowledge in the area of market
development, commercialization and negotiation in the Brazilian electricity sector, as well as experience in the area of systemic
assessments and strategic definition for risk mitigation, and short- and long-term price forecasts. Most recently, the executive served
as Chief of Commercial Officer (CCO) at AES Brasil and previously held leadership positions at Three Gorges Corporation (CTG) and CPFL
Energia.
New Director of Regulation and Market
Engineer André
Gomes was sworn in as Director of Regulation and Market on July 1, 2024. With over 24 years of experience in the electricity sector, he
has held leadership positions in agencies and companies such as CPFL Energia, AES Brasil and the National Electric Energy Agency (ANEEL),
being responsible for regulatory, strategic and institutional matters, standing out in conducting tariff adjustment and review processes
for distribution and transmission and in leading the post-privatization management process of CEEE-T. His last position was as President
of CPFL Transmissão.
Copel wins the award for best investment
fund in energy transition
Copel won the Energy
Summit Awards in the Investment Funds category, which aims to recognize initiatives that are accelerating transformation in the energy
and ESG segment. The winning fund is Copel Ventures I, the Company's first Corporate Venture Capital (CVC) fund, focused on investments
in startups in the energy sector. The fund seeks to drive innovation and sustainable growth in the segment through contracts made through
public notices.
Copel's Ombudsman's Office is elected the
best in Brazil for the 4th time by Aneel
Copel's ombudsman's office
was elected the best in Brazil for the fourth time in seven years. The award, considered the main award in the electricity sector in the
area and an initiative of Aneel, recognizes the greatest efficiency in handling customer complaints and in the service structure offered.
Copel engineer is honored at the Crea-PR
Engineer Enedina Marques Award 2024
Engineer Gisele Monteiro
was honored with the Enedina Alves Marques award, which aims to value female talents and celebrate their achievements. Graduated from
the Federal Technological University of Paraná (UTFPR), with specialization in Electrical Systems Protection, Finance, Executive
MBA in Administration and Human Development of Managers. She worked as a postgraduate professor in the energy market and regulation of
the electricity sector, having worked at Universidade Positivo, Fundação Getúlio Vargas and UniSociesc-Joinville.
She started at Copel as an electronics technician, worked as a systems protection engineer and held leadership positions in the areas
of energy efficiency, regulation, tariffs and energy trading. She recently served as Head of Energy Market, coordinating planning, portfolio
management and risk activities.
Copel implements intelligent power grid
management system
On May 16, the last Go-Live
of the ADMS (Advanced Distribution Management System) was completed, with the start of operations in the eastern region. ADMS is a cutting-edge
technology that helps in the supervision and control – in real time – of electric power distribution substations. The new
technology provides a comprehensive view of the entire distribution network, allowing operators to monitor and control the network more
effectively, responding quickly to any anomalies or emergencies.
Disclaimer
Informações contidas neste documento podem incluir
considerações futuras e refletem a percepção atual e perspectivas da diretoria sobre a evolução
do ambiente macroeconômico, condições da indústria, desempenho da Companhia e resultados financeiros. Quaisquer
declarações, expectativas, capacidades, planos e conjecturas contidos neste documento, que não descrevam fatos históricos,
tais como informações a respeito da declaração de pagamento de dividendos, a direção futura
das operações, a implementação de estratégias operacionais e financeiras relevantes, o programa de
investimento, os fatores ou tendências que afetem a condição financeira, liquidez ou resultados das operações
são considerações futuras de significado previsto no “U.S. Private Securities Litigation Reform Act”
de 1995 e contemplam diversos riscos e incertezas. Não há garantias de que tais resultados venham a ocorrer. As declarações
são baseadas em diversos fatores e expectativas, incluindo condições econômicas e mercadológicas, competitividade
da indústria e fatores operacionais. Quaisquer mudanças em tais expectativas e fatores podem implicar que o resultado real
seja materialmente diferente das expectativas correntes.
Relações com Investidores
ri@copel.com
Telefone: (41) 3331-4011
| Exhibit I - CONSOLIDATED RESULTS > INCOME STATEMENT |
| |
|
|
|
|
|
R$ '000 |
| Income Statement |
2Q24 |
2Q23 |
Δ% |
1H24 |
1H23 |
Δ% |
| OPERATING REVENUES |
5,479,266 |
5,100,224 |
7 |
10,896,264 |
10,367,781 |
5.1 |
| Electricity sales to final customers |
2,079,469 |
1,825,581 |
14 |
4,284,934 |
3,729,740 |
14.9 |
| Electricity sales to distributors |
726,606 |
847,446 |
(14) |
1,466,836 |
1,740,110 |
(15.7) |
| Use of the main distribution and transmission grid |
1,667,928 |
1,349,244 |
24 |
3,473,212 |
2,845,462 |
22.1 |
| Construction revenue |
674,322 |
601,105 |
12 |
1,247,969 |
1,129,474 |
10.5 |
| Fair value of assets from the indemnity for the concession |
13,307 |
7,881 |
69 |
32,277 |
33,615 |
(4.0) |
| Result of Sectorial financial assets and liabilities |
199,893 |
362,227 |
(45) |
145,476 |
606,453 |
(76.0) |
| Other operating revenues |
117,741 |
106,740 |
10 |
245,560 |
282,927 |
(13.2) |
| OPERATING COSTS AND EXPENSES |
(4,611,582) |
(4,307,060) |
7 |
(9,075,134) |
(8,487,190) |
6.9 |
| Electricity purchased for resale |
(2,012,934) |
(1,877,592) |
7 |
(3,986,401) |
(3,698,567) |
7.8 |
| Charge of the main distribution and transmission grid |
(760,284) |
(677,178) |
12 |
(1,508,358) |
(1,353,636) |
11.4 |
| Personnel and management |
(284,823) |
(289,847) |
(2) |
(578,696) |
(702,548) |
(17.6) |
| Pension and healthcare plans |
(66,721) |
(65,618) |
2 |
(135,697) |
(129,929) |
4.4 |
| Materials and supplies |
(21,691) |
(20,547) |
6 |
(40,143) |
(41,254) |
(2.7) |
| Materials and supplies for power eletricity |
- |
(3,763) |
- |
(936) |
(10,479) |
(91.1) |
| Third-party services |
(253,965) |
(230,236) |
10 |
(498,066) |
(462,668) |
7.7 |
| Depreciation and amortization |
(356,155) |
(348,040) |
2 |
(720,783) |
(679,455) |
6.1 |
| Provisions and reversals |
(73,555) |
(74,689) |
(2) |
(159,576) |
(63,601) |
150.9 |
| Construction cost |
(672,725) |
(593,493) |
13 |
(1,243,649) |
(1,119,483) |
11.1 |
| Other cost and expenses |
(108,729) |
(126,057) |
(14) |
(202,829) |
(225,570) |
(10.1) |
| EQUITY IN EARNINGS OF SUBSIDIARIES |
80,545 |
72,745 |
11 |
162,188 |
176,833 |
(8.3) |
| PROFIT BEFORE FINANCIAL RESULTS AND TAXES |
948,229 |
865,909 |
10 |
1,983,318 |
2,057,424 |
(3.6) |
| FINANCIAL RESULTS |
(289,685) |
(247,245) |
17 |
(557,859) |
(576,479) |
(3.2) |
| Financial income |
274,376 |
300,019 |
(9) |
526,037 |
532,272 |
(1.2) |
| Financial expenses |
(564,061) |
(547,264) |
3 |
(1,083,896) |
(1,108,751) |
(2.2) |
| OPERATIONAL EXPENSES/ INCOME |
658,544 |
618,664 |
6 |
1,425,459 |
1,480,945 |
(3.7) |
| INCOME TAX AND SOCIAL CONTRIBUTION ON PROFIT |
(195,479) |
(169,089) |
16 |
(430,204) |
(401,220) |
7.2 |
| Income tax and social contribution on profit |
4,229 |
(180,771) |
(102) |
(142,437) |
(325,275) |
(56.2) |
| Deferred income tax and social contribution on profit |
(199,708) |
11,682 |
(1,810) |
(287,767) |
(75,945) |
278.9 |
| NET INCOME continuing operations |
463,065 |
449,575 |
3 |
995,255 |
1,079,725 |
(7.8) |
| NET INCOME discontinued operations |
10,509 |
(141,869) |
- |
11,862 |
(136,529) |
- |
| NET INCOME |
473,574 |
307,706 |
54 |
1,007,117 |
943,196 |
6.8 |
| Attributed to the controlling company's shareholders - continuing operations |
475,681 |
448,369 |
6 |
1,014,879 |
1,078,922 |
(5.9) |
| Attributed to the controlling company's shareholders - discontinued operations |
(3,599) |
(130,577) |
(97) |
(11,414) |
(134,540) |
(91.5) |
| Attributed to non-controlling shareholders- continuing operations |
(6,803) |
7,402 |
- |
(8,316) |
7,579 |
- |
| Attributed to non-controlling shareholders- discontinued operations |
8,295 |
(17,488) |
- |
11,968 |
(8,765) |
- |
| EBITDA continued operations |
1,304,384 |
1,213,949 |
7 |
2,704,101 |
2,736,879 |
(1.2) |
| Exhibit I - CONSOLIDATED RESULTS > BALANCE SHEET |
| R$'000 |
|
R$'000 |
| Assets |
Jun-24 |
Dec-23 |
Δ% |
|
Liabilities |
Jun-24 |
Dec-23 |
Δ% |
| CURRENT |
15,524,849 |
13,715,730 |
- 0.2 |
|
CURRENT |
9,912,187 |
9,309,433 |
5.8 |
| Cash and cash equivalents |
7,330,747 |
5,634,623 |
2.8 |
|
Payroll, social charges and accruals |
824,067 |
927,538 |
2.1 |
| Bonds and securities |
5,709 |
4,763 |
(41.7) |
|
Suppliers |
2,171,774 |
2,154,430 |
0.1 |
| Collaterals and escrow accounts |
9 |
9 |
- |
|
Income tax and social contribution payable |
51,798 |
132,979 |
(66.0) |
| Customers |
3,593,631 |
3,761,170 |
2.4 |
|
Other taxes due |
274,662 |
346,083 |
(10.9) |
| Dividends receivable |
63,780 |
95,569 |
(11.0) |
|
Loans and financing |
1,540,206 |
675,980 |
69.4 |
| Sectorial financial assets |
- |
15,473 |
- |
|
Debentures |
1,319,670 |
1,225,649 |
9.7 |
| Account receivable related to concession |
10,855 |
9,354 |
4.2 |
|
Minimum compulsory dividend payable |
9,097 |
464,147 |
(0.0) |
| Contract Assets |
269,656 |
284,616 |
(2.1) |
|
Post employment benefits |
96,364 |
85,833 |
12.7 |
| Other current receivables |
717,419 |
949,732 |
(19.2) |
|
Customer charges due |
50,598 |
61,466 |
2.2 |
| Inventories |
160,336 |
174,726 |
10.7 |
|
Research and development and energy efficiency |
206,426 |
320,196 |
(7.6) |
| Income tax and social contribution |
379,011 |
315,218 |
9.7 |
|
Accounts Payable related to concession |
102,040 |
101,976 |
(0.9) |
| Other current recoverable taxes |
1,125,532 |
943,343 |
(9.1) |
|
Net sectorial financial liabilities |
1,617,748 |
476,103 |
(11.0) |
| Prepaid expenses |
53,788 |
62,869 |
3.8 |
|
Lease liability |
56,921 |
49,742 |
6.0 |
| Related parties |
834 |
1,336 |
(39.8) |
|
Other accounts payable |
996,107 |
859,456 |
22.3 |
| Assets held for sale |
1,813,542 |
1,462,929 |
(1.5) |
|
PIS and COFINS to be refunded to costumers |
- |
558,591 |
38.4 |
| NON-CURRENT |
41,089,511 |
42,103,344 |
(0.8) |
|
Provision for allocation of Pis and Cofins credits |
- |
- |
- |
| Long Term Assets |
15,284,017 |
16,343,437 |
(2.9) |
|
Provisions for litigation |
- |
336,000 |
- |
| Bonds and securities |
481,693 |
490,732 |
6.1 |
|
Liabilities associated with assets held for sale |
594,709 |
533,264.0 |
(3.9) |
| Other temporary investments |
45,566 |
31,728 |
32.8 |
|
NON-CURRENT |
21,668,491 |
22,317,974 |
(6.4) |
| Customers |
91,396 |
105,259 |
(9.9) |
|
Suppliers |
130,695 |
131,143 |
- |
| Judicial deposits |
389,309 |
634,712 |
(38.5) |
|
Deferred income tax and social contribution |
1,688,691 |
1,686,793 |
1.1 |
| Sectoral financial assets |
72,043 |
15,473 |
- |
|
Other taxes due |
321,404 |
612,093 |
(45.3) |
| Account receivable related to concession |
3,103,699 |
2,809,901 |
5.3 |
|
Loans and financing |
3,661,899 |
4,667,237 |
(11.9) |
| Contract Assets |
7,332,654 |
7,320,445 |
(0.2) |
|
Debentures |
10,083,093 |
8,393,457 |
0.6 |
| Other non-current receivables |
552,294 |
853,340 |
(22.9) |
|
Post employment benefits |
1,406,433 |
1,398,410 |
(0.1) |
| Income tax and social contribution |
62,135 |
68,003 |
(9.3) |
|
Research and development and energy efficiency |
275,974 |
233,478 |
9.0 |
| Deferred income tax and social contribution |
1,471,920 |
1,757,688 |
(4.0) |
|
Accounts Payable related to concession |
791,121 |
791,879 |
(1.4) |
| Other non-current recoverable taxes |
1,681,308 |
2,256,156 |
(5.0) |
|
Net sectorial financial liabilities |
- |
27,888 |
236.3 |
| Investments |
3,522,478 |
3,511,797 |
(0.1) |
|
Lease liability |
278,672 |
220,700 |
11.5 |
| Property, plant and equipment, net |
10,340,564 |
10,825,421 |
(1.0) |
|
Other accounts payable |
370,258 |
579,070 |
(31.7) |
| Intangible assets |
11,628,289 |
11,170,089 |
2.1 |
|
PIS and COFINS to be refunded to costumers |
- |
173,135 |
- |
| Right to use an asset |
314,163 |
252,600 |
10.5 |
|
Provision for allocation of Pis and Cofins credits |
1,541,990 |
1,909,775 |
(3.3) |
| TOTAL |
56,614,360 |
55,819,074 |
(0.6) |
|
Provisions for litigation |
1,118,261 |
1,492,916 |
(23.1) |
| |
|
|
|
|
EQUITY |
25,033,682 |
24,191,667 |
2.2 |
| |
|
|
|
|
Attributed to controlling shareholders |
24,758,270 |
23,886,153 |
2.2 |
| |
|
|
|
|
Share capital |
12,821,758 |
12,821,758 |
- |
| |
|
|
|
|
Equity valuation adjustments |
289,982 |
307,050 |
(2.6) |
| |
|
|
|
|
Legal reserves |
1,625,628 |
1,625,628 |
- |
| |
|
|
|
|
Retained earnings |
9,000,506 |
9,000,506 |
- |
| |
|
|
|
|
Proposed additional dividend |
- |
131,211 |
- |
| |
|
|
|
|
Accrued earnings |
1,020,396 |
- |
- |
| |
|
|
|
|
Attributable to non-controlling interest |
275,412 |
305,514 |
0.7 |
| |
|
|
|
|
TOTAL |
56,614,360 |
55,819,074 |
(0.6) |
| Exhibit I - CONSOLIDATED RESULTS > CASH FLOW |
| |
|
R$'000 |
| |
06/30/24 |
06/30/23 |
| CASH FLOWS FROM OPERATIONAL ACTIVITIES |
| |
|
|
| Net income from continuing operations |
995,255 |
1,079,725 |
| |
|
|
| Adjustments to reconcile net income for the period with cash generation from operating activities: |
2,817,962 |
1,923,448 |
| Unrealized monetary and exchange variation and debt charges - net |
1,009,114 |
795,963 |
| Interest - bonus from the grant of concession agreements under the quota system |
(62,556) |
(62,359) |
| Remuneration of transmission concession contracts |
(385,277) |
(393,015) |
| Income tax and social contribution |
142,437 |
325,275 |
| Deferred income tax and social contribution |
287,767 |
75,945 |
| Equity in earnings of investees |
(162,188) |
(176,833) |
| Appropriation of post-employment benefits obligations |
131,006 |
129,500 |
| Creation for research and development and energy efficiency programs |
87,284 |
79,849 |
| Recognition of fair value of assets from the indemnity for the concession |
(32,277) |
(33,615) |
| Sectorial financial assets and liabilities result |
(160,304) |
(668,268) |
| Depreciation and amortization |
720,783 |
679,455 |
| Net operating estimated losses, provisions and reversals |
159,576 |
63,601 |
| Realization of added value in business combinations |
(362) |
(361) |
| Fair value in energy purchase and sale operations |
43,881 |
(28,177) |
| Loss on disposal of accounts receivable related to concession |
299 |
144 |
| Loss on disposal of contract assets |
6,684 |
5,147 |
| Loss on disposal of property, plant and equipment |
7,068 |
3,118 |
| Loss on disposal of intangible assets |
29,824 |
48,138 |
| Result of write-offs of use rights of assets and liabilities of leases - net |
(52) |
216 |
| |
|
|
| Decrease (increase) in assets |
698,494 |
544,162 |
| Trade accounts receivable |
553,950 |
395,430 |
| Dividends and interest on own capital received |
144,054 |
95,557 |
| Judicial deposits |
6,345 |
12,268 |
| Sectorial financial assets |
52,536 |
67,123 |
| Other receivables |
(20,805) |
(94,197) |
| Inventories |
14,390 |
(16,273) |
| Income tax and social contribution recoverable |
(101,352) |
(18,987) |
| Other taxes recoverable |
40,483 |
109,187 |
| Prepaid expenses |
8,391 |
(6,210) |
| Related parties |
502 |
264 |
| |
|
|
| Increase (decrease) in liabilities |
(565,053) |
(33,103) |
| Payroll, social charges and accruals |
(9,207) |
124,021 |
| Suppliers |
(21,301) |
(126,758) |
| Other taxes |
282,923 |
338,235 |
| Post-employment benefits |
(112,452) |
(108,328) |
| Sectorial charges due |
(10,868) |
14,478 |
| Research and development and energy efficiency |
(169,673) |
(96,911) |
| Payable related to the concession |
(54,979) |
(58,124) |
| Other accounts payable |
(311,691) |
15,793 |
| Provisions for legal claims |
(157,805) |
(135,509) |
| |
|
|
| CASH GENERATED BY OPERATING ACTIVITIES |
2,951,403 |
2,434,507 |
| |
|
|
| Income tax and social contribution paid |
(223,618) |
(310,381) |
| Loans and financing - interest due and paid |
(241,765) |
(271,476) |
| Debentures - interest due and paid |
(546,795) |
(455,091) |
| Charges for lease liabilities paid |
(14,801) |
(11,619) |
| |
|
|
| NET CASH GENERATED BY OPERATING ACTIVITIES FROM CONTINUING OPERATIONS |
1,924,424 |
1,385,940 |
| NET CASH GENERATED BY OPERATING ACTIVITIES FROM DISCONTINUED OPERATIONS |
(37,565) |
86,606 |
| NET CASH GENERATED FROM OPERATING ACTIVITIES |
1,886,859 |
1,472,546 |
| |
|
|
| CASH FLOWS FROM INVESTMENT ACTIVITIES |
| Financial investments |
(5,698) |
(59,897) |
| Additions to contract assets |
(1,128,187) |
(951,973) |
| Acquisitions of subsidiaries - effect on cash |
- |
(911,450) |
| Sale of investments |
2,066 |
- |
| Additions in investments |
- |
(10,780) |
| Capital reduction of investees |
37,129 |
- |
| Additions to property, plant and equipment |
(62,095) |
(114,137) |
| Additions to intangible assets |
(5,517) |
(4,710) |
| |
|
|
| NET CASH USED BY INVESTMENT ACTIVITIES FROM CONTINUING OPERATIONS |
(1,162,302) |
(2,052,947) |
| NET CASH USED BY INVESTMENT ACTIVITIES FROM DISCONTINUED OPERATIONS |
(15,791) |
(16,234) |
| NET CASH USED FROM INVESTING ACTIVITIES |
(1,178,093) |
(2,069,181) |
| |
|
|
| CASH FLOWS FROM FINANCING ACTIVITIES |
| Issue of loans and financing |
- |
31,303 |
| Issue of debentures |
2,320,000 |
2,900,000 |
| Transaction costs in the issuing of debentures |
(55,612) |
(18,889) |
| Payments of principal - loans and financing |
(131,999) |
(129,139) |
| Payments of principal - debentures |
(576,183) |
(25,321) |
| Amortization of principal of lease liabilities |
(33,840) |
(34,199) |
| Dividends and interest on own capital paid |
(586,261) |
(335,019) |
| |
|
|
| NET CASH GENERATED (USED) BY FINANCING ACTIVITIES FROM CONTINUING OPERATIONS |
936,105 |
2,388,736 |
| NET CASH GENERATED (USED) BY FINANCING ACTIVITIES FROM DISCONTINUED OPERATIONS |
(50,410) |
(23,074) |
| NET CASH GENERATED (USED) FROM FINANCING ACTIVITIES |
885,695 |
2,365,662 |
| |
|
|
| TOTAL EFFECTS ON CASH AND CASH EQUIVALENTS |
1,594,461 |
1,769,027 |
| |
|
|
| Cash and cash equivalents at the beginning of the period |
5,634,623 |
2,678,457 |
| Cash and cash equivalents at the end of the period |
7,330,747 |
4,274,138 |
| Change in cash and cash equivalents from discontinued operations |
(101,663) |
173,346 |
| |
|
|
| CHANGE IN CASH AND CASH EQUIVALENTS |
1,594,461 |
1,769,027 |
| Exhibit I - CONSOLIDATED RESULTS > ADJUSTED EBITDA AND FINANCIAL RESULT |
| |
|
|
|
R$'000 |
| |
2Q24 |
2Q23 |
Δ% |
1H24 |
1H23 |
Δ% |
| EBITDA FROM CONTINUING OPERATIONS |
1,304.4 |
1,214.0 |
7.4 |
2,704.1 |
2,736.9 |
(1.2) |
| (-/+) Fair value in the purchase and sale of energy |
31.0 |
22.1 |
40.3 |
43.9 |
(28.2) |
- |
| (-/+) Provision/Reversal of asset impairment |
(0.7) |
(1.0) |
(30.0) |
(1.9) |
(37.9) |
(95.0) |
| (-/+) Indemnity of adittional third of vacation bonus |
- |
- |
- |
- |
138.2 |
- |
| Adjusted EBITDA FROM CONTINUING OPERATIONS |
1,334.7 |
1,235.1 |
8.1 |
2,746.1 |
2,809.0 |
(2.2) |
| (-) Ebitda from discontinued Op. Compagas and UEGA |
17.2 |
44.7 |
(61.5) |
38.4 |
88.7 |
(57) |
| Adjusted EBITDA INCLUDED DISCONTINUED OPERATIONS |
1,351.9 |
1,279.8 |
5.6 |
2,784.5 |
2,897.7 |
(3.9) |
| (-/+) Equity in earnings of subsidiaries |
-80.5 |
-72.7 |
10.7 |
-162.2 |
-176.8 |
(8.3) |
| (-/+) VNR |
(13.3) |
(7.8) |
70.5 |
(32.3) |
(33.6) |
(3.9) |
| (-/+) Revenue Adjustment TRA IFRS/Regulatory |
22.2 |
12.5 |
77.6 |
20.0 |
(56.8) |
- |
| Adjusted EBITDA INCLUDED DISCONTINUED OP without earnings of subsidiaries, VNR and IFRS effect |
1,280.3 |
1,211.8 |
5.7 |
2,610.0 |
2,630.5 |
(0.8) |
| |
|
|
|
|
|
|
| |
|
|
|
|
|
|
| |
|
|
|
|
|
|
| Financial Revenues |
274,376 |
300,019 |
(8.5) |
526,037 |
532,272 |
(1.2) |
| Income from investments held for trading |
175,056 |
106,189 |
64.9 |
331,486 |
199,188 |
66.4 |
| Late fees on electricity bills |
56,277 |
58,077 |
(3.1) |
103,177 |
112,670 |
(8.4) |
| Monetary restatement and adjustment to present value of accounts payable related to concession |
492 |
48,801 |
(99.0) |
17,074 |
56,176 |
(69.6) |
| Income from sectorial assets and liabilities |
31,272 |
20,710 |
51.0 |
35,514 |
45,905 |
(22.6) |
| Exchange variation About Purchase Itaipu Electric Power |
(632) |
9,776 |
- |
574 |
13,114 |
(95.6) |
| Interest on taxes to be compensated |
8,334 |
16,238 |
(48.7) |
18,442 |
33,553 |
(45.0) |
| Income and monetary restatement of judicial deposits |
7,090 |
12,298 |
(42.3) |
16,257 |
28,277 |
(42.5) |
| Other financial revenues |
7,918 |
38,943 |
(79.7) |
24,704 |
62,879 |
(60.7) |
| (-) Pis/Pasep and Cofins on revenues |
(11,431) |
(11,013) |
3.8 |
(21,191) |
(19,490) |
8.7 |
| Financial Expenses |
|
|
|
|
|
|
| Monetary variation, foreign exchange and debt service charges |
(405,671) |
(445,134) |
(8.9) |
(832,692) |
(912,083) |
(8.7) |
| Monetary variation and adjustment to present value of accounts payable related to concession |
(39,786) |
(32,958) |
20.7 |
(72,185) |
(67,783) |
6.5 |
| Exchange variation About Purchase Itaipu Electric Power |
(11,873) |
(899) |
- |
(14,326) |
(1,712) |
- |
| Pis/ Pasep and Cofins taxes over interest on equity |
(22,262) |
(1,258) |
- |
(27,812) |
(1,258) |
- |
| Income from sectorial assets and liabilities |
(28,598) |
(1,324) |
- |
(33,027) |
(2,929) |
- |
| Interest on R&D and PEE |
(5,882) |
(6,492) |
(9.4) |
(11,115) |
(13,551) |
(18.0) |
| Interest on tax installments |
(6,913) |
(10,318) |
(33.0) |
(14,463) |
(20,879) |
(30.7) |
| Interest on lease liabilities |
(7,692) |
(6,239) |
23.3 |
(14,780) |
(11,642) |
27.0 |
| Monetary variation of litigation |
(14,620) |
- |
- |
(31,346) |
- |
- |
| Other financial expenses |
(17,019) |
(6,826) |
149.3 |
(27,421) |
(15,422) |
77.8 |
| Uptade of provision for allocation of Pis and Cofins credits |
(3,745) |
(35,816) |
(89.5) |
(4,729) |
(61,492) |
(92.3) |
| Financial income (expenses) |
(289,685) |
(247,245) |
17.2 |
(557,859) |
(576,479) |
(3.2) |
| Exhibit I - CONSOLIDATED RESULTS > EQUITY IN EARNINGS OF SUBSIDIARIES AND INDICATORS |
| |
|
|
|
|
|
|
|
R$'000 |
| Variation in Equity in earnings of subsidiaries |
|
2Q24 |
2Q23 |
Δ% |
1H24 |
1H23 |
Δ% |
| Joint Ventures |
|
|
76,554 |
67,129 |
14.0 |
154,021 |
166,024 |
(7.2) |
| Voltalia São Miguel do Gostoso I Participações S.A. |
|
|
(607) |
(1,284) |
(52.7) |
(4,845) |
(2,525) |
91.9 |
| Caiuá Transmissora de Energia S.A. |
|
|
2,996 |
2,675 |
12.0 |
6,413 |
6,731 |
(4.7) |
| Integração Maranhense Transmissora de Energia S.A. |
|
|
4,773 |
5,381 |
(11.3) |
9,764 |
14,831 |
(34.2) |
| Matrinchã Transmissora de Energia (TP NORTE) S.A. |
|
|
24,973 |
18,823 |
32.7 |
47,347 |
45,772 |
3.4 |
| Guaraciaba Transmissora de Energia (TP SUL) S.A. |
|
|
9,629 |
7,299 |
31.9 |
22,535 |
19,391 |
16.2 |
| Paranaíba Transmissora de Energia S.A. |
|
|
7,408 |
14,271 |
(48.1) |
15,394 |
23,623 |
(34.8) |
| Mata de Santa Genebra Transmissão S.A. |
|
|
16,874 |
10,737 |
57.2 |
34,377 |
33,045 |
4.0 |
| Cantareira Transmissora de Energia S.A. |
|
|
10,481 |
9,112 |
15.0 |
22,957 |
24,928 |
(7.9) |
| Solar Paraná |
|
|
27 |
115 |
(76.5) |
79 |
228 |
(65.4) |
| Associates |
|
|
3,991 |
5,616 |
(28.9) |
8,167 |
10,809 |
(24.4) |
| Dona Francisca Energética S.A. |
|
|
1,042 |
1,485 |
(29.8) |
2,522 |
2,518 |
0.2 |
| Foz do Chopim Energética Ltda. |
|
|
2,949 |
4,132 |
(28.6) |
5,647 |
8,293 |
(31.9) |
| Others ¹ |
|
|
- |
(1) |
(100.0) |
(2) |
(2) |
- |
| TOTAL |
|
|
80,545 |
72,745 |
10.7 |
162,188 |
176,833 |
(8.3) |
| 1 Includes Carbocampel S.A. |
|
|
|
|
|
| |
|
|
|
|
|
|
|
|
| |
|
|
|
|
|
|
|
R$'000 |
| Main Indicators -Associates Jun-24 |
|
|
|
|
Dona Francisca |
Foz do Chopim |
| Total assets |
|
|
|
|
|
174,450 |
|
44,020 |
| Shareholder’s equity¹ |
|
|
|
|
|
144,738 |
|
42,338 |
| Net operating revenue |
|
|
|
|
|
33,301 |
|
22,295 |
| Net Income |
|
|
|
|
|
10,951 |
|
15,792 |
| Participation in the enterprise - % |
|
|
|
|
|
23.0 |
|
35.8 |
| Investment book value |
|
|
|
|
|
33,334 |
|
15,142 |
| |
|
|
|
|
|
|
|
R$'000 |
Main Indicators -Joint ventures
Jun-24 |
Voltalia |
Caiuá |
Integração Maranhense |
Matrinchã |
Guaraciaba |
Paranaíba |
Mata de Santa Genebra |
Cantareira |
| Total assets |
230,022 |
341,710 |
611,297 |
2,981,351 |
1,632,928 |
2,073,187 |
3,709,408 |
1,854,677 |
| Shareholder’s equity¹ |
229,873 |
276,136 |
426,047 |
2,064,230 |
1,050,243 |
1,247,864 |
1,382,080 |
973,526 |
| Net operating revenue |
- |
18,786 |
31,204 |
163,357 |
89,499 |
120,279 |
217,623 |
92,777 |
| Net Income |
(9,987) |
13,089 |
19,925 |
96,622 |
45,991 |
62,833 |
68,617 |
46,851 |
| Participation in the enterprise - % |
49.0 |
49.0 |
49.0 |
49.0 |
49.0 |
24.5 |
50.1 |
49.0 |
| Investment book value |
112,639 |
135,306 |
208,763 |
1,011,472 |
514,618 |
305,727 |
692,421 |
477,028 |
| Note: Income from Transmitters according to adjustments for the application of CPC 47 / IFRS 15 in the Corporate Statements. |
| Exhibit I - CONSOLIDATED RESULTS > SHARE CAPITAL |
| Share Capital - As of June, 30,2024 * |
| |
|
|
|
|
|
|
|
|
Thousand shares |
| Shareholders |
Common |
% |
Preferred "A" |
% |
Preferred "B" |
% |
Special ** |
TOTAL |
% |
| State of Paraná |
358,563 |
27.6% |
- |
- |
116,081 |
6.9% |
<1 |
474,644 |
15.9% |
| BNDESPAR |
131,162 |
10.1% |
- |
- |
524,646 |
31.2% |
- |
655,808 |
22.0% |
| Free Floating |
807,503 |
62.1% |
695 |
22.2% |
1,037,634 |
61.8% |
- |
1,845,832 |
61.9% |
| B3 |
788,689 |
60.7% |
695 |
22.2% |
946,399 |
56.4% |
- |
1,735,783 |
58.2% |
| NYSE |
18,605 |
1.4% |
- |
- |
89,498 |
5.3% |
- |
108,103 |
3.6% |
| LATIBEX |
208 |
0.0% |
- |
- |
1,737 |
0.1% |
- |
1,945 |
0.1% |
| Other |
3,120 |
0.2% |
2,433 |
77.8% |
974 |
0.1% |
- |
6,527 |
0.2% |
| TOTAL |
1,300,347 |
100% |
3,128 |
100% |
1,679,335 |
100% |
<1 |
2,982,810 |
100% |
| * The 209th Extraordinary General Assembly approved the undoing of the UNITS Program, ending in December/23. |
| ** State of Paraná has a special class preferred share with veto power as established in the Statute. |
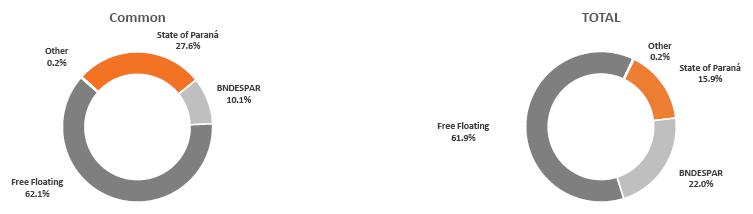
| Exhibit II- RESULT BY SUBSIDIARY > COPEL GET (CONSOLIDATED) |
| |
|
|
|
R$'000 |
| Income Statement |
2Q24 |
2Q23 |
Δ% |
1H24 |
1H23 |
Δ% |
| OPERATING REVENUES |
1,085,417 |
1,192,037 |
(8.9) |
2,214,417 |
2,537,896 |
(12.7) |
| Electricity sales to final customers |
- |
9 |
- |
- |
- |
- |
| Electricity sales to distributors |
815,440 |
938,402 |
(13.1) |
1,662,648 |
1,946,084 |
(14.6) |
| Use of the main transmission grid |
243,224 |
212,736 |
14.3 |
503,860 |
505,775 |
(0.4) |
| Construction revenue |
18,975 |
33,202 |
(42.9) |
29,874 |
71,594 |
(58.3) |
| Other operating revenues |
7,778 |
7,688 |
1.2 |
18,035 |
14,443 |
24.9 |
| OPERATING COSTS AND EXPENSES |
(624,035) |
(706,883) |
(11.7) |
(1,263,084) |
(1,340,181) |
(5.8) |
| Electricity purchased for resale |
(15,810) |
(53,956) |
(70.7) |
(45,640) |
(71,973) |
(36.6) |
| Charges of main distribution and transmission grid |
(148,408) |
(153,178) |
(3.1) |
(294,888) |
(295,796) |
(0.3) |
| Personnel and management |
(95,003) |
(95,846) |
(0.9) |
(190,755) |
(225,839) |
(15.5) |
| Pension and healthcare plans |
(20,423) |
(20,610) |
(0.9) |
(41,431) |
(40,867) |
1.4 |
| Materials and supplies |
(4,577) |
(4,630) |
(1.1) |
(8,527) |
(8,924) |
(4.4) |
| Materials and supplies for power eletricity |
0 |
(4,281) |
- |
(936) |
(10,997) |
(91.5) |
| Third-party services |
(68,611) |
(71,128) |
(3.5) |
(133,523) |
(134,178) |
(0.5) |
| Depreciation and amortization |
(206,559) |
(209,008) |
(1.2) |
(420,055) |
(405,563) |
3.6 |
| Provisions and reversals |
(9,582) |
(11,880) |
(19.3) |
(6,138) |
20,685 |
- |
| Construction cost |
(17,378) |
(25,590) |
(32.1) |
(25,554) |
(61,603) |
(58.5) |
| Other cost and expenses |
(37,683) |
(56,776) |
(33.6) |
(95,637) |
(105,126) |
(9.0) |
| EQUITY IN EARNINGS OF SUBSIDIARIES |
80,080 |
72,427 |
10.6 |
164,433 |
176,613 |
(6.9) |
| PROFIT BEFORE FINANCIAL RESULTS AND TAXES |
541,462 |
557,581 |
(2.9) |
1,115,766 |
1,374,328 |
(18.8) |
| FINANCIAL RESULTS |
(146,397) |
(200,394) |
(26.9) |
(313,332) |
(420,584) |
(25.5) |
| Financial income |
88,531 |
88,591 |
(0.1) |
169,059 |
172,383 |
(1.9) |
| Financial expenses |
(234,928) |
(288,985) |
(18.7) |
(482,391) |
(592,967) |
(18.6) |
| OPERATIONAL EXPENSES/ INCOME |
395,065 |
357,187 |
10.6 |
802,434 |
953,744 |
(15.9) |
| INCOME TAX AND SOCIAL CONTRIBUTION ON PROFIT |
(29,980) |
(101,826) |
(70.6) |
(130,782) |
(264,770) |
(50.6) |
| Income tax and social contribution on profit |
(33,848) |
(116,033) |
(70.8) |
(114,413) |
(220,578) |
(48.1) |
| Deferred income tax and social contribution on profit |
3,868 |
14,207 |
(72.8) |
(16,369) |
(44,192) |
(63.0) |
| NET INCOME continuing operations |
365,085 |
255,361 |
43.0 |
671,652 |
688,974 |
(2.5) |
| NET INCOME discontinued operations |
(15,598) |
(175,653) |
(91.1) |
(30,381) |
(196,305) |
(84.5) |
| NET INCOME |
349,487 |
79,708 |
- |
641,271 |
492,669 |
30.2 |
| Attributed to shareholders of the parent company - continuing operations |
369,326 |
262,035 |
40.9 |
680,008 |
696,160 |
(2.3) |
| Attributed to the controlling company's shareholders - discontinued operations |
(12,081) |
(111,039) |
- |
(23,590) |
123,927 |
- |
| Attributed to non-controlling shareholders |
(7,758) |
(71,288) |
(89.1) |
(15,147) |
(79,564) |
(81.0) |
| EBITDA continuing operations |
748,021 |
766,589 |
(2.4) |
1,535,821 |
1,779,891 |
(13.7) |
| Exhibit II- RESULT BY SUBSIDIARY > COPEL DIS |
| |
|
|
|
R$'000 |
| Income Statement |
2Q24 |
2Q23 |
Δ% |
1H24 |
1H23 |
Δ% |
| OPERATING REVENUES |
4,152,740 |
3,629,900 |
14.4 |
8,203,702 |
7,161,541 |
14.6 |
| Electricity sales to final customers |
1,614,345 |
1,278,339 |
26.3 |
3,353,705 |
2,602,677 |
28.9 |
| Electricity sales to distributors |
17,306 |
58,326 |
(70.3) |
21,217 |
92,441 |
(77.0) |
| Use of the main distribution grid |
1,543,033 |
1,233,874 |
25.1 |
3,206,058 |
2,534,866 |
26.5 |
| Construction revenue |
655,347 |
567,903 |
15.4 |
1,218,095 |
1,057,880 |
15.1 |
| Fair value of assets from the indemnity for the concession |
13,307 |
7,880 |
68.9 |
32,277 |
33,615 |
(4.0) |
| Sectorial assets and liabilities result |
199,893 |
362,226 |
(44.8) |
145,476 |
606,452 |
(76.0) |
| Other operating revenues |
109,509 |
121,352 |
(9.8) |
22,684 |
233,610 |
(90.3) |
| OPERATING COSTS AND EXPENSES |
(3,713,158) |
(3,320,744) |
11.8 |
(7,269,861) |
(6,559,513) |
10.8 |
| Electricity purchased for resale |
(1,672,490) |
(1,496,129) |
11.8 |
(3,312,163) |
(2,960,886) |
11.9 |
| Charges of main transmission grid |
(724,630) |
(615,533) |
17.7 |
(1,437,765) |
(1,240,661) |
15.9 |
| Personnel and management |
(168,358) |
(177,637) |
(5.2) |
(348,215) |
(438,449) |
(20.6) |
| Pension and healthcare plans |
(43,135) |
(42,159) |
2.3 |
(87,999) |
(83,704) |
5.1 |
| Materials and supplies |
(16,675) |
(15,753) |
5.9 |
(30,617) |
(31,713) |
(3.5) |
| Third-party services |
(169,585) |
(149,079) |
13.8 |
(331,284) |
(304,255) |
8.9 |
| Depreciation and amortization |
(139,853) |
(128,816) |
8.6 |
(281,343) |
(253,179) |
11.1 |
| Provisions and reversals |
(60,019) |
(59,687) |
0.6 |
(141,211) |
(77,297) |
82.7 |
| Construction cost |
(655,347) |
(567,903) |
15.4 |
(1,218,095) |
(1,057,880) |
15.1 |
| Other cost and expenses |
(63,066) |
(68,047) |
(7.3) |
(81,169) |
(111,489) |
(27.2) |
| PROFIT BEFORE FINANCIAL RESULTS AND TAXES |
439,582 |
309,157 |
42.2 |
933,841 |
602,028 |
55.1 |
| FINANCIAL RESULTS |
(135,269) |
(93,260) |
45.0 |
(278,586) |
(205,795) |
35.4 |
| Financial income |
120,457 |
138,693 |
(13.1) |
204,906 |
254,313 |
(19.4) |
| Financial expenses |
(255,726) |
(231,953) |
10.2 |
(483,492) |
(460,108) |
5.1 |
| OPERATIONAL EXPENSES/ INCOME |
304,313 |
215,897 |
41.0 |
655,255 |
396,233 |
65.4 |
| INCOME TAX AND SOCIAL CONTRIBUTION ON PROFIT |
(96,408) |
(54,368) |
77.3 |
(205,470) |
(95,013) |
116.3 |
| Income tax and social contribution on profit |
53,350 |
(50,294) |
- |
- |
(76,614) |
- |
| Deferred income tax and social contribution on profit |
(149,758) |
(4,073) |
- |
(205,470) |
(18,399) |
- |
| NET INCOME (LOSS) |
207,905 |
161,530 |
28.7 |
449,785 |
301,220 |
49.3 |
| EBITDA |
579,436 |
437,974 |
32.3 |
1,215,183 |
855,207 |
42.1 |
| Exhibit II- RESULT BY SUBSIDIARY > COPEL DIS |
| |
|
|
|
R$'000 |
| OPERATING REVENUE |
2Q24 |
2Q23 |
Δ% |
1H24 |
1H23 |
Δ% |
| Electricity sales to final customers |
1,921,474 |
1,491,588 |
28.8 |
4,015,104 |
3,070,825 |
30.7 |
| Residential |
878,605 |
650,862 |
35.0 |
1,869,684 |
1,350,116 |
38.5 |
| Industrial |
181,577 |
172,311 |
5.4 |
353,781 |
335,035 |
5.6 |
| Commercial, service and other activities |
455,722 |
354,754 |
28.5 |
954,547 |
739,066 |
29.2 |
| Rural |
205,910 |
148,947 |
38.2 |
431,760 |
318,899 |
35.4 |
| Public Sector |
74,366 |
53,659 |
38.6 |
148,965 |
106,634 |
39.7 |
| Street lightining |
45,356 |
42,907 |
5.7 |
91,519 |
85,295 |
7.3 |
| Public Service |
79,938 |
68,148 |
17.3 |
164,848 |
135,780 |
21.4 |
| Donations and subsidies |
286,103 |
233,945 |
22.3 |
543,334 |
424,777 |
27.9 |
| Electricity sales to distributors |
18,319 |
60,863 |
(69.9) |
22,743 |
96,536 |
(76.4) |
| Bilateral contracts |
6,153 |
5,658 |
8.7 |
12,403 |
10,220 |
21.4 |
| Electricity Trading Chamber - CCEE |
12,166 |
55,205 |
(78.0) |
10,340 |
86,316 |
- |
| Use of the main distribution grid |
2,912,381 |
2,434,537 |
19.6 |
5,954,739 |
4,727,185 |
26.0 |
| Residential |
944,563 |
762,696 |
23.8 |
2,005,660 |
1,504,958 |
33.3 |
| Industrial |
324,910 |
288,885 |
12.5 |
626,699 |
455,972 |
37.4 |
| Commercial, service and other activities |
540,627 |
451,875 |
19.6 |
1,123,573 |
866,825 |
29.6 |
| Rural |
227,219 |
181,202 |
25.4 |
471,549 |
375,732 |
25.5 |
| Public Sector |
83,406 |
64,845 |
28.6 |
166,049 |
125,423 |
32.4 |
| Street lightining |
49,855 |
50,460 |
(1.2) |
100,008 |
97,835 |
2.2 |
| Public Service |
66,557 |
60,403 |
10.2 |
136,884 |
114,702 |
19.3 |
| Free Market |
635,764 |
544,375 |
16.8 |
1,245,095 |
1,124,600 |
10.7 |
| Dealers and generators |
39,480 |
29,796 |
32.5 |
79,222 |
61,138 |
29.6 |
| Construction Revenue |
655,347 |
567,903 |
15.4 |
1,218,095 |
1,057,880 |
15.1 |
| Fair value of assets from the indemnity for the concession |
13,307 |
7,880 |
68.9 |
32,277 |
33,614 |
(4.0) |
| Sectorial assets and liabilities result |
220,268 |
399,147 |
(44.8) |
160,304 |
668,267 |
(76.0) |
| Other operating income |
120,026 |
133,732 |
(10.2) |
249,997 |
258,394 |
(3.2) |
| Leases and rentals |
122,891 |
112,895 |
8.9 |
241,199 |
225,753 |
6.8 |
| Income from the provision of services |
72 |
4,257 |
- |
1,754 |
5,752 |
(69.5) |
| Other income |
(2,937) |
16,580 |
- |
7,044 |
26,889 |
(73.8) |
| RECEITA OPERACIONAL BRUTA |
6,147,225 |
5,329,595 |
15.3 |
12,196,593 |
10,337,478 |
18.0 |
| (-) Tributos e deduções |
(1,994,485) |
(1,699,694) |
17.3 |
(3,992,891) |
(3,175,937) |
25.7 |
| (-) PIS/PASEP e COFINS |
(429,826) |
(378,212) |
13.6 |
(862,139) |
(754,443) |
14.3 |
| (-) ICMS |
(824,833) |
(635,690) |
29.8 |
(1,641,458) |
(1,063,154) |
54.4 |
| (-) Encargos Setoriais |
(739,826) |
(685,793) |
7.9 |
(1,489,294) |
(1,358,327) |
9.6 |
| (-) ISS |
- |
- |
- |
- |
(13) |
(100.0) |
| NET OPERATING REVENUES |
4,152,740 |
3,629,900 |
14.4 |
8,203,702 |
7,161,541 |
14.6 |
| Exhibit II- RESULT BY SUBSIDIARY > COPEL COM (MERCADO LIVRE) |
| |
|
|
|
R$'000 |
| Income Statement |
2Q24 |
2Q23 |
Δ% |
1H24 |
1H23 |
Δ% |
| OPERATING REVENUES |
829,344 |
915,223 |
(9.4) |
1,688,995 |
2,031,875 |
(16.9) |
| Electricity sales to final customers |
465,499 |
547,594 |
(15.0) |
931,968 |
1,127,801 |
(17.4) |
| Electricity sales to distributors |
363,523 |
389,430 |
(6.7) |
756,276 |
868,733 |
(12.9) |
| Other operating revenues |
322 |
(21,801) |
- |
751 |
35,341 |
(97.9) |
| OPERATING COSTS AND EXPENSES |
(825,946) |
(905,322) |
(8.8) |
(1,668,215) |
(1,923,546) |
(13.3) |
| Electricity purchased for resale |
(817,736) |
(897,232) |
(8.9) |
(1,651,299) |
(1,906,014) |
(13.4) |
| Personnel and management |
(3,895) |
(3,641) |
7.0 |
(7,561) |
(9,112) |
(17.0) |
| Pension and healthcare plans |
(441) |
(471) |
(6.3) |
(892) |
(981) |
(9.0) |
| Materials and supplies |
(17) |
(24) |
(30.6) |
(34) |
(33) |
3.6 |
| Third-party services |
(1,661) |
(1,638) |
1.4 |
(2,406) |
(2,140) |
12.4 |
| Depreciation and amortization |
(430) |
(416) |
3.4 |
(870) |
(1,130) |
(23.0) |
| Provisions and reversals |
(1,368) |
(784) |
74.5 |
(2,589) |
(1,249) |
107.3 |
| Other cost and expenses |
(397) |
(1,115) |
(64.4) |
(2,563) |
(2,887) |
(11.2) |
| PROFIT BEFORE FINANCIAL RESULTS AND TAXES |
3,398 |
9,901 |
(65.7) |
20,780 |
108,329 |
(80.8) |
| FINANCIAL RESULTS |
10,336 |
9,338 |
10.7 |
19,298 |
17,885 |
7.9 |
| Financial income |
10,406 |
9,406 |
10.6 |
19,435 |
18,037 |
7.8 |
| Financial expenses |
(70) |
(68) |
3.1 |
(137) |
(152) |
(9.8) |
| OPERATIONAL EXPENSES/ INCOME |
13,734 |
19,239 |
(28.6) |
40,078 |
126,214 |
(68.2) |
| INCOME TAX AND SOCIAL CONTRIBUTION ON PROFIT |
(4,529) |
(1,905) |
137.8 |
(13,313) |
(38,376) |
(65.3) |
| Income tax and social contribution on profit |
(15,209) |
(6,778) |
124.4 |
(27,830) |
(20,416) |
36.3 |
| Deferred income tax and social contribution on profit |
10,680 |
4,873 |
119.2 |
14,517 |
(17,960) |
- |
| NET INCOME (LOSS) |
9,205 |
17,334 |
(46.9) |
26,765 |
87,838 |
(69.5) |
| EBITDA |
3,828 |
10,317 |
(62.9) |
21,650 |
109,459 |
(80.2) |
| Exhibit II- RESULT BY SUBSIDIARY > INCOME STATEMENT FOR THE QUARTER BY COMPANY |
| R$'000 |
| Income
Statement 2Q24 |
GET |
Distribuição |
Compagas |
Elejor |
UEG
Araucária |
Serviços |
Wind
Farms |
FDA |
Bela
Vista |
C.
Oeste, Marumbi, Uirapuru |
Mercado
Livre |
Holding |
Elimination |
Consolidated |
| Geração |
Transmissão |
| NET
OPERATING INCOME |
517,832 |
251,096 |
4,152,740 |
5,264 |
23,266 |
- |
173 |
181,255 |
123,305 |
8,580 |
20,416 |
829,345 |
- |
(634,005) |
5,479,266 |
| Electricity
sales to final customers |
- |
- |
1,614,345 |
- |
- |
- |
- |
- |
- |
- |
- |
465,500 |
- |
(376) |
2,079,469 |
| Electricity
sales to distributors |
502,890 |
- |
17,305 |
- |
23,042 |
- |
- |
180,669 |
123,302 |
8,580 |
- |
363,523 |
- |
(492,704) |
726,606 |
| Use
of the main distribution and transmission grid (TUSD/ TUST) |
- |
224,387 |
1,543,034 |
- |
- |
- |
- |
- |
- |
- |
21,403 |
- |
- |
(120,896) |
1,667,928 |
| Construction
revenue |
- |
19,969 |
655,347 |
5,264 |
- |
- |
- |
- |
- |
- |
(994) |
- |
- |
(5,264) |
674,322 |
| Fair
value of assets from the indemnity for the concession |
- |
- |
13,307 |
- |
- |
- |
- |
- |
- |
- |
- |
- |
- |
- |
13,307 |
| Distribution
of piped gas |
- |
- |
- |
- |
- |
- |
- |
- |
- |
- |
- |
- |
- |
- |
- |
| Sectoral
assets and liabilities result |
- |
- |
199,893 |
- |
- |
- |
- |
- |
- |
- |
- |
- |
- |
- |
199,893 |
| Other
operating revenues |
14,942 |
6,740 |
109,509 |
- |
224 |
- |
173 |
586 |
2 |
- |
7 |
323 |
- |
(14,766) |
117,741 |
| OPERATING
COSTS AND EXPENSES |
(299,576) |
(90,278) |
(3,713,155) |
(187,878) |
(22,690) |
(22,520) |
(1,359) |
(145,944) |
(93,914) |
(4,454) |
(1,281) |
(825,946) |
(52,059) |
849,475 |
(4,611,582) |
| Energy
purchased for resale |
(1,729) |
- |
(1,672,490) |
- |
(28) |
- |
- |
(12,720) |
(953) |
(408) |
- |
(817,736) |
- |
493,130 |
(2,012,934) |
| Charges
of the main distribution and transmission grid |
(93,329) |
- |
(724,630) |
- |
(6,300) |
(9,362) |
- |
(16,562) |
(40,545) |
(344) |
- |
- |
- |
130,785 |
(760,284) |
| Personnel
and management |
(52,569) |
(37,705) |
(168,357) |
(12,968) |
(1,477) |
(1,674) |
(43) |
(3,854) |
(549) |
(146) |
(178) |
(3,895) |
(16,051) |
14,642 |
(284,823) |
| Private
pension and health plans |
(11,503) |
(8,210) |
(43,135) |
(1,523) |
(42) |
(174) |
(7) |
(578) |
(83) |
(22) |
(26) |
(440) |
(2,674) |
1,697 |
(66,721) |
| Materials
and supplies |
(2,388) |
(970) |
(16,675) |
242 |
(11) |
(13) |
(0) |
(826) |
(335) |
(19) |
(41) |
(17) |
(408) |
(229) |
(21,691) |
| Materials
and supplies for power eletricity |
- |
- |
- |
- |
- |
(518) |
- |
- |
- |
- |
- |
- |
- |
518 |
- |
| Natural
gas and supplies for gas business |
- |
- |
- |
(146,628) |
- |
- |
- |
- |
- |
- |
- |
- |
- |
146,628 |
- |
| Third-party
services |
(23,173) |
(12,608) |
(169,584) |
(5,048) |
(4,243) |
(4,856) |
(837) |
(32,517) |
(9,263) |
(748) |
(1,721) |
(1,661) |
(10,030) |
22,323 |
(253,965) |
| Depreciation
and amortization |
(91,530) |
(3,774) |
(139,853) |
(11,125) |
(8,031) |
(5,158) |
(480) |
(69,096) |
(31,955) |
(2,846) |
(11) |
(430) |
(798) |
8,933 |
(356,155) |
| Provisions
and reversals |
(8,502) |
(6,273) |
(60,018) |
(2,247) |
- |
(1) |
- |
(118) |
0 |
241 |
(7) |
(1,368) |
(18,637) |
23,375 |
(73,555) |
| Construction
cost |
- |
(18,372) |
(655,347) |
(5,264) |
- |
- |
- |
- |
- |
- |
994 |
- |
- |
5,264 |
(672,725) |
| Other
operating costs and expenses |
(14,853) |
(2,366) |
(63,067) |
(3,317) |
(2,558) |
(764) |
8 |
(9,674) |
(10,233) |
(162) |
(290) |
(398) |
(3,459) |
2,409 |
(108,729) |
| EQUITY
IN EARNINGS OF SUBSIDIARIES |
17,610 |
100,121 |
- |
- |
- |
- |
- |
(1,383) |
- |
- |
- |
- |
586,192 |
(621,994) |
80,545 |
| EARNINGS
BEFORE INCOME TAXES |
235,866 |
260,939 |
439,585 |
19,858 |
576 |
(22,520) |
(1,186) |
33,929 |
29,390 |
4,126 |
19,135 |
3,399 |
534,133 |
(608,996) |
948,229 |
| FINANCIAL
RESULTS |
(75,560) |
(51,717) |
(135,269) |
6,469 |
(34,325) |
(2,474) |
512 |
(29,626) |
8,125 |
1,093 |
1,966 |
10,336 |
16,966 |
(6,185) |
(289,685) |
| Financial
income |
28,481 |
17,821 |
120,457 |
19,670 |
4,131 |
406 |
629 |
31,124 |
8,268 |
1,036 |
2,481 |
10,406 |
52,035 |
(22,570) |
274,376 |
| Financial
expenses |
(104,041) |
(69,538) |
(255,726) |
(13,201) |
(38,456) |
(2,880) |
(117) |
(60,750) |
(143) |
57 |
(515) |
(70) |
(35,068) |
16,385 |
(564,061) |
| OPERATIONAL
EXPENSES / INCOME |
160,306 |
209,222 |
304,316 |
26,327 |
(33,750) |
(24,994) |
(674) |
4,303 |
37,515 |
5,219 |
21,101 |
13,735 |
551,099 |
(615,182) |
658,544 |
| INCOME
TAX AND SOCIAL CONTRIBUTION ON PROFIT |
(1,300) |
1,100 |
(96,409) |
(9,142) |
11,078 |
- |
(217) |
(15,611) |
(12,748) |
(621) |
(1,507) |
(4,530) |
(75,421) |
9,849 |
(195,479) |
| NET
INCOME continuing operations |
159,006 |
210,322 |
207,907 |
17,186 |
(22,672) |
(24,994) |
(891) |
(11,309) |
24,768 |
4,598 |
19,594 |
9,205 |
475,678 |
(605,333) |
463,065 |
| NET
INCOME discontinued operations |
(12,081) |
- |
- |
- |
- |
- |
- |
- |
- |
- |
- |
- |
(3,599) |
26,189 |
10,509 |
| NET
INCOME |
146,925 |
210,322 |
207,907 |
17,186 |
(22,672) |
(24,994) |
(891) |
(11,309) |
24,768 |
4,598 |
19,594 |
9,205 |
472,079 |
(579,144) |
473,574 |
| Attributed
to shareholders of the parent company - continuing operations |
159,005 |
210,322 |
207,907 |
- |
(15,870) |
- |
(891) |
(11,309) |
24,768 |
4,598 |
19,594 |
9,205 |
463,597 |
(595,244) |
475,681 |
| Attributed
to the controlling company's shareholders - discontinued operations |
(12,080) |
- |
- |
8,765 |
- |
(20,295) |
- |
- |
- |
- |
- |
- |
8,483 |
11,529 |
(3,599) |
| Attributed to non-controlling
shareholders - continuing operations |
- |
- |
- |
- |
(6,803) |
- |
- |
- |
- |
- |
- |
- |
- |
- |
(6,803) |
| Attributed to non-controlling shareholders -
discontinued operations |
- |
- |
- |
8,421 |
- |
(4,699) |
- |
- |
- |
- |
- |
- |
- |
4,573 |
8,295 |
| EBITDA
continuing operations |
327,396 |
264,713 |
579,437 |
30,983 |
8,607 |
(17,362) |
(706) |
103,025 |
61,345 |
6,972 |
19,146 |
3,829 |
534,931 |
(617,930) |
1,304,384 |
| |
|
|
|
|
|
|
|
|
|
|
|
|
|
|
|
| R$'000 |
| Income
Statement 2Q23 |
GET |
Distribuição |
Compagas |
Elejor |
UEG
Araucária |
Serviços |
Wind
Farms |
FDA |
Bela
Vista |
C.
Oeste, Marumbi, Uirapuru |
Mercado
Livre |
Holding |
Elimination |
Consolidated |
| Geração |
Transmissão |
| NET OPERATING
INCOME |
562,635 |
244,823 |
3,629,900 |
259,932 |
34,222 |
- |
- |
206,235 |
177,682 |
7,868 |
9,967 |
915,223 |
- |
(948,265) |
5,100,224 |
| Electricity
sales to final customers |
- |
- |
1,278,340 |
- |
- |
- |
- |
- |
- |
9 |
- |
547,594 |
- |
(362) |
1,825,581 |
| Electricity
sales to distributors |
547,537 |
- |
58,326 |
- |
33,986 |
- |
- |
205,659 |
177,679 |
7,859 |
- |
389,430 |
- |
(573,030) |
847,446 |
| Use
of the main distribution and transmission grid (TUSD/ TUST) |
- |
205,379 |
1,233,874 |
- |
- |
- |
- |
- |
- |
- |
9,800 |
- |
- |
(99,810) |
1,349,244 |
| Construction
revenue |
- |
33,042 |
567,903 |
2,932 |
- |
- |
- |
- |
- |
- |
160 |
- |
- |
(2,932) |
601,105 |
| Fair
value of assets from the indemnity for the concession |
- |
- |
7,881 |
- |
- |
- |
- |
- |
- |
- |
- |
- |
- |
- |
7,881 |
| Distribution
of piped gas |
- |
- |
- |
257,000 |
- |
- |
- |
- |
- |
- |
- |
- |
- |
(257,000) |
- |
| Sectoral
assets and liabilities result |
- |
- |
362,227 |
- |
- |
- |
- |
- |
- |
- |
- |
- |
- |
- |
362,227 |
| Other
operating revenues |
15,098 |
6,402 |
121,349 |
- |
236 |
- |
- |
576 |
3 |
- |
7 |
(21,801) |
- |
(15,130) |
106,740 |
| OPERATING
COSTS AND EXPENSES |
(354,953) |
(97,536) |
(3,320,743) |
(208,133) |
(23,093) |
(172,927) |
(523) |
(141,491) |
(111,439) |
(4,788) |
(2,430) |
(905,322) |
(5,651) |
1,041,970 |
(4,307,060) |
| Energy
purchased for resale |
(26,242) |
- |
(1,496,129) |
- |
(520) |
- |
- |
(5,663) |
(22,252) |
(138) |
- |
(897,232) |
- |
570,583 |
(1,877,592) |
| Charges
of the main distribution and transmission grid |
(99,879) |
- |
(615,533) |
- |
(5,765) |
(8,709) |
- |
(15,906) |
(39,371) |
(323) |
- |
- |
- |
108,309 |
(677,178) |
| Personnel
and management |
(53,214) |
(37,922) |
(177,637) |
(9,300) |
(1,334) |
(1,566) |
- |
(3,559) |
(623) |
(302) |
(222) |
(3,641) |
(11,390) |
10,863 |
(289,847) |
| Private
pension and health plans |
(11,777) |
(8,203) |
(42,159) |
(1,451) |
(40) |
(166) |
- |
(488) |
(88) |
(23) |
(31) |
(471) |
(2,338) |
1,616 |
(65,618) |
| Materials |
(2,348) |
(1,399) |
(15,753) |
(249) |
(38) |
(18) |
- |
(178) |
(611) |
(3) |
(89) |
(24) |
(103) |
266 |
(20,547) |
| Raw
material and supplies - energy production |
(3,763) |
- |
- |
- |
- |
(437) |
- |
- |
- |
- |
- |
- |
- |
437 |
(3,763) |
| Natural
gas and supplies for gas business |
- |
- |
- |
(186,424) |
- |
- |
- |
- |
- |
- |
- |
- |
- |
186,424 |
- |
| Third-party
services |
(23,585) |
(8,536) |
(149,080) |
(3,082) |
(4,701) |
(5,245) |
(78) |
(38,381) |
(9,594) |
(828) |
(1,607) |
(1,639) |
(5,100) |
21,220 |
(230,236) |
| Depreciation
and amortization |
(94,660) |
(3,858) |
(128,816) |
(3,860) |
(8,473) |
(5,722) |
(573) |
(65,032) |
(31,899) |
(2,822) |
(11) |
(416) |
(753) |
(1,144) |
(348,040) |
| Provisions
and reversals |
(10,396) |
(7,116) |
(59,687) |
233 |
- |
(150,469) |
- |
(164) |
(2) |
- |
(4) |
(784) |
14,138 |
139,562 |
(74,689) |
| Construction
cost |
- |
(25,430) |
(567,903) |
(2,932) |
- |
- |
- |
- |
- |
- |
(160) |
- |
- |
2,933 |
(593,493) |
| Other
operating costs and expenses |
(29,089) |
(5,073) |
(68,046) |
(1,067) |
(2,222) |
(595) |
128 |
(12,121) |
(6,999) |
(349) |
(307) |
(1,115) |
(105) |
904 |
(126,057) |
| EQUITY
IN EARNINGS OF SUBSIDIARIES |
67,526 |
74,806 |
- |
- |
- |
- |
- |
6,512 |
- |
- |
- |
- |
441,152 |
(517,251) |
72,745 |
| EARNINGS
BEFORE INCOME TAXES |
275,208 |
222,093 |
309,157 |
51,799 |
11,129 |
(172,927) |
(523) |
71,256 |
66,243 |
3,080 |
7,537 |
9,901 |
435,501 |
(423,545) |
865,908 |
| FINANCIAL
RESULTS |
(104,819) |
(70,459) |
(93,260) |
(424) |
22,860 |
4,210 |
(337) |
(31,300) |
6,069 |
(1,646) |
1,758 |
9,338 |
14,546 |
(3,782) |
(247,245) |
| Financial
income |
29,558 |
16,054 |
138,693 |
7,452 |
54,776 |
5,843 |
103 |
35,954 |
6,228 |
(1,646) |
2,444 |
9,406 |
18,212 |
(23,058) |
300,019 |
| Financial
expenses |
(134,377) |
(86,512) |
(231,953) |
(7,876) |
(31,916) |
(1,633) |
(440) |
(67,253) |
(159) |
(0) |
(685) |
(68) |
(3,667) |
19,276 |
(547,264) |
| OPERATIONAL
EXPENSES / INCOME |
170,389 |
151,634 |
215,897 |
51,375 |
33,989 |
(168,717) |
(860) |
39,956 |
72,312 |
1,434 |
9,295 |
19,239 |
450,046 |
(427,326) |
618,664 |
| INCOME
TAX AND SOCIAL CONTRIBUTION ON PROFIT |
(34,259) |
(25,732) |
(54,367) |
(17,110) |
(9,315) |
(13,614) |
- |
(17,510) |
(24,243) |
(535) |
(1,158) |
(1,905) |
(1,677) |
32,335 |
(169,089) |
| NET
INCOME continuing operations |
136,130 |
125,902 |
161,530 |
34,265 |
24,674 |
(182,331) |
(860) |
22,446 |
48,069 |
900 |
8,137 |
17,334 |
448,369 |
(394,990) |
449,575 |
| NET
INCOME discontinued operations |
(111,039) |
- |
- |
- |
- |
- |
- |
- |
- |
- |
- |
- |
(130,577) |
99,747 |
(141,869) |
| NET
INCOME |
25,091 |
125,902 |
161,530 |
34,265 |
24,674 |
(182,331) |
(860) |
22,446 |
48,069 |
900 |
8,137 |
17,334 |
317,792 |
(295,243) |
307,706 |
| Attributed
to shareholders of the parent company - continuing operations |
136,131 |
125,902 |
161,530 |
- |
17,272 |
- |
(860) |
22,446 |
48,069 |
900 |
8,137 |
17,334 |
337,330 |
(425,821) |
448,369 |
| Attributed
to the controlling company's shareholders - discontinued operations |
(111,040) |
- |
- |
17,475 |
- |
(148,053) |
- |
- |
- |
- |
- |
- |
(19,538) |
130,578 |
(130,577) |
| Attributed to non-controlling
shareholders - continuing operations |
- |
- |
- |
- |
7,402 |
- |
- |
- |
- |
- |
- |
- |
- |
- |
7,402 |
| Attributed to non-controlling shareholders -
discontinued operations |
- |
- |
- |
16,790 |
- |
(34,278) |
- |
- |
- |
- |
- |
- |
- |
- |
(17,488) |
| EBITDA
continuing operations |
369,868 |
225,950 |
437,973 |
55,659 |
19,602 |
(167,205) |
50 |
136,288 |
98,142 |
5,902 |
7,548 |
10,317 |
436,254 |
(422,400) |
1,213,949 |
| Exhibit II- RESULT BY SUBSIDIARY > ASSETS BY COMPANY |
| |
|
|
|
|
|
|
|
|
|
|
|
|
|
R$'000 |
| Assets
- June -2024 |
Geração
e Transmissão |
Distribuição |
Compagas |
Elejor |
UEG
Araucária |
Serviços |
Wind
Farms |
FDA |
Bela
Vista |
Costa
Oeste, Marumbi, Uirapuru |
Mercado
Livre |
Holding |
Eliminations |
Consolidated |
| CURRENT |
3,597,477 |
6,907,884 |
240,920 |
182,323 |
17,584 |
53,406 |
1,009,913 |
225,429 |
47,011 |
83,122 |
805,103 |
4,273,729 |
(1,919,065) |
15,524,849 |
| Cash
and cash equivalents |
2,052,223 |
2,198,544 |
21,476 |
138,714 |
639 |
47,090 |
868,061 |
163,953 |
41,469 |
55,698 |
326,002 |
1,438,993 |
(22,128) |
7,330,747 |
| Bonds
and securities |
|
2,213 |
- |
- |
- |
794 |
- |
- |
- |
- |
2,611 |
91 |
- |
5,709 |
| Collaterals
and escrow accounts |
- |
9 |
258 |
- |
- |
- |
- |
- |
- |
- |
- |
- |
(258) |
9 |
| Customers |
370,577 |
2,917,523 |
92,185 |
20,160 |
- |
179 |
100,285 |
57,841 |
4,724 |
8,876 |
312,065 |
- |
(290,784) |
3,593,631 |
| Dividends
receivable |
98,439 |
- |
- |
- |
- |
- |
305 |
- |
- |
- |
- |
2,144,127 |
(2,179,091) |
63,780 |
| Sectorial
financial assets |
|
- |
- |
- |
|
- |
- |
- |
- |
- |
- |
- |
- |
- |
| Account
receivable related to concession |
10,855 |
- |
- |
- |
- |
- |
- |
- |
- |
- |
- |
- |
- |
10,855 |
| Contract
Assets |
253,049 |
- |
- |
- |
- |
- |
- |
- |
- |
16,607 |
- |
- |
- |
269,656 |
| Other
current receivables |
101,512 |
464,417 |
61,246 |
9,729 |
66 |
3,077 |
6,383 |
1,718 |
7 |
571 |
141,678 |
2,932 |
(75,917) |
717,419 |
| Inventories |
36,268 |
118,213 |
5,699 |
1,275 |
- |
- |
4,375 |
- |
- |
205 |
- |
- |
(5,699) |
160,336 |
| Income
tax and social contribution |
106,219 |
68,656 |
3,534 |
11,976 |
14,672 |
2,117 |
21,448 |
549 |
569 |
978 |
14,313 |
152,186 |
(18,206) |
379,011 |
| Other
current recoverable taxes |
23,731 |
1,092,372 |
56,347 |
- |
2,207 |
- |
105 |
1,181 |
21 |
- |
8,119 |
- |
(58,551) |
1,125,532 |
| Prepaid
expenses |
7,441 |
37,183 |
175 |
469 |
- |
149 |
6,281 |
187 |
221 |
187 |
295 |
1,375 |
(175) |
53,788 |
| Related
parties |
22,599 |
8,754 |
- |
- |
- |
- |
2,670 |
- |
- |
- |
20 |
52,314 |
(85,523) |
834 |
| Assets
held for sale |
514,564 |
- |
- |
- |
- |
- |
- |
- |
- |
- |
- |
481,711 |
817,267 |
1,813,542 |
| NON-CURRENT |
20,194,071 |
16,657,206 |
788,275 |
601,097 |
376,527 |
101,815 |
7,945,608 |
397,294 |
190,362 |
493,969 |
499,082 |
21,188,354 |
(28,344,149) |
41,089,511 |
| Long
Term Assets |
5,838,077 |
7,554,674 |
85,553 |
96,875 |
98,102 |
15,283 |
641,917 |
22,282 |
1 |
493,678 |
488,785 |
470,303 |
(521,513) |
15,284,017 |
| Bonds
and securities |
142,638 |
634 |
- |
- |
- |
- |
316,692 |
17,125 |
- |
4,604 |
- |
- |
- |
481,693 |
| Other
temporary investments |
- |
- |
- |
- |
- |
14,646 |
- |
- |
- |
- |
- |
30,920 |
- |
45,566 |
| Customers |
- |
91,396 |
- |
- |
- |
- |
- |
- |
- |
- |
- |
- |
- |
91,396 |
| Judicial
deposits |
44,988 |
195,754 |
277 |
- |
38 |
72 |
86 |
- |
- |
- |
15,554 |
132,851 |
(311) |
389,309 |
| Sectoral
financial assets |
- |
72,043 |
- |
- |
|
- |
- |
- |
- |
- |
- |
- |
- |
72,043 |
| Account
receivable related to concession |
873,224 |
2,230,475 |
- |
- |
- |
- |
- |
- |
- |
- |
- |
- |
- |
3,103,699 |
| Contract
Assets |
4,664,346 |
2,186,745 |
56,069 |
- |
- |
- |
- |
- |
- |
488,662 |
- |
- |
(63,168) |
7,332,654 |
| Other
non-current receivables |
30,262 |
41,919 |
29,207 |
2,508 |
- |
- |
- |
4,011 |
- |
412 |
473,160 |
19 |
(29,204) |
552,294 |
| Income
tax and social contribution |
515 |
60,845 |
- |
704 |
- |
- |
- |
- |
- |
- |
71 |
- |
- |
62,135 |
| Deferred
income tax and social contribution |
- |
1,119,201 |
- |
87,812 |
73,066 |
- |
- |
- |
- |
- |
- |
264,907 |
(73,066) |
1,471,920 |
| Other
non-current recoverable taxes |
82,104 |
1,555,662 |
- |
- |
24,998 |
565 |
222 |
1,146 |
1 |
- |
- |
41,606 |
(24,996) |
1,681,308 |
| Related
parties |
- |
- |
- |
5,851 |
- |
- |
324,917 |
- |
- |
- |
- |
- |
(330,768) |
- |
| Investments |
8,429,834 |
442 |
- |
- |
- |
- |
2,714,439 |
- |
- |
- |
- |
20,695,601 |
(28,317,838) |
3,522,478 |
| Property,
plant and equipment, net |
4,883,315 |
- |
405 |
324,558 |
278,410 |
82,142 |
4,538,748 |
317,286 |
185,431 |
238 |
747 |
8,098 |
(278,814) |
10,340,564 |
| Intangible
assets |
959,093 |
8,930,332 |
682,954 |
178,962 |
15 |
772 |
7,548 |
57,686 |
4,930 |
53 |
5,371 |
7,192 |
793,381 |
11,628,289 |
| Right
to use an asset |
83,752 |
171,758 |
19,363 |
702 |
- |
3,618 |
42,956 |
40 |
- |
- |
4,179 |
7,160 |
(19,365) |
314,163 |
| TOTAL |
23,791,548 |
23,565,090 |
1,029,195 |
783,420 |
394,111 |
155,221 |
8,955,521 |
622,723 |
237,373 |
577,091 |
1,304,185 |
25,462,083 |
(30,263,214) |
56,614,360 |
| |
|
|
|
|
|
|
|
|
|
|
|
|
|
|
| |
|
|
|
|
|
|
|
|
|
|
|
|
|
|
| Assets
- December 2023 |
Geração
e Transmissão |
Distribuição |
Compagas |
Elejor |
UEG
Araucária |
Serviços |
Wind
Farms |
FDA |
Bela
Vista |
Costa
Oeste, Marumbi, Uirapuru |
Mercado
Livre |
Holding |
Eliminations |
Consolidated |
| CURRENT |
2,483,103 |
5,153,666 |
240,017 |
209,323 |
36,580 |
13,598 |
1,008,543 |
442,162 |
38,993 |
110,409 |
1,074,359 |
4,820,021 |
(1,915,044) |
13,715,730 |
| Cash
and cash equivalents |
1,008,767 |
626,708 |
101,437 |
166,544 |
22,354 |
3,290 |
831,553 |
353,241 |
34,999 |
83,343 |
294,762 |
2,231,413 |
(123,788) |
5,634,623 |
| Bonds
and securities |
- |
- |
- |
- |
- |
4,670 |
- |
- |
- |
- |
- |
93 |
- |
4,763 |
| Collaterals
and escrow accounts |
- |
9 |
211 |
- |
- |
- |
- |
- |
- |
- |
- |
- |
(211) |
9 |
| Customers |
425,448 |
2,973,010 |
83,153 |
21,157 |
- |
- |
115,672 |
84,309 |
3,074 |
7,976 |
382,264 |
- |
(334,893) |
3,761,170 |
| Dividends
receivable |
212,944 |
- |
- |
- |
- |
- |
19,883 |
- |
- |
- |
- |
1,942,406 |
(2,079,664) |
95,569 |
| Sectorial
financial assets |
- |
15,473 |
- |
- |
- |
- |
- |
- |
- |
- |
- |
- |
- |
15,473 |
| Account
receivable related to concession |
9,354 |
- |
- |
- |
- |
- |
- |
- |
- |
- |
- |
- |
- |
9,354 |
| Contract
Assets |
268,260 |
- |
- |
- |
- |
- |
- |
- |
- |
16,356 |
- |
- |
- |
284,616 |
| Other
current receivables |
118,627 |
435,619 |
43,950 |
9,398 |
1 |
3,120 |
5,968 |
252 |
- |
653 |
383,243 |
2,431 |
(53,530) |
949,732 |
| Inventories |
37,923 |
131,927 |
5,383 |
264 |
- |
16 |
4,375 |
16 |
- |
205 |
- |
- |
(5,383) |
174,726 |
| Income
tax and social contribution |
150,720 |
1,259 |
5,326 |
10,217 |
13,909 |
1,937 |
19,316 |
2,586 |
491 |
1,644 |
13,516 |
113,532 |
(19,235) |
315,218 |
| Other
current recoverable taxes |
18,688 |
922,450 |
8 |
- |
- |
565 |
102 |
1,180 |
23 |
- |
333 |
- |
(6) |
943,343 |
| Prepaid
expenses |
11,334 |
37,807 |
549 |
1,743 |
316 |
- |
8,631 |
578 |
406 |
232 |
241 |
1,897 |
(865) |
62,869 |
| Related
parties |
24,474 |
9,404 |
- |
- |
- |
- |
3,043 |
- |
- |
- |
- |
54 |
(35,639) |
1,336 |
| NON-CURRENT |
196,564 |
- |
- |
- |
- |
- |
- |
- |
- |
- |
- |
528,195 |
738,170 |
1,462,929 |
| Long
Term Assets |
20,868,273 |
16,677,461 |
783,607 |
594,827 |
386,787 |
49,078 |
8,125,742 |
452,885 |
196,589 |
491,174 |
750,631 |
20,538,876 |
(27,812,586) |
42,103,344 |
| Bonds
and securities |
5,886,631 |
8,229,821 |
73,274 |
83,192 |
98,157 |
593 |
609,417 |
18,922 |
224 |
490,861 |
740,114 |
611,187 |
(498,956) |
16,343,437 |
| Other
temporary investments |
136,591 |
1,005 |
- |
- |
- |
- |
330,401 |
16,388 |
- |
4,410 |
1,937 |
- |
- |
490,732 |
| Customers |
- |
- |
- |
- |
- |
- |
- |
- |
- |
- |
- |
31,728 |
- |
31,728 |
| Judicial
deposits |
- |
105,259 |
- |
- |
- |
- |
- |
- |
- |
- |
- |
- |
- |
105,259 |
| Sectoral
financial assets |
94,368 |
380,433 |
61 |
- |
41 |
593 |
81 |
- |
218 |
- |
15,647 |
143,371 |
(101) |
634,712 |
| Account
receivable related to concession |
- |
15,473 |
- |
- |
- |
- |
- |
- |
- |
- |
- |
- |
- |
15,473 |
| Contract
Assets |
855,222 |
1,954,679 |
- |
- |
- |
- |
- |
- |
- |
- |
- |
- |
- |
2,809,901 |
| Other
non-current receivables |
4,639,497 |
2,201,958 |
44,039 |
- |
- |
- |
- |
- |
- |
486,451 |
- |
- |
(51,500) |
7,320,445 |
| Income
tax and social contribution |
81,646 |
44,839 |
29,174 |
2,507 |
- |
- |
44 |
1,859 |
- |
- |
722,423 |
18 |
(29,170) |
853,340 |
| Deferred
income tax and social contribution |
508 |
66,123 |
- |
1,301 |
- |
- |
- |
- |
- |
- |
71 |
- |
- |
68,003 |
| Other
non-current recoverable taxes |
- |
1,324,670 |
- |
73,533 |
73,066 |
- |
- |
- |
- |
- |
- |
359,485 |
(73,066) |
1,757,688 |
| Prepaid
expenses |
78,799 |
2,135,382 |
- |
- |
25,050 |
- |
178 |
675 |
6 |
- |
36 |
41,078 |
(25,048) |
2,256,156 |
| Related
parties |
- |
- |
- |
5,851 |
- |
- |
278,713 |
- |
- |
- |
- |
35,507 |
(320,071) |
- |
| Investments |
8,629,485 |
443 |
- |
- |
- |
- |
2,788,839 |
- |
- |
- |
- |
19,906,237 |
(27,813,207) |
3,511,797 |
| Property,
plant and equipment, net |
5,259,216 |
- |
- |
326,291 |
288,602 |
43,881 |
4,676,981 |
318,527 |
191,085 |
247 |
770 |
8,424 |
(288,603) |
10,825,421 |
| Intangible
assets |
1,028,600 |
8,317,327 |
699,697 |
184,539 |
28 |
911 |
7,267 |
115,436 |
5,280 |
66 |
5,784 |
6,336 |
798,818 |
11,170,089 |
| Right
to use an asset |
64,341 |
129,870 |
10,636 |
805 |
- |
3,693 |
43,238 |
- |
- |
- |
3,963 |
6,692 |
(10,638) |
252,600 |
| TOTAL |
23,351,376 |
21,831,127 |
1,023,624 |
804,150 |
423,367 |
62,676 |
9,134,285 |
895,047 |
235,582 |
601,583 |
1,824,990 |
25,358,897 |
(29,727,630) |
55,819,074 |
| Exhibit II- RESULT BY SUBSIDIARY > LIABILITIES BY COMPANY |
| |
|
|
|
|
|
|
|
|
|
|
|
|
|
R$'000 |
| Liabilities
- June -24 |
Geração
e Transmissão |
Distribuição |
Compagas |
Elejor |
UEG
Araucária |
Serviços |
Wind
Farms |
FDA |
Bela
Vista |
Costa
Oeste, Marumbi, Uirapuru |
Mercado
Livre |
Holding |
Eliminations |
Consolidated |
| CURRENT |
3,569,741 |
6,265,115 |
260,338 |
108,534 |
51,887 |
16,084 |
532,775 |
72,404 |
1,388 |
9,878 |
715,317 |
415,873 |
(2,107,147) |
9,912,187 |
| Social
charges and accruals |
255,627 |
536,259 |
9,924 |
514 |
703 |
- |
2 |
- |
- |
- |
5,577 |
26,088 |
(10,627) |
824,067 |
| Associated
companies and parent company |
5,800 |
11,814 |
- |
- |
- |
50 |
27,990 |
632 |
168 |
204 |
361 |
1,913 |
(48,932) |
- |
| Suppliers |
310,701 |
1,654,567 |
66,324 |
3,139 |
5,515 |
14,787 |
66,049 |
25,388 |
490 |
1,381 |
295,289 |
7,664 |
(279,520) |
2,171,774 |
| Income
Tax and Social Contribution payable |
- |
- |
21 |
294 |
- |
49 |
12,096 |
33,767 |
483 |
2,110 |
2,999 |
- |
(21) |
51,798 |
| Other
taxes |
1,244 |
241,214 |
15,868 |
603 |
283 |
188 |
7,412 |
3,396 |
163 |
250 |
19,959 |
233 |
(16,151) |
274,662 |
| Loans
and financing |
665,042 |
746,589 |
- |
- |
- |
- |
123,683 |
- |
- |
4,892 |
- |
- |
- |
1,540,206 |
| Debentures |
596,949 |
670,551 |
93,231 |
- |
- |
781 |
51,389 |
- |
- |
- |
- |
- |
(93,231) |
1,319,670 |
| Dividends
payable |
1,529,433 |
310,904 |
68,746 |
- |
45,386 |
- |
7,852 |
- |
- |
- |
258,986 |
9,097 |
(2,221,307) |
9,097 |
| Post
employment benefits |
24,834 |
67,011 |
- |
- |
- |
- |
- |
- |
- |
- |
128 |
4,391 |
- |
96,364 |
| Customer
charges due |
15,060 |
34,855 |
- |
- |
- |
- |
- |
502 |
- |
181 |
- |
- |
- |
50,598 |
| Research
and development and energy efficiency |
36,457 |
167,380 |
- |
1,735 |
- |
- |
- |
267 |
- |
587 |
- |
- |
- |
206,426 |
| Payables
related to concession |
1,139 |
- |
- |
100,901 |
- |
- |
- |
- |
- |
- |
- |
- |
- |
102,040 |
| Sectorial
financial liabilities |
- |
1,617,748 |
- |
- |
- |
- |
- |
- |
- |
- |
- |
- |
- |
1,617,748 |
| Other
accounts payable |
9,748 |
45,685 |
2,399 |
249 |
- |
54 |
663 |
40 |
- |
- |
136 |
346 |
(2,399) |
56,921 |
| Other
bills to pay |
91,858 |
160,538 |
3,825 |
1,099 |
- |
175 |
235,639 |
8,412 |
84 |
273 |
131,882 |
366,141 |
(3,819) |
996,107 |
| PIS
and Cofins to be refunded to consumers |
|
- |
|
|
|
|
- |
|
|
- |
|
|
- |
- |
| Provision
for allocation of Pis and Cofins credits |
|
- |
|
|
|
|
- |
|
|
- |
|
|
- |
- |
| Provisions
for litigation |
- |
|
- |
- |
- |
- |
- |
- |
- |
- |
- |
- |
- |
- |
| Liabilities
associated with assets held for sale |
25,849 |
- |
- |
- |
- |
- |
- |
- |
- |
- |
- |
- |
568,860 |
594,709 |
| NON-CURRENT |
7,117,223 |
10,067,326 |
298,443 |
738,934 |
73,664 |
73,541 |
3,083,728 |
25,004 |
2,567 |
40,773 |
293,540 |
287,940 |
(434,192) |
21,668,491 |
| Associated
companies and parent company |
- |
- |
- |
- |
52,838 |
- |
312,185 |
- |
- |
- |
- |
5,851 |
(370,874) |
- |
| Suppliers |
130,695 |
- |
- |
- |
- |
- |
- |
- |
- |
- |
- |
- |
- |
130,695 |
| Deferred
income tax and social contribution |
1,245,295 |
- |
19,058 |
1,365 |
- |
146 |
25,560 |
16,313 |
1,041 |
17,387 |
95,219 |
- |
267,307 |
1,688,691 |
| Tax
liabilities |
- |
321,402 |
14,717 |
- |
- |
- |
- |
- |
- |
- |
- |
- |
(14,715) |
321,404 |
| Loans
and financing |
1,532,193 |
2,863 |
- |
- |
- |
- |
2,108,808 |
- |
- |
18,035 |
- |
- |
- |
3,661,899 |
| Debentures |
3,191,501 |
6,355,489 |
165,666 |
- |
- |
69,673 |
466,430 |
- |
- |
- |
- |
- |
(165,666) |
10,083,093 |
| Post-employment
benefits |
402,259 |
953,486 |
9,322 |
- |
758 |
- |
- |
- |
- |
- |
3,670 |
47,018 |
(10,080) |
1,406,433 |
| Research
and development and energy efficiency |
- |
266,393 |
- |
- |
9,140 |
- |
- |
8,691 |
- |
890 |
- |
- |
(9,140) |
275,974 |
| Payables
related to the concession |
63,895 |
- |
- |
727,226 |
- |
- |
- |
- |
- |
- |
- |
- |
- |
791,121 |
| Sectorial
financial liabilities |
|
- |
- |
- |
|
- |
- |
|
|
- |
- |
- |
- |
- |
| Lease
liability |
79,819 |
137,117 |
18,615 |
494 |
- |
3,722 |
45,920 |
- |
- |
- |
4,300 |
7,300 |
(18,615) |
278,672 |
| Other
payables |
52,604 |
5,369 |
54,603 |
- |
- |
- |
122,359 |
- |
- |
- |
189,652 |
45,107 |
(99,436) |
370,258 |
| PIS/Cofins
to be refunded to consumers |
|
- |
|
|
|
|
- |
|
|
- |
|
|
- |
- |
| Provision
for allocation of PIS and COFINS |
|
1,541,990 |
|
|
|
|
- |
|
|
- |
|
|
|
1,541,990 |
| Provisions
for litigation |
418,962 |
483,217 |
16,462 |
9,849 |
10,928 |
- |
2,466 |
- |
1,526 |
4,461 |
699 |
182,664 |
(12,973) |
1,118,261 |
| EQUITY |
13,104,584 |
7,232,649 |
470,414 |
(64,048) |
268,560 |
65,596 |
5,339,018 |
525,315 |
233,418 |
526,440 |
295,328 |
24,758,270 |
(27,721,875) |
25,033,682 |
| Attributable
to controlling shareholders |
13,104,584 |
7,232,649 |
470,414 |
(64,048) |
268,560 |
65,596 |
5,339,018 |
525,315 |
233,418 |
526,440 |
295,328 |
24,758,270 |
(27,997,287) |
24,758,270 |
| Capital |
6,242,757 |
5,372,206 |
220,966 |
35,503 |
425,662 |
78,785 |
5,176,068 |
409,509 |
223,913 |
275,161 |
237,210 |
12,821,758 |
(18,697,753) |
12,821,758 |
| Advance
for Future Capital Increase |
|
|
|
|
|
|
- |
|
|
- |
|
|
|
|
| Capital
reserves |
|
|
|
|
|
|
- |
|
|
- |
|
|
|
|
| Asset
valuation adjustments |
481,252 |
(163,951) |
983 |
2,649 |
442 |
(1) |
- |
- |
- |
- |
(1,097) |
289,982 |
(320,277) |
289,982 |
| Legal
Reserves |
961,538 |
335,200 |
44,193 |
- |
- |
- |
54,684 |
58,164 |
703 |
27,949 |
28,071 |
1,625,628 |
(1,510,502) |
1,625,628 |
| Profit
retention reserve |
4,745,688 |
1,239,409 |
68,141 |
- |
- |
- |
443,457 |
- |
- |
186,658 |
4,377 |
9,000,506 |
(6,687,730) |
9,000,506 |
| Additional
proposed dividends |
- |
- |
- |
- |
- |
- |
- |
- |
- |
- |
- |
- |
- |
- |
| Accumulated
profit |
673,349 |
449,785 |
136,131 |
(102,200) |
(157,544) |
(13,188) |
(335,191) |
57,642 |
8,802 |
36,672 |
26,767 |
1,020,396 |
(781,025) |
1,020,396 |
| Attributable
to noncontrolling interests |
- |
- |
- |
- |
- |
- |
- |
- |
- |
- |
- |
- |
275,412 |
275,412 |
| TOTAL |
23,791,548 |
23,565,090 |
1,029,195 |
783,420 |
394,111 |
155,221 |
8,955,521 |
622,723 |
237,373 |
577,091 |
1,304,185 |
25,462,083 |
(30,263,214) |
56,614,360 |
| |
|
|
|
|
|
|
|
|
|
|
|
|
|
|
| |
|
|
|
|
|
|
|
|
|
|
|
|
|
R$'000 |
| Liabilities
- December-23 |
Geração
e Transmissão |
Distribuição |
Compagas |
Elejor |
UEG
Araucária |
Serviços |
Wind
Farms |
FDA |
Bela
Vista |
Costa
Oeste, Marumbi, Uirapuru |
Mercado
Livre |
Holding |
Eliminations |
Consolidated |
| CURRENT |
2,929,672 |
5,490,743 |
206,137 |
109,350 |
49,797 |
4,033 |
549,114 |
218,002 |
3,601 |
22,804 |
932,237 |
857,164 |
(2,063,223) |
9,309,433 |
| Social
charges and accruals |
290,601 |
597,160 |
9,452 |
369 |
702 |
- |
64 |
- |
- |
- |
8,736 |
30,608 |
(10,154) |
927,538 |
| Associated
companies and parent company |
5,967 |
11,950 |
- |
- |
- |
54 |
30,356 |
865 |
238 |
286 |
379 |
1,841 |
(51,933) |
- |
| Suppliers |
318,600 |
1,605,111 |
58,010 |
3,984 |
5,684 |
3,754 |
68,712 |
23,045 |
586 |
976 |
381,520 |
4,529 |
(320,085) |
2,154,430 |
| Income
Tax and Social Contribution payable |
- |
- |
12,876 |
294 |
- |
- |
8,721 |
122,906 |
278 |
596 |
- |
183 |
(12,876) |
132,979 |
| Other
taxes |
57,245 |
253,336 |
13,463 |
1,057 |
277 |
208 |
8,611 |
4,871 |
501 |
264 |
19,508 |
474 |
(13,734) |
346,083 |
| Loans
and financing |
174,260 |
375,135 |
- |
- |
- |
- |
120,930 |
- |
- |
5,656 |
- |
- |
- |
675,980 |
| Debentures |
607,981 |
569,700 |
81,797 |
- |
- |
- |
47,968 |
- |
- |
- |
- |
- |
(81,797) |
1,225,649 |
| Dividends
payable |
1,274,433 |
460,904 |
24,314 |
- |
43,134 |
- |
40,397 |
55,460 |
1,552 |
14,151 |
185,341 |
464,147 |
(2,099,687) |
464,147 |
| Post
employment benefits |
22,124 |
59,742 |
- |
- |
- |
- |
- |
- |
- |
- |
125 |
3,842 |
- |
85,833 |
| Customer
charges due |
15,248 |
44,789 |
- |
- |
- |
- |
- |
1,177 |
- |
252 |
- |
- |
- |
61,466 |
| Research
and development and energy efficiency |
55,130 |
262,444 |
- |
1,672 |
- |
- |
- |
369 |
- |
582 |
- |
- |
- |
320,196 |
| Payables
related to concession |
2,170 |
- |
- |
99,806 |
- |
- |
- |
- |
- |
- |
- |
- |
- |
101,976 |
| Sectorial
financial liabilities |
- |
476,103 |
- |
- |
- |
- |
- |
- |
- |
- |
- |
- |
- |
476,103 |
| Other
accounts payable |
8,364 |
40,083 |
2,601 |
249 |
- |
17 |
487 |
- |
- |
- |
137 |
405 |
(2,601) |
49,742 |
| Other
bills to pay |
97,549 |
175,695 |
3,624 |
1,919 |
- |
- |
222,868 |
9,309 |
446 |
41 |
336,491 |
15,135 |
(3,620) |
859,456 |
| PIS
and Cofins to be refunded to consumers |
- |
558,591 |
- |
- |
- |
- |
- |
- |
- |
- |
- |
- |
- |
558,591 |
| Provisions
for litigation |
- |
- |
- |
- |
- |
- |
- |
- |
- |
- |
- |
336,000 |
- |
336,000 |
| Assets
held for sale |
- |
- |
- |
- |
- |
- |
- |
- |
- |
- |
- |
- |
533,264 |
533,264 |
| NON-CURRENT |
7,673,539 |
9,557,520 |
302,821 |
730,939 |
55,959 |
4,321 |
3,080,497 |
42,991 |
2,710 |
46,555 |
550,547 |
615,579 |
(346,004) |
22,317,974 |
| Associated
companies and parent company |
- |
- |
- |
- |
35,616 |
- |
265,157 |
- |
- |
- |
- |
5,851 |
(306,624) |
- |
| Suppliers |
131,143 |
- |
- |
- |
- |
- |
- |
- |
- |
- |
- |
- |
- |
131,143 |
| Deferred
income tax and social contribution |
1,207,009 |
- |
21,319 |
1,465 |
- |
- |
24,244 |
35,267 |
865 |
18,733 |
109,736 |
- |
268,156 |
1,686,793 |
| Tax
liabilities |
60,756 |
546,184 |
- |
- |
- |
589 |
- |
- |
- |
- |
534 |
4,030 |
- |
612,093 |
| Loans
and financing |
2,106,275 |
375,585 |
- |
- |
- |
- |
2,164,987 |
- |
- |
20,390 |
- |
- |
- |
4,667,237 |
| Debentures |
3,160,977 |
4,750,476 |
202,405 |
- |
- |
- |
482,004 |
- |
- |
- |
- |
- |
(202,405) |
8,393,457 |
| Post-employment
benefits |
398,594 |
948,724 |
8,608 |
- |
718 |
- |
- |
- |
- |
- |
3,555 |
47,537 |
(9,326) |
1,398,410 |
| Research
and development and energy efficiency |
- |
224,996 |
- |
- |
8,690 |
- |
- |
7,724 |
- |
757 |
- |
- |
(8,690) |
233,478 |
| Payables
related to the concession |
62,990 |
- |
- |
728,889 |
- |
- |
- |
- |
- |
- |
- |
- |
- |
791,879 |
| Sectorial
financial liabilities |
- |
27,888 |
- |
- |
- |
- |
- |
- |
- |
- |
- |
- |
- |
27,888 |
| Lease
liability |
60,761 |
99,138 |
8,972 |
585 |
- |
3,732 |
45,781 |
- |
- |
- |
4,022 |
6,681 |
(8,972) |
220,700 |
| Other
payables |
49,539 |
1,559 |
45,086 |
- |
- |
- |
96,018 |
- |
- |
17 |
431,938 |
25,297 |
(70,384) |
579,070 |
| PIS/Cofins
to be refunded to consumers |
- |
173,135 |
- |
- |
- |
- |
- |
- |
- |
- |
- |
- |
- |
173,135 |
| Provision
for allocation of PIS and Cofins credits |
- |
1,909,775 |
- |
- |
- |
- |
- |
- |
- |
- |
- |
- |
- |
1,909,775 |
| Provisions
for litigation |
435,495 |
500,060 |
16,431 |
- |
10,935 |
- |
2,306 |
- |
1,845 |
6,658 |
762 |
526,183 |
(7,759) |
1,492,916 |
| EQUITY |
12,748,166 |
6,782,864 |
514,666 |
(36,139) |
317,611 |
54,322 |
5,504,674 |
634,053 |
229,271 |
532,222 |
342,206 |
23,886,151 |
(27,318,403) |
24,191,667 |
| Attributable
to controlling shareholders |
12,748,166 |
6,782,864 |
514,666 |
(36,139) |
317,611 |
54,322 |
5,504,674 |
634,053 |
229,271 |
532,222 |
342,206 |
23,886,151 |
(27,623,917) |
23,886,153 |
| Capital |
6,242,757 |
5,372,206 |
220,966 |
35,503 |
425,662 |
16,685 |
5,157,938 |
409,509 |
223,913 |
275,161 |
237,210 |
12,821,758 |
(18,617,510) |
12,821,758 |
| Advance
for Future Capital Increase |
- |
- |
- |
- |
- |
48,950 |
17,681 |
- |
- |
- |
- |
- |
(66,631) |
- |
| Capital
reserves |
- |
- |
- |
- |
- |
- |
- |
- |
- |
- |
- |
- |
- |
- |
| Equity
valuation adjustments |
498,183 |
(163,951) |
983 |
2,844 |
442 |
(1) |
- |
- |
- |
- |
(1,097) |
307,049 |
(337,403) |
307,050 |
| Legal
Reserves |
961,538 |
335,200 |
44,193 |
- |
- |
- |
55,133 |
58,164 |
703 |
27,949 |
28,071 |
1,625,628 |
(1,510,951) |
1,625,628 |
| Profit
retention reserve |
5,045,688 |
1,239,409 |
136,905 |
- |
- |
- |
443,457 |
- |
- |
186,658 |
4,377 |
9,000,505 |
(7,056,494) |
9,000,506 |
| Additional
proposed dividends |
- |
- |
- |
- |
- |
- |
117,100 |
166,380 |
4,655 |
42,454 |
73,645 |
131,211 |
(404,235) |
131,211 |
| Accumulated
profit |
- |
- |
111,619 |
(74,486) |
(108,493) |
(11,312) |
(286,635) |
- |
- |
- |
- |
- |
369,307 |
- |
| Attributable
to noncontrolling interests |
- |
- |
- |
- |
- |
- |
- |
- |
- |
- |
- |
- |
305,514 |
305,514 |
| TOTAL |
23,351,377 |
21,831,127 |
1,023,624 |
804,150 |
423,367 |
62,676 |
9,134,285 |
895,046 |
235,582 |
601,581 |
1,824,990 |
25,358,894 |
(29,727,630) |
55,819,074 |
| Exhibit III - ENERGY MARKET> DISTRIBUTION AND TOTAL MARKET |
| |
|
|
|
|
|
|
|
|
|
|
|
|
| Copel’s Total Market |
|
Number of Customers / Agreements |
|
Energy Sold (GWh) |
| |
Jun-24 |
Jun-23 |
∆% |
|
2Q24 |
2Q23 |
Δ% |
|
1H24 |
1H23 |
Δ% |
| |
|
|
|
|
|
|
|
|
|
|
|
|
| Copel DIS |
|
5,137,853 |
5,044,797 |
1.8 |
|
5,526 |
5,797 |
(4.7) |
|
11,384 |
11,452 |
(0.6) |
| Captive Market |
|
5,137,652 |
5,044,479 |
1.8 |
|
5,359 |
4,930 |
8.7 |
|
11,112 |
10,080 |
10.2 |
| Concessionaries and Licensees |
|
2 |
2 |
- |
|
25 |
24 |
4.2 |
|
49 |
46 |
6.2 |
| CCEE (Assigments MCSD EN) |
|
199 |
316 |
(37.0) |
|
35 |
49 |
(28.6) |
|
70 |
97 |
(28.3) |
| CCEE (MVE) |
|
- |
- |
- |
|
- |
- |
- |
|
- |
- |
- |
| CCEE (MCP) 2 |
|
- |
- |
- |
|
107 |
794 |
(86.5) |
|
154 |
1,229 |
(87.5) |
| Copel GeT |
|
519 |
386 |
34.5 |
|
4,039 |
3,953 |
2.2 |
|
8,696 |
8,514 |
2.1 |
| CCEAR (Copel DIS) |
|
4 |
3 |
33.3 |
|
30 |
29 |
3.4 |
|
64 |
62 |
3.2 |
| CCEAR (other concessionaries) |
|
119 |
118 |
0.8 |
|
569 |
879 |
(35.3) |
|
1,155 |
1,448 |
(20.2) |
| Free Customers |
|
- |
- |
- |
|
- |
- |
- |
|
- |
- |
- |
| Bilateral Agreements (Copel Mercado Livre) |
|
393 |
260 |
51.2 |
|
3,275 |
2,938 |
11.5 |
|
7,063 |
6,430 |
9.8 |
| Bilateral Agreements 1 |
|
3 |
5 |
(40.0) |
|
42 |
38 |
10.5 |
|
92 |
192 |
(52.1) |
| CCEE (MCP) 2 |
|
- |
- |
- |
|
123 |
69 |
78.3 |
|
322 |
382 |
(15.7) |
| Wind Farms Complex |
|
583 |
557 |
4.7 |
|
1,094 |
1,012 |
8.1 |
|
2,220 |
2,121 |
4.7 |
| |
|
15 |
15 |
- |
|
30 |
29 |
3.4 |
|
65 |
52 |
25.0 |
| CCEAR (other concessionaries) |
|
541 |
512 |
5.7 |
|
627 |
489 |
28.2 |
|
1,195 |
969 |
23.3 |
| CER |
|
10 |
10 |
- |
|
228 |
228 |
- |
|
464 |
454 |
2.2 |
| Bilateral Agreements (Copel Mercado Livre) |
|
6 |
8 |
(25.0) |
|
90 |
148 |
(39.2) |
|
179 |
270 |
(33.7) |
| Bilateral Agreements |
|
11 |
12 |
(8.3) |
|
119 |
118 |
0.8 |
|
240 |
249 |
(3.6) |
| CCEE (MCP) 2 |
|
- |
- |
- |
|
- |
- |
- |
|
77 |
127 |
(39.4) |
| Copel Mercado Livre |
|
1,532 |
1,719 |
(10.9) |
|
5,527 |
5,305 |
4.2 |
|
11,569 |
11,198 |
3.3 |
| Free Customers |
|
1,361 |
1,585 |
(14.1) |
|
2,621 |
2,921 |
(10.3) |
|
5,229 |
5,848 |
(10.6) |
| Bilateral Agreements (Group Companies) |
|
6 |
16 |
(62.5) |
|
129 |
68 |
89.7 |
|
283 |
68 |
316.2 |
| Bilateral Agreements |
|
165 |
118 |
39.8 |
|
2,747 |
2,219 |
23.8 |
|
5,960 |
5,039 |
18.3 |
| CCEE (MCP) 2 |
|
- |
- |
- |
|
30 |
97 |
(69.1) |
|
97 |
243 |
(60.1) |
| Total Copel |
|
5,140,487 |
5,047,459 |
1.8 |
|
16,186 |
16,067 |
0.7 |
|
33,869 |
33,285 |
1.8 |
| Eliminations (operations with Group companies) |
|
|
|
|
|
3,554 |
3,212 |
10.6 |
|
7,334 |
7,119 |
3.0 |
| Total Consolidated Copel |
|
|
|
|
|
12,632 |
12,855 |
(1.7) |
# |
26,535 |
26,166 |
1.4 |
Note: Not considering the energy from MRE (Energy Relocation Mechanism) and the energy from TPP Araucária sold in the CCEE Spot Market.
1 Includes Short Term Sales Agreements and CBR
2 Assured Power allocated in the period, after impact of the GSF.
CCEE: Electric Power Trade Chamber / CCEAR: Energy Purchase Agreements in the Regulated Market / MCP: Short Term Market / CER: Agreements Reserve Energy / MCSD EN - Mechanism for Compensation of Surpluses and Deficits of New Energy / MVE - MVE - Sale of energy to the free market through the Surplus Selling Mechanism. |
| |
|
|
|
|
|
|
|
|
|
|
|
|
| Copel’s Dis Market |
|
Number of Customers |
|
Consumed Energy (GWh) |
| |
Jun-24 |
Jun-23 |
Δ% |
|
2Q24 |
2Q23 |
Δ% |
|
1Q24 |
1Q23 |
Δ% |
| Residential |
|
4,252,182 |
4,161,476 |
2.2 |
|
2,419 |
2,114 |
14.4 |
|
5,102 |
4,369 |
16.8 |
| Industrial |
|
68,966 |
69,454 |
(0.7) |
|
3,227 |
3,143 |
2.7 |
|
6,251 |
6,092 |
2.6 |
| Captive |
|
67,486 |
68,260 |
(1.1) |
|
451 |
499 |
(9.7) |
|
885 |
973 |
(9.0) |
| Free |
|
1,480 |
1,194 |
24.0 |
|
2,777 |
2,644 |
5.0 |
|
5,366 |
5,118 |
4.8 |
| Commercial |
|
444,675 |
435,017 |
2.2 |
|
1,860 |
1,677 |
10.9 |
|
3,808 |
3,374 |
12.9 |
| Captive |
|
442,703 |
433,450 |
2.1 |
|
1,211 |
1,108 |
9.3 |
|
2,514 |
2,276 |
10.5 |
| Free |
|
1,972 |
1,567 |
25.8 |
|
648 |
569 |
14.0 |
|
1,295 |
1,098 |
17.9 |
| Rural |
|
319,352 |
326,887 |
(2.3) |
|
700 |
624 |
12.3 |
|
1,440 |
1,304 |
10.5 |
| Captive |
|
319,264 |
326,833 |
(2.3) |
|
647 |
584 |
10.8 |
|
1,337 |
1,224 |
9.3 |
| Free |
|
88 |
54 |
63.0 |
|
53 |
40 |
33.0 |
|
103 |
80 |
28.8 |
| Others |
|
56,041 |
54,472 |
2.9 |
|
648 |
626 |
3.5 |
|
1,296 |
1,243 |
4.3 |
| Captive |
|
56,017 |
54,460 |
2.9 |
|
631 |
625 |
1.1 |
|
1,274 |
1,239 |
2.8 |
| Free |
|
24 |
12 |
100.0 |
|
17 |
2 |
857.9 |
|
22 |
4 |
529.0 |
| Total Captive Market |
|
5,137,652 |
5,044,479 |
1.8 |
|
5,359 |
4,930 |
8.7 |
|
11,112 |
10,081 |
10.2 |
| Total Free Market |
|
3,564 |
2,827 |
26.1 |
|
3,495 |
3,254 |
7.4 |
|
6,786 |
6,300 |
7.7 |
| Supply to Concessionaries |
|
7 |
7 |
- |
|
259 |
238 |
8.7 |
|
499 |
460 |
8.5 |
| Total Grid Market |
|
5,141,223 |
5,047,313 |
1.9 |
|
9,113 |
8,423 |
8.2 |
|
18,396 |
16,841 |
9.2 |
| Micro and Mini Distributed Energy Generation |
|
361,460 |
277,977 |
30.0 |
|
(612) |
(421) |
45.1 |
|
(1,278) |
(852) |
50.0 |
| Total Billed Market |
|
|
|
|
|
8,501 |
8,001 |
6.2 |
|
17,118 |
15,989 |
7.1 |
| Exhibit III - ENERGY MARKET> TARIFFS |
| |
|
|
|
|
|
|
|
| Supply Tariff (R$/MWh) |
Amount Average MW |
Jun-23 |
Jun-22 |
Δ% |
Product Class* |
Validity* |
|
| Copel Geração e Transmissão |
|
|
|
|
|
|
|
| Auction CCEAR 2011 - 2040 ( HPP Mauá) |
95 |
294.51 |
283.09 |
4.0% |
SP100 |
07.01.2020 |
12.31.2040 |
| Auction CCEAR 2013 - 2042 (SHP Cavernoso II) |
7 |
318.47 |
305.81 |
4.1% |
SP100 |
01.01.2018 |
12.31.2042 |
| Auction - CCEAR 2015 - 2044 (HPP Colíder) |
121 |
225.64 |
216.84 |
4.1% |
SP89 |
01.01.2019 |
12.31.2044 |
| Auction - CCEAR 2018 - 2048 (HPP Baixo Iguaçu) |
35 |
234.60 |
224.93 |
4.3% |
SP89 |
11.12.2018 |
11.11.2048 |
| Auction - CCEAR 2009 - 2016 (Salto Caxias) |
|
|
247.01 |
- |
- |
- |
- |
| Auction - CCEAR 2024 - 2053 (SHP Bela Vista) |
14 |
262.14 |
|
- |
- |
- |
- |
| Copel Distribuição |
|
|
|
|
|
|
|
| Concession holders in the State of Paraná |
14 |
274.92 |
265.11 |
3.7% |
- |
- |
- |
| Total / Tariff Weighted Average Supply |
285 |
256.13 |
233.45 |
9.7% |
- |
- |
- |
| Contains PIS and COFINS. Net of ICMS. |
*GSF renegotiation
|
|
|
|
| |
|
|
|
|
|
|
|
| Purchase Tariff - Copel Distribuição (R$/MWh) |
Amount Average MW |
Jun-23 |
Jun-22 |
Δ% |
|
|
|
| Itaipu 1 |
493.2 |
244.25 |
247.70 |
-1.4% |
|
|
|
| Auction – CCEAR 2010 – H30 |
65.1 |
304.15 |
292.64 |
3.9% |
|
|
|
| Auction – CCEAR 2010 – T15 2 |
60.1 |
361.94 |
193.39 |
87.2% |
|
|
|
| Auction – CCEAR 2011 – H30 |
53.7 |
313.58 |
301.71 |
3.9% |
|
|
|
| Auction – CCEAR 2011 – T15 2 |
53.7 |
264.39 |
247.77 |
6.7% |
|
|
|
| Auction – CCEAR 2012 – T15 2 |
107.5 |
186.17 |
177.61 |
4.8% |
|
|
|
| Auction – CCEAR 2016 – T20 2 |
26.6 |
229.22 |
221.18 |
3.6% |
|
|
|
| Angra |
97.7 |
356.25 |
339.88 |
4.8% |
|
|
|
| CCGF 3 |
415.4 |
186.90 |
135.00 |
38.4% |
|
|
|
| Santo Antônio |
128.3 |
194.61 |
187.24 |
3.9% |
|
|
|
| Jirau |
213.5 |
171.22 |
164.75 |
3.9% |
|
|
|
| Others Auctions 4 |
724.7 |
227.16 |
209.91 |
8.2% |
|
|
|
| Total / Average Purchuse Tariff |
2,439.5 |
228.63 |
206.49 |
10.7% |
|
|
|
| Contains PIS and COFINS |
| 1 Furnas transport charge not included. |
| 2 Average auction price restated according as bilateral payment to vendors. It does not include hiring effects recorded by the CCEE. |
| 3 Contract of quotas of assured power of those HPPs which concessions were extended pursuant the new rules of Law 12783/13. |
| 4 Products average price, does not include PROINFA. |
| *The table has been updated for all periods as new calculation methodology for average prices, a result of the 4th phase of the Public Hearing 78/2011 Aneel approved on 03.28.2016. |
| |
|
|
|
|
|
|
|
| Retail Tariff - Copel Distribuição (R$/MWh) |
|
Jun-23 |
Jun-22 |
Δ% |
|
|
|
| |
|
|
|
|
|
|
|
| Industrial |
|
555.88 |
504.17 |
10.3% |
|
|
|
| Residential |
|
546.46 |
528.18 |
3.5% |
|
|
|
| Commercial |
|
609.36 |
594.03 |
2.6% |
|
|
|
| Rural |
|
596.42 |
544.95 |
9.4% |
|
|
|
| Other |
|
597.68 |
409.25 |
46.0% |
|
|
|
| Retail Tariff supply average tariff |
|
615.21 |
579.01 |
6.3% |
|
|
|
| Demand average tariff (R$/kW) |
|
37.85 |
29.62 |
27.8% |
|
|
|
| Does not consider tariff flags, Pis/Pasep and net of ICMS. |
| Exhibit III - ENERGY MARKET> ELECTRICITY PURCHASED AND CHARGES |
| |
|
|
|
|
|
R$'000 |
| Electricity Purchased for Resale |
2Q24 |
2Q23 |
Δ% |
1H24 |
1H23 |
Δ% |
| Purchase of energy in the regulated party - CCEAR |
976,498 |
906,501 |
7.7 |
1,932,015 |
1,831,966 |
5.5 |
| Itaipu Binacional |
241,436 |
252,335 |
(4.3) |
454,522 |
465,252 |
(2.3) |
| Câmara de Comercialização de Energia - CCEE |
106,772 |
125,269 |
(14.8) |
172,606 |
224,815 |
(23.2) |
| Micro and mini generators and customer repurchase |
381,975 |
250,008 |
52.8 |
809,918 |
499,177 |
62.3 |
| Proinfa |
84,495 |
92,063 |
(8.2) |
168,712 |
183,476 |
(8.0) |
| Bilateral Agreements |
385,594 |
458,634 |
(15.9) |
789,163 |
910,577 |
(13.3) |
| Fair value in the purchase and sale of energy |
31,042 |
- |
- |
43,881 |
- |
- |
| (-) PIS/Pasep and Cofins |
(194,878) |
(207,218) |
(6.0) |
(384,416) |
(416,696) |
(7.7) |
| TOTAL |
2,012,934 |
1,877,592 |
7.2 |
3,986,401 |
3,698,567 |
7.8 |
| |
|
|
|
|
|
|
| |
|
|
|
|
|
R$'000 |
| Charges of the main distribution and transmission grid |
2Q24 |
2Q23 |
Δ% |
1H24 |
1H23 |
Δ% |
| Itaipu transportation charges |
56,470 |
39,257 |
43.8 |
109,586 |
75,969 |
44.3 |
| System Service Charges - ESS |
9,375 |
7,996 |
17.2 |
22,458 |
12,035 |
86.6 |
| System usage charges |
665,902 |
591,830 |
12.5 |
1,328,416 |
1,165,169 |
14.0 |
| Charge reserve energy - EER |
116,058 |
114,099 |
1.7 |
221,736 |
252,754 |
(12.3) |
| (-) PIS / Pasep and Cofins taxes on charges for use of power grid |
(87,521) |
(76,004) |
15.2 |
(173,838) |
(152,291) |
14.1 |
| TOTAL |
760,284 |
677,178 |
12.3 |
1,508,358 |
1,353,636 |
11.4 |
| Exhibit III - ENERGY MARKET> ENERGY BALANCE |
| |
|
|
|
|
(average MW) |
| Energy Balance - Copel GET - Jun-24 |
2024 |
2025 |
2026 |
2027 |
2028 |
| Own Resources GeT |
2,084 |
2,062 |
2,068 |
2,071 |
2,079 |
| GeT (1) |
1,492 |
1,470 |
1,473 |
1,466 |
1,454 |
| GPS (CCGF) (2) |
73 |
73 |
73 |
73 |
73 |
| Bela Vista + FDA |
519 |
519 |
522 |
532 |
552 |
| Own Resources SPP and Wind Farm |
544 |
544 |
544 |
544 |
544 |
| Purchases |
73 |
64 |
- |
- |
- |
| TOTAL OWN RESOURCES + SOLD |
2,701 |
2,670 |
2,612 |
2,615 |
2,623 |
| TOTAL SOLD |
2,365 |
2,243 |
1,729 |
1,489 |
1,225 |
| Sales (Regulated) |
766 |
781 |
781 |
781 |
780 |
| Sales (Regulated) % |
28% |
29% |
30% |
30% |
30% |
| Sales (Free Market) |
1,599 |
1,462 |
948 |
708 |
445 |
| Sales (Free Market) % |
60% |
55% |
37% |
27% |
17% |
| Total Available |
334 |
427 |
882 |
1125 |
1396 |
| Total Available (%) |
12% |
16% |
33% |
43% |
53% |
| Avarege price of energy sold (R$) |
175.71 |
172.36 |
179.33 |
184.88 |
198.13 |
| Reference: June/24 |
| Note: Considers Assured Power updated by Ordinance No. 709/2022 for: FDA, Segredo and Salto Caxias. |
| (1) Includes Mauá and Baixo Iguaçu Power Plants (proportional to the stake in the project) and GPS 30% (ex-CCGF). Does not include Elejor and Foz do Chopim. |
| (2) GPS 70% (quota regime). |
| (3) Does not include Voltália Wind Complex. |
| (3) The GPS CCGF RAG is not considered in the calculation of average prices. |

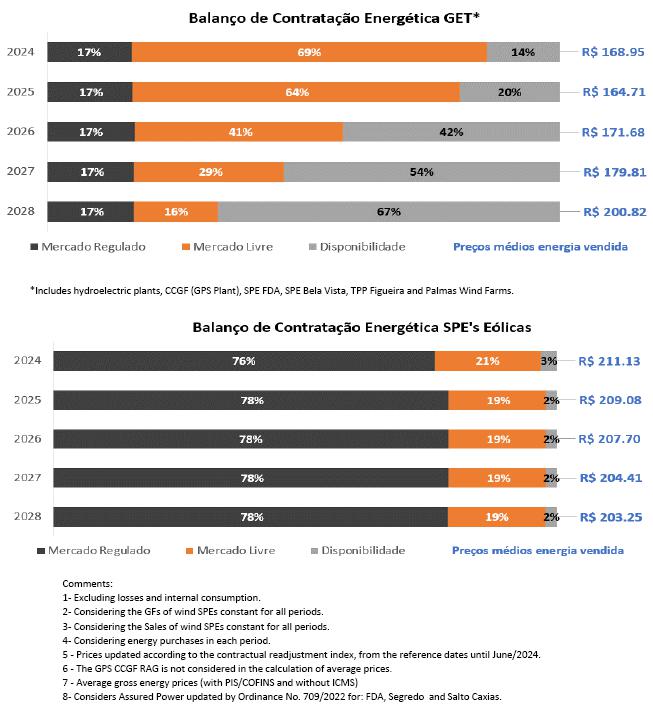
| Exhibit III - ENERGY MARKET> WIND POWER PRICES |
| Wind Farms - Sold |
Auction ¹ |
Price (R$)² |
Certification |
Amount
MW average/year |
Start of Supply |
End of
Supply |
| São Bento Energia, Invest. e Part. S.A. |
|
|
|
|
|
|
| GE Boa Vista S.A. |
2º LFA
(08/26/2010) |
307.89 |
P50 |
5.70 |
01.01.2013 |
12.31.2032 |
| GE Farol S.A. |
298.92 |
P50 |
9.10 |
| GE Olho D’Água S.A. |
298.92 |
P50 |
14.90 |
| GE São Bento do Norte S.A. |
298.92 |
P50 |
14.00 |
| Copel Brisa Potiguar S.A. |
|
|
|
|
|
|
| Nova Asa Branca I Energias Renováveis S.A. |
2º LFA
(08/26/2010) |
302.11 |
P50 |
13.20 |
01.01.2013 |
12.31.2032 |
| Nova Asa Branca II Energias Renováveis S.A. |
302.11 |
P50 |
12.80 |
| Nova Asa Branca III Energias Renováveis S.A. |
302.11 |
P50 |
12.50 |
| Nova Eurus IV Energias Renováveis S.A. |
302.11 |
P50 |
13.70 |
| Santa Maria Energias Renováveis S.A. |
4º LER
(08/18/2011) |
212.91 |
P50 |
15.70 |
07.01.2014 |
06.30.2034 |
| Santa Helena Energias Renováveis S.A. |
212.91 |
P50 |
16.00 |
| Ventos de Santo Uriel S.A. |
211.26 |
P50 |
9.00 |
| Cutia |
|
|
|
|
|
|
| UEE Cutia S.A. |
6º LER
(10/31/2014) |
250.44 |
P90 |
9.60 |
10.01.2017 |
09.30.2037 |
| UEE Esperança do Nordeste S.A. |
250.44 |
P90 |
9.10 |
| UEE Guajiru S.A. |
250.44 |
P90 |
8.30 |
| UEE Jangada S.A. |
250.44 |
P90 |
10.30 |
| UEE Maria Helena S.A. |
250.44 |
P90 |
12.00 |
| UEE Paraíso dos Ventos do Nordeste S.A. |
250.44 |
P90 |
10.60 |
| UEE Potiguar S.A. |
250.44 |
P90 |
11.30 |
| Bento Miguel |
|
|
|
|
|
|
| CGE São Bento do Norte I S.A. |
20ª LEN
(11/28/2014) |
237.22 |
P90 |
9.70 |
01.01.2019 |
12.31.2038 |
| CGE São Bento do Norte II S.A. |
237.22 |
P90 |
10.00 |
| CGE São Bento do Norte III S.A. |
237.22 |
P90 |
9.60 |
| CGE São Miguel I S.A. |
237.22 |
P90 |
8.70 |
| CGE São Miguel II S.A. |
237.22 |
P90 |
8.40 |
| CGE São Miguel III S.A. |
237.22 |
P90 |
8.40 |
| Vilas |
|
|
|
|
|
|
| Vila Ceará I (Antiga Vila Paraíba IV) |
28ª LEN
(08/31/2018) |
127.55 |
P90 |
8.20 |
01.01.2024 |
12.31.2043 |
| Vila Maranhão I |
127.55 |
P90 |
8.30 |
| Vila Maranhão II |
127.55 |
P90 |
8.30 |
| Vila Maranhão III (Antiga Vila Paraíba III) |
127.55 |
P90 |
8.20 |
| Vila Mato Grosso (Antiga Vila Alagoas III) |
29ª LEN
(06/28/2019) |
106.40 |
P90 |
3.30 |
01.01.2023 |
12.31.2042 |
| Jandaira |
|
|
|
|
|
|
| Jandaira I |
30ª LEN
(10/18/2019) |
130.12 |
P90 |
1.60 |
01.01.2025 |
12.31.2044 |
| Jandaira II |
130.12 |
P90 |
4.10 |
| Jandaira III |
130.12 |
P90 |
4.40 |
| Jandaira IV |
130.12 |
P90 |
4.30 |
| Aventura |
|
|
|
|
|
|
| Aventura II |
26º LEN
(20/12/2017) |
137.56 |
P90 |
11.70 |
01.01.2023 |
12.31.2042 |
| Aventura III |
137.56 |
P90 |
12.80 |
| Aventura IV |
137.56 |
P90 |
14.10 |
| Aventura V |
137.56 |
P90 |
15.00 |
| Santa Rosa & Mundo Novo |
|
|
|
|
|
|
| Santa Rosa & Mundo Novo I |
26º LEN
(20/12/2017) |
140.39 |
P90 |
16.50 |
01.01.2023 |
12.31.2042 |
| Santa Rosa & Mundo Novo II |
140.39 |
P90 |
17.00 |
| Santa Rosa & Mundo Novo III |
140.39 |
P90 |
18.00 |
| Santa Rosa & Mundo Novo IV |
140.39 |
P90 |
7.50 |
| Santa Rosa & Mundo Novo V |
140.39 |
P90 |
8.10 |
| Voltália3 |
|
|
|
|
|
|
| Carnaúbas |
04ª LER
(08/18/2011) |
206.52 |
- |
13.10 |
07.01.2014 |
06.30.2034 |
| Reduto |
206.52 |
- |
13.90 |
| Santo Cristo |
206.52 |
- |
14.80 |
| São João |
206.52 |
- |
14.30 |
| ¹LFA - Alternative Sources Auction/LER - Reserve Energy Auction/LEN - New Energy Auction. |
| ² Price updated by IPCA until Jun/24 (Reference Jul/24). Source: CCEE |
| 3 Values presented refer to 100% of the Complex. Copel has a 49% stake in the project. |
| Exhibit III - ENERGY MARKET> ENERGY FLOW |
| |
|
|
|
|
|
|
|
|
|
|
|
GWh |
| Energy Flow |
COPEL DIS |
COPEL GET
+ FDA + BELA VISTA |
WIND POWER |
COPEL COM |
ELIMINATIONS |
CONSOLIDATED |
| 2Q24 |
2Q23 |
2Q24 |
2Q23 |
2Q24 |
2Q23 |
2Q24 |
2Q23 |
2Q24 |
2Q23 |
2Q24 |
2Q23 |
| Own Generation |
|
|
5,389 |
3,628 |
682 |
703 |
|
|
|
|
6,071 |
4,331 |
| Purchased energy |
5,707 |
5,874 |
177 |
397 |
36 |
0 |
5,527 |
5,305 |
3,554 |
3,212 |
7,893 |
8,364 |
| Copel Mercado Livre |
|
|
93 |
68 |
36 |
0 |
|
|
129 |
68 |
0 |
0 |
| Companies of the group |
60 |
58 |
|
|
|
|
3,365 |
3,086 |
3,425 |
3,144 |
0 |
0 |
| Itaipu |
1,134 |
1,187 |
|
|
|
|
|
0 |
|
|
1,134 |
1,187 |
| Auction – CCEAR |
3,192 |
3,199 |
|
|
|
|
|
0 |
|
|
3,192 |
3,199 |
| CCEE (MCP) |
57 |
|
|
296 |
|
|
|
0 |
|
|
57 |
296 |
| Angra |
213 |
217 |
|
|
|
|
|
|
|
|
213 |
217 |
| CCGF |
933 |
1,092 |
|
|
|
|
|
|
|
|
933 |
1,092 |
| Proinfa |
105 |
103 |
|
|
|
|
|
|
|
|
105 |
103 |
| Other (1) |
13 |
18 |
|
|
0 |
|
2,162 |
2,209 |
|
|
2,175 |
2,227 |
| Elejor |
|
|
|
|
|
|
|
10 |
|
|
0 |
10 |
| Dona Francisca |
|
|
33 |
33 |
|
|
|
|
|
|
33 |
33 |
| MRE Receipt |
|
|
51 |
|
|
|
|
|
|
|
51 |
0 |
| Avaiable |
5,707 |
5,874 |
5,566 |
4,025 |
718 |
703 |
5,527 |
5,305 |
3,554 |
3,212 |
13,964 |
12,695 |
| Captive Market |
5,359 |
4,930 |
|
|
|
|
|
|
|
|
5,359 |
4,930 |
| Concessionaires (2) |
25 |
24 |
|
|
|
|
|
|
|
|
25 |
24 |
| CCEE concessionaire supply (3) |
|
|
42 |
38 |
|
|
|
|
|
|
42 |
38 |
| CCEE (MCSD EN Assignments) (4) |
35 |
49 |
|
|
|
|
|
|
|
|
35 |
49 |
| CCEE (MVE) (5) |
|
|
|
|
|
|
|
|
|
|
0 |
0 |
| CCEE (MCP) (6) |
107 |
794 |
123 |
69 |
-45 |
-63 |
30 |
97 |
|
|
215 |
897 |
| Free Customers |
|
|
|
|
|
|
2,621 |
2,921 |
|
|
2,621 |
2,921 |
| Bilateral Agreements |
|
|
0 |
0 |
119 |
118 |
2,747 |
2,219 |
|
|
2,866 |
2,337 |
| Auction – CCEAR (7) |
|
|
569 |
879 |
627 |
489 |
|
|
|
|
1,196 |
1368 |
| MRE assignment (8) |
|
|
1,527 |
72 |
|
|
|
|
|
|
1,527 |
72 |
| CER (9) |
|
|
|
|
228 |
228 |
|
|
|
|
228 |
228 |
| Copel Mercado Livre |
|
|
3,275 |
2,938 |
90 |
148 |
|
|
3,365 |
3,086 |
0 |
0 |
| Companies of the group |
|
|
30 |
29 |
30 |
29 |
129 |
68 |
189 |
126 |
0 |
0 |
| Losses and Differences (10) |
181 |
77 |
|
|
-331 |
-246 |
|
|
|
|
-150 |
-169 |
| |
|
|
|
|
|
|
|
|
|
|
|
|
| (1) Others: Energy purchased by Copel Comercialização. Includes MCSD EM Assignments of Copel Distribuição (purchase) |
| (2) Energy supply to concessionaires and licensees with their own market below 500GWh/year |
| (3) Supply of energy to CCEE's agent distributor, through a Regulated Bilateral Contract Agreement - CBR |
| (4) Assignments MCSD EN - Contractual assignments to other distributors through the New Energy Surplus and Deficit Compensation Mechanism |
| (5) CCEE (MVE): Financial settlement of energy surpluses from the distributor to the free market through the Surplus Sale Mechanism |
| (6) CCEE (MCP): Electric Energy Commercialization Chamber (Spot Market). |
| (7) CCEAR: Energy Trading Agreement in the Regulated Environment. |
| (8) MRE: Energy Reallocation Mechanism. |
| (9) CER: Reserve Energy Contract. |
| (10) Considers the effects of Mini and Micro Distributed Generation (MMGD). |
| (11) CG: Submarket Center of Gravity (difference between billed and received energy at the CG). |
| It does not consider the energy produced by UTE Araucária sold on the spot market (MCP). |
| |
|
|
|
|
|
|
|
|
|
|
|
|
| |
|
|
|
|
|
|
|
|
|
|
|
GWh |
| Energy Flow |
COPEL DIS |
COPEL GET
+ FDA + BELA VISTA |
WIND POWER |
COPEL COM |
ELIMINATIONS |
CONSOLIDATED |
| 1H24 |
1H23 |
1H24 |
1H23 |
1H24 |
1H23 |
1H24 |
1H23 |
1H24 |
1H23 |
1H24 |
1H23 |
| Own Generation |
- |
- |
11,387 |
9,126 |
1,323 |
1,536 |
- |
- |
|
|
12,710 |
10,662 |
| Purchased energy |
11,857 |
12,011 |
263 |
444 |
194 |
106 |
11,569 |
11,198 |
7,648 |
6,987 |
16,235 |
16,772 |
| Copel Mercado Livre |
- |
- |
93 |
68 |
190 |
- |
- |
- |
283 |
68 |
0 |
0 |
| Companies of the group |
124 |
113 |
- |
- |
- |
106 |
7,241 |
6,700 |
7,365 |
6,919 |
0 |
0 |
| Itaipu |
2,268 |
2,361 |
- |
- |
- |
- |
- |
- |
- |
- |
2,268 |
2,361 |
| Auction – CCEAR |
6,582 |
6,557 |
- |
- |
- |
- |
- |
- |
- |
- |
6,582 |
6,557 |
| CCEE (MCP) |
239 |
- |
- |
296 |
- |
- |
- |
- |
- |
- |
239 |
296 |
| Angra |
426 |
432 |
- |
- |
- |
- |
- |
- |
- |
- |
426 |
432 |
| CCGF |
1,981 |
2,308 |
- |
- |
- |
- |
- |
- |
- |
- |
1,981 |
2,308 |
| Proinfa |
211 |
204 |
- |
- |
- |
- |
- |
- |
- |
- |
211 |
204 |
| Other (1) |
26 |
36 |
- |
- |
4 |
- |
4,328 |
4,478 |
- |
- |
4,358 |
4,514 |
| Elejor |
- |
- |
- |
- |
- |
- |
- |
20 |
- |
- |
0 |
20 |
| Dona Francisca |
- |
- |
66 |
66 |
- |
- |
- |
- |
- |
- |
66 |
66 |
| MRE Receipt |
- |
- |
104 |
14 |
- |
- |
- |
- |
- |
- |
104 |
14 |
| Avaiable |
11,857 |
12,011 |
11,650 |
9,570 |
1,517 |
1642 |
11,569 |
11,198 |
7,648 |
6,987 |
28,945 |
27,434 |
| Captive Market |
11,112 |
10,080 |
- |
- |
- |
- |
- |
- |
- |
- |
11,112 |
10,080 |
| Concessionaires (2) |
49 |
46 |
- |
- |
- |
- |
- |
- |
- |
- |
49 |
46 |
| CCEE concessionaire supply (3) |
- |
- |
88 |
85 |
- |
- |
- |
- |
- |
- |
88 |
85 |
| CCEE (MCSD EN Assignments) (4) |
70 |
97 |
- |
- |
- |
- |
- |
- |
- |
- |
70 |
97 |
| CCEE (MVE) (5) |
- |
- |
- |
- |
- |
- |
- |
- |
- |
- |
0 |
0 |
| CCEE (MCP) (6) |
154 |
1,229 |
322 |
382 |
32 |
64 |
97 |
243 |
- |
- |
605 |
1,918 |
| Free Customers |
- |
- |
- |
- |
- |
- |
5,229 |
5,848 |
- |
- |
5,229 |
5,848 |
| Bilateral Agreements |
- |
- |
4 |
106 |
240 |
249 |
5,960 |
5,039 |
- |
106 |
6,204 |
5,288 |
| Auction – CCEAR (7) |
- |
- |
1,155 |
1,448 |
1,195 |
969 |
- |
- |
- |
- |
2,350 |
2417 |
| MRE assignment (8) |
- |
- |
2,954 |
1,057 |
- |
- |
- |
- |
- |
- |
2,954 |
1,057 |
| CER (9) |
- |
- |
- |
- |
464 |
454 |
- |
- |
- |
- |
464 |
454 |
| Copel Mercado Livre |
- |
- |
7,063 |
6,430 |
178 |
270 |
- |
- |
7,241 |
6,700 |
0 |
0 |
| Companies of the group |
- |
- |
64 |
62 |
61 |
52 |
283 |
68 |
407 |
181 |
1 |
1 |
| Losses and Differences (10) |
472 |
559 |
- |
- |
(653) |
(416) |
- |
- |
- |
- |
-181 |
143 |
| |
|
|
|
|
|
|
|
|
|
|
|
|
| (1) Others: Energy purchased by Copel Comercialização. Includes MCSD EM Assignments of Copel Distribuição (purchase) |
| (2) Energy supply to concessionaires and licensees with their own market below 500GWh/year |
| (3) Supply of energy to CCEE's agent distributor, through a Regulated Bilateral Contract Agreement - CBR |
| (4) Assignments MCSD EN - Contractual assignments to other distributors through the New Energy Surplus and Deficit Compensation Mechanism |
| (5) CCEE (MVE): Financial settlement of energy surpluses from the distributor to the free market through the Surplus Sale Mechanism |
| (6) CCEE (MCP): Electric Energy Commercialization Chamber (Spot Market). |
| (7) CCEAR: Energy Trading Agreement in the Regulated Environment. |
| (8) MRE: Energy Reallocation Mechanism. |
| (9) CER: Reserve Energy Contract. |
| (10) Considers the effects of Mini and Micro Distributed Generation (MMGD). |
| (11) CG: Submarket Center of Gravity (difference between billed and received energy at the CG). |
| It does not consider the energy produced by UTE Araucária sold on the spot market (MCP). |
| Exhibit III - ENERGY MARKET> ENERGY FLOW |
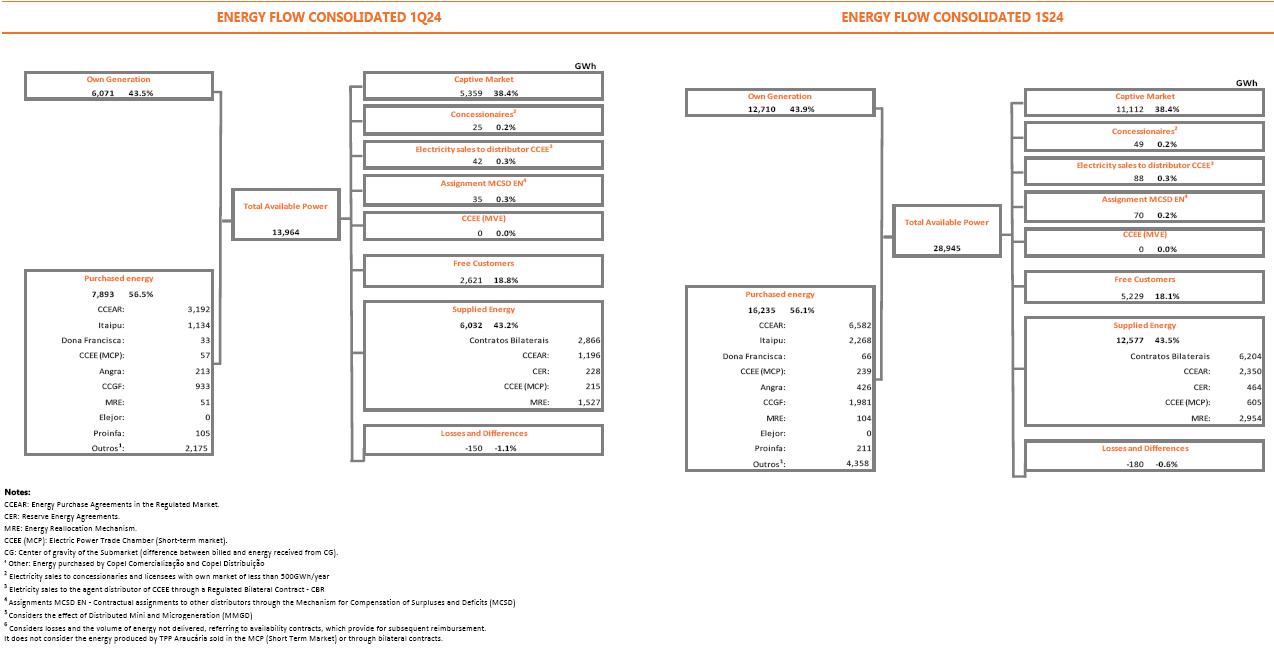
| Exhibit IV - OPERATIONAL DATA> INDICATORS SUMMARY |
| MANAGEMENT |
|
|
|
|
|
|
| Copel Staff List |
2019 |
2020 |
2021 |
2022 |
2023 |
jun-24 |
| Geração e Transmissão |
1,620 |
1,533 |
1,523 |
1,487 |
1,477 |
1,407 |
| Distribuição |
4,964 |
4,641 |
4,430 |
4,257 |
4,203 |
4,058 |
| Telecomunicações |
412 |
355 |
- |
- |
- |
- |
| Holding |
61 |
96 |
169 |
84 |
83 |
77 |
| Comercialização |
38 |
42 |
44 |
47 |
41 |
42 |
| Serviços |
- |
- |
- |
217 |
- |
- |
| TOTAL |
7,095 |
6,667 |
6,166 |
6,092 |
5,804 |
5,584 |
| |
|
|
|
|
|
|
| Cotrolated Staff List |
2019 |
2020 |
2021 |
2022 |
2023 |
jun-24 |
| Compagás |
148 |
142 |
133 |
132 |
129 |
126 |
| UEG Araucária |
16 |
17 |
15 |
15 |
14 |
13 |
| Elejor |
7 |
7 |
7 |
7 |
7 |
7 |
| |
|
|
|
|
|
|
| GENERATION |
|
|
|
|
|
|
| Copel GET |
Amount |
Installed
Capacity (MW) |
Assured Power
(Average MW) |
| Hydroelectric |
18 |
|
4,868.5 |
|
2,067.9 |
|
| Thermoelectric |
1 |
|
20.0 |
|
17.7 |
|
| Wind |
43 |
|
1,130.2 |
|
561.3 |
|
Copel GET
(Interest) |
|
Proportional installed
capacity (MW) |
Proporcional Assured Power
(Average MW) |
| Hydroelectric |
3 |
|
299.6 |
|
155.2 |
|
| Total Copel GET |
|
|
6,318.3 |
|
2,802.1 |
|
| Other Interest Copel |
|
Proportional installed
capacity (MW) |
Proporcional Assured Power
(Average MW) |
| Hydroelectric |
5 |
|
201.3 |
|
109.7 |
|
| Wind |
4 |
|
53.2 |
|
28.0 |
|
| Solar |
1 |
|
1.1 |
|
- |
|
| Total Other Interest |
10 |
|
255.6 |
|
137.7 |
|
| TOTAL Copel Group |
|
|
6,573.9 |
|
2,939.8 |
|
| |
|
|
|
|
|
|
| TRANSMISSION |
|
|
|
|
|
|
| Copel GeT |
Amount |
|
APR (R$ million) |
| Transmission Lines (km) |
|
3,705 |
|
1,062.2 |
| Substation (amount) |
|
45 |
|
| Interest |
Amount |
|
Proporcional APR (R$ million) |
| Transmission Lines (km) |
|
5,980 |
|
532.6 |
| Substation (amount) |
|
8 |
|
| TOTAL |
TL |
9,685 |
|
1,594.8 |
| Substation |
53 |
|
| |
|
|
|
|
|
|
| DISTRIBUTION |
|
|
|
|
|
|
| Distribution lines (km) |
212,926 |
|
|
Captive customers |
5,137,652 |
|
| Substations |
396 |
|
|
Customers by distribution employee |
1,266 |
|
| Installed power substations (MVA) |
12,088 |
|
|
DEC (in hundredths of an hour and minute) |
5.82 |
|
| Municipalities served |
395 |
|
|
FEC (number of outages) |
5.55 |
|
| Locations served |
1,068 |
|
|
|
|
|
| |
|
|
|
|
|
|
| MERCADO LIVRE |
|
|
|
|
|
|
| Number of contracts |
1,532 |
|
|
|
|
|
| Energy sold (GWh) |
5,527 |
|
|
|
|
|
| Exhibit IV - OPERATIONAL DATA> GENERATION |
| |
|
|
|
|
| COPEL GET |
|
|
|
|
| |
Installed
Capacity (MW) |
Assured Power
(Average MW) |
Generation 1S24
(GWh)* |
Concession Expires |
| Hydroelectric Power Plants |
4,868.5 |
2,067.9 |
11,231.2 |
|
| Large hydroelectric power plant (HPP) |
4,772.0 |
2,006.8 |
10,987.6 |
|
| Gov. Bento Munhoz da Rocha Netto (Foz do Areia)(5) |
1,676.0 |
575.3 |
3,137.8 |
12.21.2024 |
| Gov. Ney Aminthas de B. Braga (Segredo)(5) |
1,260.0 |
558.3 |
3,191.0 |
09.25.2032 |
| Gov. José Richa (Salto Caxias)(5) |
1,240.0 |
575.4 |
3,289.8 |
03.20.2033 |
| Gov. Parigot de Souza (1)(5) |
260.0 |
103.6 |
624.2 |
01.03.2053 |
| - Regime de Cotas (70%) |
182.0 |
72.5 |
436.9 |
| - Copel GeT(30%) |
78.0 |
31.1 |
187.3 |
| Colíder(5) |
300.0 |
178.1 |
662.8 |
01.30.2046 |
| Guaricana(5) |
36.0 |
16.1 |
82.1 |
07.21.2028 |
| Small hydroelectric power station (SHP) |
86.9 |
55.9 |
221.6 |
|
| Bela Vista(2) |
29.8 |
18.6 |
72.3 |
01.02.2041 |
| Cavernoso (5) |
1.3 |
1.0 |
0.5 |
06.23.2033 |
| Cavernoso II(5) |
19.0 |
10.6 |
31.7 |
12.06.2050 |
| Chaminé (5) |
18.0 |
11.6 |
58.8 |
08.02.2028 |
| Apucaraninha (5) |
10.0 |
6.7 |
26.3 |
01.27.2027 |
| Derivação do Rio Jordão (5) |
6.5 |
5.9 |
25.9 |
06.21.2032 |
| São Jorge (5) |
2.3 |
1.5 |
6.2 |
07.24.2026 |
| hydroelectric power plant (HPP) |
9.6 |
5.2 |
21.9 |
|
| Marumbi |
4.8 |
2.4 |
14.6 |
(6) |
| Chopim I |
2.0 |
1.5 |
2.8 |
(3) |
| Melissa |
1.0 |
0.6 |
1.2 |
(3) |
| Salto do Vau |
0.9 |
0.6 |
3.2 |
(3) |
| Pitangui |
0.9 |
0.1 |
0.2 |
(3) |
| Thermal Power Plant |
20.0 |
17.7 |
2.3 |
|
| Figueira |
20.0 |
17.7 |
2.3 |
03.27.2019 |
| Wind Power Plants |
1,130.2 |
561.3 |
1,308.5 |
|
| Eólica de Palmas (4) |
2.5 |
0.4 |
1.3 |
09.29.2029 |
| São Bento Energia, Invest. e Part. S.A. |
94.0 |
38.1 |
89.0 |
|
| GE Boa Vista S.A. |
14.0 |
5.2 |
10.2 |
04.28.2046 |
| GE Farol S.A. |
20.0 |
8.8 |
19.0 |
04.20.2046 |
| GE Olho D’Água S.A. |
30.0 |
12.8 |
31.0 |
06.01.2046 |
| GE São Bento do Norte S.A. |
30.0 |
11.3 |
28.9 |
05.19.2046 |
| Copel Brisa Potiguar S.A. |
183.6 |
89.4 |
154.4 |
|
| Nova Asa Branca I Energias Renováveis S.A. |
27.0 |
12.1 |
22.6 |
04.25.2046 |
| Nova Asa Branca II Energias Renováveis S.A. |
27.0 |
11.9 |
21.6 |
05.31.2046 |
| Nova Asa Branca III Energias Renováveis S.A. |
27.0 |
12.3 |
19.7 |
05.31.2046 |
| Nova Eurus IV Energias Renováveis S.A. |
27.0 |
12.4 |
25.2 |
04.27.2046 |
| Santa Maria Energias Renováveis S.A. |
29.7 |
15.7 |
18.3 |
05.08.2047 |
| Santa Helena Energias Renováveis S.A. |
29.7 |
16.0 |
32.0 |
04.09.2047 |
| Ventos de Santo Uriel S.A. |
16.2 |
9.0 |
15.2 |
04.09.2047 |
| Complexo Eólico Cutia |
180.6 |
71.4 |
197.9 |
|
| UEE Cutia S.A. |
23.1 |
9.6 |
26.8 |
01.05.2042 |
| UEE Esperança do Nordeste S.A. |
27.3 |
9.1 |
25.1 |
05.11.2050 |
| UEE Guajiru S.A. |
21.0 |
8.3 |
20.1 |
01.05.2042 |
| UEE Jangada S.A. |
27.3 |
10.3 |
33.4 |
01.05.2042 |
| UEE Maria Helena S.A. |
27.3 |
12.0 |
31.6 |
01.05.2042 |
| UEE Paraíso dos Ventos do Nordeste S.A. |
27.3 |
10.6 |
30.0 |
05.11.2050 |
| UEE Potiguar S.A. |
27.3 |
11.5 |
31.0 |
05.11.2050 |
| Complexo Eólico Bento Miguel |
132.3 |
58.7 |
136.7 |
|
| CGE São Bento do Norte I S.A. |
23.1 |
10.1 |
26.5 |
08.04.2050 |
| CGE São Bento do Norte II S.A. |
23.1 |
10.8 |
27.0 |
08.04.2050 |
| CGE São Bento do Norte III S.A. |
23.1 |
10.2 |
22.4 |
08.04.2050 |
| CGE São Miguel I S.A. |
21.0 |
9.3 |
20.3 |
08.04.2050 |
| CGE São Miguel II S.A. |
21.0 |
9.1 |
20.2 |
08.04.2050 |
| CGE São Miguel III S.A. |
21.0 |
9.2 |
20.3 |
08.04.2050 |
| Complexo Eólico Vilas (8) |
186.7 |
98.6 |
189.9 |
|
| Vila Ceará I (Antiga Vila Paraíba IV) |
32.0 |
17.8 |
34.1 |
01.14.2054 |
| Vila Maranhão I |
32.0 |
17.8 |
34.5 |
01.11.2054 |
| Vila Maranhão II |
32.0 |
17.8 |
34.8 |
01.14.2054 |
| Vila Maranhão III (Antiga Vila Paraíba III) |
32.0 |
16.6 |
32.2 |
01.14.2054 |
| Vila Mato Grosso (Antiga Vila Alagoas III) |
58.9 |
28.6 |
54.3 |
12.06.2054 |
| Complexo Jandaira |
90.1 |
46.9 |
112.3 |
|
| Jandaira I |
10.4 |
5.6 |
16.2 |
04.02.2055 |
| Jandaira II |
24.3 |
12.3 |
30.2 |
04.02.2055 |
| Jandaira III |
27.7 |
14.8 |
36.7 |
04.02.2055 |
| Jandaira IV |
27.7 |
14.2 |
29.1 |
04.02.2055 |
| Aventura 9 |
105.0 |
65.0 |
186.2 |
|
| Aventura II |
21.0 |
13.1 |
37.2 |
06.05.2053 |
| Aventura III |
25.2 |
15.5 |
43.2 |
06.11.2053 |
| Aventura IV |
29.4 |
18.5 |
54.7 |
06.05.2053 |
| Aventura V |
29.4 |
17.9 |
51.0 |
06.05.2053 |
| Santa Rosa e Mundo Novo 9 |
155.4 |
92.8 |
240.8 |
|
| Santa Rosa e Mundo Novo I |
33.6 |
17.3 |
39.3 |
06.04.2053 |
| Santa Rosa e Mundo Novo II |
29.4 |
17.2 |
50.4 |
06.04.2053 |
| Santa Rosa e Mundo Novo III |
33.6 |
21.5 |
58.3 |
06.04.2053 |
| Santa Rosa e Mundo Novo IV |
33.6 |
21.0 |
56.6 |
06.01.2053 |
| Santa Rosa e Mundo Novo V |
25.2 |
15.8 |
36.2 |
06.01.2053 |
| TOTAL |
6,018.7 |
2,646.9 |
12,542.0 |
|
(1) RAG of R$167.9 million, updated by Aneel's Resolution No. 3,353, of July 23, 2024.
(2) In partial operation, entry into commercial operation of the fourth generating unit scheduled for 2022.
(3) Power plants exempted from concession, are only registered with ANEEL.
(4) Assured power considered the average wind generation.
(5) Extension of Grant according to REH 2919/2021, 2932/2021 and 3.242/2023.
(6) Under approval by ANEEL. |
(7) Assured Power updated by Ordinance N°709/2022 for: FDA, Segredo, Salto Caxias and GPS, effective from January/2023.
(8) Started up in test operation on 04/25/2022, according to ANEEL Dispatch No. 1047/2022. In commercial operation since 12/07/2022, by ANEEL order No. 2502/2022.
(9) Complexes Aventura and Santa Rosa & Novo Mundo joined the Company's portfolio in Jan/23.
* Considers internal consumption of generators and generation in commercial operation.
** Plant do not participate in the MRE. |
| Exhibit IV - OPERATIONAL DATA > GENERATION |
| |
|
|
|
|
|
|
| INTEREST |
|
|
|
|
|
|
| Enterprise |
Partners |
Installed
Capacity (MW) |
Assured Power 1
(Average MW) |
Proportional installed capacity (MW) |
Proporcional Assured Power
(Average MW) |
Concession Expires |
| Hydroelectric Power Plants |
|
1,111.7 |
586.8 |
500.9 |
264.9 |
|
| Large hydroelectric power plant (HPP) |
|
1,076.5 |
561.5 |
486.2 |
254.2 |
|
HPP Gov. Jayme Canet Junior (Mauá) 6
(Consórcio Energético Cruzeiro do Sul) |
COPEL GeT - 51%
Eletrosul - 49% |
361.0 |
188.5 |
184.1 |
96.1 |
06.28.2049 |
HPP Baixo Iguaçu
(Consórcio Empreendedor Baixo Iguaçu) |
COPEL GeT - 30%
Geração Céu Azul - 70% |
350.2 |
172.4 |
105.1 |
51.7 |
12.03.2049 |
HPP Santa Clara
(Elejor) |
COPEL - 70%
Paineira Participações - 30% |
120.2 |
66.0 |
84.2 |
46.2 |
05.10.2040 |
HPP Fundão
(Elejor) |
COPEL - 70%
Paineira Participações - 30% |
120.2 |
62.1 |
84.1 |
43.5 |
06.11.2040 |
HPP Dona Francisca
(DFESA) |
COPEL - 23,03%
Gerdau - 53,94%
Celesc - 23,03% |
125.0 |
72.5 |
28.8 |
16.7 |
09.21.2037 |
| Small hydroelectric power station (SHP) |
|
29.1 |
20.4 |
10.4 |
7.3 |
|
SHP Arturo Andreoli 6
(Foz do Chopim) |
COPEL GeT - 35,77%
Silea Participações - 64,23% |
29.1 |
20.4 |
10.4 |
7.3 |
07.07.2034 |
| Hydroelectric Generating Centers (CGH) |
|
6.1 |
4.9 |
4.3 |
3.4 |
|
CGH Santa Clara I
(Elejor) |
COPEL - 70%
Paineira Participações - 30% |
3.6 |
2.8 |
2.5 |
2.0 |
(2) |
CGH Fundão I
(Elejor) |
COPEL - 70%
Paineira Participações - 30% |
2.5 |
2.1 |
1.7 |
1.5 |
(2) |
| Wind Power Plants |
|
108.0 |
57.1 |
53.2 |
28.0 |
|
Voltalia - São Miguel
do Gostoso (5 parques) |
COPEL- 49%
Voltalia- 51% |
108.0 |
57.1 |
53.2 |
28.0 |
(4) |
| Solar |
|
2.3 |
- |
1.1 |
- |
|
| Solar Paraná 5 |
COPEL - 49%
|
2.3 |
- |
1.1 |
- |
09.15.2046 |
| TOTAL |
|
1,222.0 |
643.9 |
555.2 |
292.9 |
|
| 1 Assured power updated by Ordinance No. 709/2022 of: HPP Mauá, Santa Clara, Fundão and Dona Francisca. |
| 2 Elejor requested the reclassification of its Small Hydroelectric Power Plants - (SHPs) Fundão I and Santa Clara I to Hydroelectric Generating Centers (CGHs), as amended by Art. 8 of Law 9074/1995. This was formalized through ANEEL Authorizing Resolutions 14,744 and 14,745 of 06/20/2023, with the plants exempted from concession, having only registration with ANEEL. |
| 3 The Concession Expires of the wind farm concessions are respectively: Carnaúbas (04.09.2047), Reduto (04.16.2047), Santo Cristo (04.18.2047), São João (03.26.2047). |
| 4 Holding of 6 SCPs operating in the field of distributed generation (photovoltaic plants): Pharma Solar II, Pharma Solar III, Pharma Solar IV, in commercial operation, e Bandeirantes Solar I, Bandeirantes Solar II e Bandeirantes Solar III, in pre-operational. |
| 5 Extension of Grant according to REH 3.242/2023. |
| Exhibit IV - OPERATIONAL DATA > TRANSMISSION |
| |
|
|
|
|
|
|
|
| Subsidiary / SPC |
Contract |
Enterprise |
TL |
|
APR ¹ (R$ milhões) |
Concession Expiration |
| Extension (km)2 |
Amount |
MVA |
| Copel GeT |
060/20013 |
Several |
2,129 |
35 |
12,815 |
662.6 |
01.01.2043 |
| Copel GeT |
075/20014 |
TL Bateias - Jaguariaiva |
138 |
- |
- |
17.0 |
08.17.2031 |
| Copel GeT |
006/2008 |
TL Bateias - Pilarzinho |
32 |
- |
- |
2.8 |
03.17.2038 |
| Copel GeT |
027/2009 |
TL Foz - Cascavel Oeste |
117 |
- |
- |
16.6 |
11.19.2039 |
| Copel GeT |
010/2010 |
TL Araraquara II — Taubaté |
334 |
- |
- |
45.3 |
10.06.2040 |
| Copel GeT |
015/2010 |
SE Cerquilho III |
- |
1 |
300 |
7.3 |
10.06.2040 |
| Copel GeT |
022/2012 |
TL Foz do Chopim - Salto Osório
LT Londrina - Figueira |
102 |
- |
- |
8.1 |
08.27.2042 |
| Copel GeT |
002/2013 |
TL Assis — Paraguaçu Paulista II |
83 |
1 |
150 |
11.7 |
02.25.2043 |
| Copel GeT |
005/2014 |
TL Bateias - Curitiba Norte |
31 |
1 |
300 |
13.3 |
01.29.2044 |
| Copel GeT |
021/2014 |
TL Foz do Chopim - Realeza |
52 |
1 |
300 |
13.5 |
09.05.2044 |
| Copel GeT |
022/2014 |
TL Assis – Londrina |
122 |
- |
- |
28.1 |
09.05.2044 |
| Copel GeT |
006/165 |
Lot E: TL Baixo Iguaçu - Realeza; TL Uberaba - Curitiba Centro; TL Curitiba Leste - Blumenau; SE Medianeira; SE Curitiba Centro; SE Andirá leste; Other Sections |
255 |
4 |
900 |
160.9 |
04.07.2046 |
Costa Oeste
Copel Get - 100% |
001/2012 |
TL Cascavel Norte - Cascavel Oeste
TL Cascavel Norte - Umuarama Sul
SE Umuarama Sul |
159 |
1 |
300 |
19.7 |
01.12.2042 |
Marumbi
Copel GeT - 100% |
008/2012 |
TL Curitiba - Curitiba Leste |
29 |
1 |
672 |
28.3 |
05.10.2042 |
Uirapuru Transmissora
Copel GeT - 100% |
002/20056 |
TL Ivaiporã - Londrina |
122 |
- |
- |
27.0 |
03.04.2035 |
| Subtotal Copel GeT 7 |
|
|
3,705 |
45 |
15,737 |
1,062.2 |
|
Caiuá Transmissora
Copel GeT - 49%
Elecnor - 51% |
007/2012 |
TL Guaíra - Umuarama Sul
TL Cascavel Norte - Cascavel Oeste
SE Santa Quitéria / SE Cascavel Norte |
142 |
2 |
700 |
17.0 |
05.10.2042 |
Integração Maranhense
Copel GeT - 49%
Elecnor - 51% |
011/2012 |
TL Açailandia - Miranda II |
365 |
- |
- |
25.6 |
05.10.2042 |
Matrinchã
Copel GeT - 49%
State Grid - 51% |
012/2012 |
TL Paranaíta - Ribeirãozinho |
2,033 |
4 |
800 |
138.8 |
05.10.2042 |
Guaraciaba
Copel GeT - 49%
State Grid - 51% |
013/2012 |
TL Ribeirãozinho - Marimbondo |
930 |
1 |
- |
71.7 |
05.10.2042 |
Paranaíba
Copel GeT - 24,5%
Furnas - 24,5%
State Grid - 51% |
007/2012 |
TL Barreiras II - Pirapora II |
967 |
- |
- |
47.7 |
05.02.2043 |
Cantareira
Copel GeT - 49%
Elecnor - 51% |
19/2014 |
TL Estreito - Fernão Dias |
656 |
- |
- |
70.7 |
09.05.2044 |
Mata de Santa Genebra
Copel GeT - 50,1%
Furnas - 49,9% |
001/14 |
TL Araraquara II - Bateias |
887 |
1 |
3,600 |
161.1 |
05.14.2044 |
| Subtotal SPCs 8 |
|
|
5,980 |
8 |
5,100 |
532.6 |
|
| Total |
|
|
9,685 |
53 |
20,837 |
1,594.8 |
|
1 Proportional to Copel's interest in the project. Values referring to the 2023/2024 cycle, effective from July 1, 2024, according to REH 3.348/2024 - Technical Note No. 105/2024 – STR/ANEEL, of July 09, 2024. Considers investments that came into operation until 06/30/2024.
² Considers double circuit sections (circuits that share the same transmission tower).
³ Contract renewed according to Law 12,783/13. The O&M portion is part of the RBSE, under the terms of the Law. It will be received until the end of the concession (Jan/2043). The value of the APR for the 2024-2025 cycle, excluding the RBSE, according to REH 3,3348/2024, is R$ 148.3 million. This amount refers to additional RAP for reinforcements and improvements, in effect when REH 3,348/2024 was published.
4 As of 10.31.2018, the APR was reduced by 50%.
5 The construction of 38 km of sectioning lines was foreseen in the implementation of the Andirá Leste and Medianeira SEs, 2 km of which for Contract 060/2001 and 36 km for LTs that do not belong to Copel GeT, which, despite being included in the APR, in reason for the investment made, will not be added to Copel's assets.
6 As of 07/09/2021, the APR was reduced by 50%.
7 Consolidated Result.
8 Equity Income. |
| Exhibit IV - OPERATIONAL DATA > DISTRIBUTION |
| |
|
|
|
|
|
|
| OPERATIONAL DATA |
|
|
|
|
|
|
| |
|
|
|
|
|
|
| Number of Consumers |
Locations served |
Cities served |
Voltage |
Number of Substations |
MVA |
Km of lines |
| 5,137,652 |
1,068 |
395 |
13,8 kV |
0 |
0 |
113,526 |
| 34,5 kV |
237 |
1,704 |
91,744 |
| 69 kV |
36 |
2,518 |
778 |
| 88 kV |
0 |
5 |
- |
| 138 kV |
123 |
7,861 |
6,878 |
| |
|
|
|
396 |
12,088 |
212,926 |
| Consumer-to-employee ratio DIS |
2019 |
2020 |
2021 |
2022 |
2023 |
Jun-24 |
Captive Consumers |
4,713,240 |
4,835,852 |
4,926,608 |
5,011,555 |
5,098,006 |
5,137,652 |
| Copel Dis employees |
4,964 |
4,641 |
4,430 |
4,257 |
4,203 |
4,058 |
| Consum/Emp |
949 |
1,042 |
1,112 |
1,177 |
1,213 |
1,266 |
| |
|
|
|
|
|
|
| QUALITY OF SUPPLY |
|
|
|
|
|
|
| |
|
|
|
|
|
|
| |
Year |
DEC ¹
(hours) |
FEC ²
(outages) |
|
|
|
| |
2020 |
7.83 |
5.61 |
|
|
|
| |
2021 |
7.20 |
4.76 |
|
|
|
| |
2022 |
7.98 |
5.29 |
|
|
|
| |
2023 |
7.86 |
5.21 |
|
|
|
| |
Jun-24 |
8.52 |
5.55 |
|
|
|
¹ DEC measured in hours and hundredths of an hour
² FEC expressed in number of interruptions and hundredths of a number of interruptions year to date
* Values of the last 12 months |
|
|
|
| Period |
Technical Loss |
Non-Technical Loss |
Total loss |
| Regulatory (1) |
Real (2) |
Regulatory (3) |
Calculated (4) |
Regulatory (5) |
Total (6) |
| Jun-20 |
6.05% |
6.04% |
4.70% |
2.17% |
8.18% |
7.03% |
| Jun-21 |
6.05% |
5.93% |
4.70% |
4.34% |
8.08% |
7.92% |
| Jun-22 |
5.79% |
5.73% |
4.47% |
4.54% |
7.65% |
7.68% |
| Jun-23 |
5.79% |
5.78% |
4.47% |
4.55% |
7.57% |
7.61% |
| Jun-24 |
5.79% |
6.11% |
4.47% |
4.41% |
7.58% |
7.55% |
| |
|
|
|
|
|
|
| (1) Percentage established in the tariff review; |
| (2) Technical loss calculated and reported monthly to Aneel; |
| (3) Percentage established in the tariff review; |
| (4) Difference between reported total losses and technical losses calculated as a percentage established in the review and the total injected energy, also reported monthly to Aneel; |
| (5) (Regulatory percentage of PNT x informed BT Market + technical losses calculated as a percentage established in the review and the total energy injected) / Injected energy; |
| (6) Total loss on injected energy. |
| NOTE: In the calculation of the distributor's total losses, energy losses inherent to the electric power system (technical losses), commercial losses (mainly due to fraud, theft) and differences related to the shift in the billing schedule and the effects of the portion of mini and micro generation distributed in the Company's network |
SIGNATURE
Pursuant to the requirements of the Securities
Exchange Act of 1934, the registrant has duly caused this report to be signed on its behalf by the undersigned, thereunto duly
authorized.
Date August 7, 2024
| COMPANHIA PARANAENSE DE ENERGIA – COPEL |
| |
|
|
| By: |
/S/
Daniel Pimentel Slaviero
|
|
| |
Daniel Pimentel Slaviero
Chief Executive Officer |
|
FORWARD-LOOKING STATEMENTS
This press release may contain forward-looking statements.
These statements are statements that are not historical facts, and are based on management's current view and estimates of future
economic circumstances, industry conditions, company performance and financial results. The words "anticipates", "believes",
"estimates", "expects", "plans" and similar expressions, as they relate to the company, are intended
to identify forward-looking statements. Statements regarding the declaration or payment of dividends, the implementation of principal
operating and financing strategies and capital expenditure plans, the direction of future operations and the factors or trends
affecting financial condition, liquidity or results of operations are examples of forward-looking statements. Such statements reflect
the current views of management and are subject to a number of risks and uncertainties. There is no guarantee that the expected
events, trends or results will actually occur. The statements are based on many assumptions and factors, including general economic
and market conditions, industry conditions, and operating factors. Any changes in such assumptions or factors could cause actual
results to differ materially from current expectations.
Grafico Azioni Companhia Parana De Energ (NYSE:ELP)
Storico
Da Gen 2025 a Feb 2025

Grafico Azioni Companhia Parana De Energ (NYSE:ELP)
Storico
Da Feb 2024 a Feb 2025

