0001497645
false
0001497645
2023-08-02
2023-08-02
0001497645
us-gaap:CommonStockMember
2023-08-02
2023-08-02
0001497645
inn:SeriesECumulativeRedeemablePreferredStock0.01ParValueMember
2023-08-02
2023-08-02
0001497645
inn:SeriesFCumulativeRedeemablePreferredStock0.01ParValueMember
2023-08-02
2023-08-02
iso4217:USD
xbrli:shares
iso4217:USD
xbrli:shares
UNITED STATES
SECURITIES AND EXCHANGE COMMISSION
WASHINGTON, D.C. 20549
FORM 8-K
CURRENT REPORT
Pursuant to Section 13 or 15(d) of the
Securities Exchange Act of 1934
Date of Report (Date
of earliest event reported): August 2, 2023
SUMMIT
HOTEL PROPERTIES, INC.
(Exact Name of Registrant
as Specified in its Charter)
| Maryland |
001-35074 |
27-2962512 |
(State
or Other Jurisdiction
of Incorporation or Organization) |
(Commission
File Number) |
(I.R.S.
Employer Identification No.) |
13215 Bee Cave Parkway, Suite B-300
Austin,
Texas 78738
(Address of Principal Executive Offices) (Zip
Code)
(512)
538-2300
(Registrants’ telephone number, including
area code)
Not applicable
(Former name or former address, if changed since
last report.)
Check the appropriate box below if the Form 8-K
filing is intended to simultaneously satisfy the filing obligation of the registrant under any of the following provisions:
| ¨ |
Written communications pursuant to Rule 425 under the Securities Act (17 CFR 230.425) |
| ¨ |
Soliciting material pursuant to Rule 14a-12 under the Exchange Act (17 CFR 240.14a-12) |
| ¨ |
Pre-commencement communications pursuant to Rule 14d-2(b) under the Exchange Act (17 CFR 240.14d-2(b)) |
| ¨ |
Pre-commencement communications pursuant to Rule 13e-4(c) under the Exchange Act (17 CFR 240.13e-4(c)) |
| Securities registered pursuant to Section 12(b) of the Act: |
|
|
| |
|
|
| Title
of each class |
Trading
Symbol(s) |
Name
of each exchange on which registered |
| Common
Stock, $0.01 par value |
INN |
New
York Stock Exchange |
| Series
E Cumulative Redeemable Preferred Stock, $0.01 par value |
INN-PE |
New
York Stock Exchange |
| Series
F Cumulative Redeemable Preferred Stock, $0.01 par value |
INN-PF |
New
York Stock Exchange |
Indicate by check mark whether the registrant
is an emerging growth company as defined in Rule 405 of the Securities Act of 1933 (§230.405 of this chapter) or Rule 12b-2 of the
Securities Exchange Act of 1934 (§240.12b-2 of this chapter).
| ¨ |
Emerging growth company |
If
an emerging growth company, indicate by check mark if the registrant has elected not to use the extended transition period for complying
with any new or revised financial accounting standards provided pursuant to Section 13(a) of the Exchange Act. ¨
| Item 2.02. | Results of Operations and Financial Condition. |
On August
2, 2023, Summit Hotel Properties, Inc. (the “Company”) issued a press release announcing the operating results of the Company
and its subsidiaries for the three and six months ended June 30, 2023. The press release referred to supplemental financial information
for the second quarter 2023 that is available on the Company’s website at www.shpreit.com. A copy of the press release
and the supplemental financial information are furnished as Exhibit 99.1 and Exhibit 99.2, respectively, to this Report.
The information in this Report, including the exhibits, is provided
under Item 2.02 of Form 8-K and shall not be deemed “filed” for the purposes of Section 18 of the Securities Exchange Act
of 1934 or otherwise subject to the liabilities of that section. Furthermore, the information in this Report, including the exhibits,
shall not be deemed to be incorporated by reference into the filings of the registrant under the Securities Act of 1933 regardless of
any general incorporation language in such filings.
| Item 9.01. | Financial Statements and Exhibits. |
SIGNATURE
Pursuant to the requirements of the Securities Exchange Act of 1934,
the registrant has duly caused this report to be signed on its behalf by the undersigned thereunto duly authorized.
| SUMMIT HOTEL PROPERTIES, INC. |
| | |
| | By: |
/s/ Christopher R. Eng |
| | |
Christopher R. Eng |
| | |
Executive Vice President, General Counsel, |
| Dated: August 2, 2023 | |
Chief Risk Officer and Secretary |
Exhibit 99.1
 |
13215 Bee Cave Pkwy, Suite B-300, Austin, TX 78738 |
| Telephone: 512-538-2300 Fax: 512-538-2333 |
| www.shpreit.com |
NEWS RELEASE
SUMMIT HOTEL PROPERTIES REPORTS SECOND QUARTER
2023 RESULTS
Pro Forma RevPAR Reaches New Post-Pandemic High
The Nordic Lodge Steamboat Springs Acquired
Through GIC Joint Venture
Austin, Texas, August 2, 2023 - -
- Summit Hotel Properties, Inc. (NYSE: INN) (the “Company”), today announced results for the three and six months ended
June 30, 2023.
“Key operating fundamentals continued to
improve during the second quarter as nominal quarterly RevPAR reached its highest level since the onset of the pandemic, highlighted by
nearly 15% RevPAR growth in the NewcrestImage portfolio. Our revenue management efforts yielded significant market share gains during
the quarter, as total portfolio RevPAR index increased over 250 basis points compared to last year, also driven by the NewcrestImage portfolio
which grew index by nearly 750 basis points during the quarter,” said Jonathan P. Stanner, the Company’s President and Chief
Executive Officer. “As the second quarter progressed, we saw industry demand trends normalize, particularly in leisure-oriented
markets, but we are encouraged by the recovery of our urban portfolio during the quarter and the stability of our forward looking operating
trends,” commented Mr. Stanner.
“We also continued to expand our partnership
with GIC through the acquisition of The Nordic Lodge in downtown Steamboat Springs, which presents a unique opportunity to own a highly
regarded independent hotel with a strong going-in yield, an extremely efficient operating model, and significant development or redevelopment
optionality. Finally, we were extremely pleased with the execution of our corporate credit facility refinancing that closed in the second
quarter. The credit facility transaction, along with the two previously announced interest rate swaps that are now effective, further
enhance our well-positioned balance sheet by extending maturity dates, maintaining pricing, reducing interest rate risk, and preserving
overall flexibility to execute on our strategic initiatives,” continued Mr. Stanner.
Second Quarter 2023 Summary
| · | Net Loss: Net loss attributable to common stockholders was $0.8 million, or $0.01 per diluted share,
compared to a net income of $7.9 million, or $0.07 per diluted share, for the second quarter of 2022. |
| · | Pro forma RevPAR: Pro forma RevPAR increased 3.5 percent to $127.06 compared to the second quarter
of 2022. Pro forma ADR increased 1.9 percent to $168.33 compared to the same period in 2022, and pro forma occupancy increased 1.6 percent
to 75.5 percent. |
| · | Same Store RevPAR: Same Store RevPAR increased 3.6 percent to $126.89 compared to the second quarter
of 2022. Same store ADR increased 2.2 percent to $167.70 compared to the same period in 2022, and same store occupancy increased 1.3 percent
to 75.7 percent. |
| · | Pro Forma Hotel EBITDA (1): Pro forma hotel EBITDA increased 0.1 percent to $71.1 million
from $71.0 million in the same period in 2022. Pro forma hotel EBITDA margin contracted to 36.6 percent from 38.2 percent in the same
period of 2022. |
 | 1 | Page |
| · | Same Store Hotel EBITDA (1): Same store hotel EBITDA increased 0.6 percent to $68.2
million from $67.8 million in the same period in 2022. Same store hotel EBITDA margin contracted to 37.1 percent from 38.5 percent in
the same period of 2022. |
| · | Adjusted EBITDAre (1): Adjusted EBITDAre decreased 3.1 percent to $52.9
million from $54.6 million in the second quarter of 2022. |
| · | Adjusted FFO (1): Adjusted FFO was $33.2 million, or $0.27 per diluted share and unit,
compared to $32.6 million, or $0.27 per diluted share and unit, in the second quarter of 2022. |
The Company’s results for the three and
six months ended June 30, 2023, are as follows (in thousands, except per share amounts):
| | |
For the Three Months Ended
June 30, | | |
For the Six Months Ended
June 30, | |
| | |
2023 | | |
2022 | | |
2023 | | |
2022 | |
| | |
| | |
| | |
| | |
| |
| | |
(unaudited) | |
| Net (loss) income attributable to common stockholders | |
$ | (753 | ) | |
$ | 7,944 | | |
$ | (5,981 | ) | |
$ | (4,435 | ) |
| Net (loss) income per diluted share | |
$ | (0.01 | ) | |
$ | 0.07 | | |
$ | (0.06 | ) | |
$ | (0.04 | ) |
| Total revenues | |
$ | 194,493 | | |
$ | 183,248 | | |
$ | 376,876 | | |
$ | 325,117 | |
| EBITDAre (1) | |
$ | 61,602 | | |
$ | 62,438 | | |
$ | 116,942 | | |
$ | 101,176 | |
| Adjusted EBITDAre (1) | |
$ | 52,896 | | |
$ | 54,592 | | |
$ | 97,331 | | |
$ | 87,513 | |
| FFO (1) | |
$ | 27,847 | | |
$ | 27,135 | | |
$ | 49,923 | | |
$ | 41,628 | |
| Adjusted FFO (1) | |
$ | 33,151 | | |
$ | 32,624 | | |
$ | 59,411 | | |
$ | 52,765 | |
| FFO per diluted share and unit (1) | |
$ | 0.23 | | |
$ | 0.22 | | |
$ | 0.41 | | |
$ | 0.35 | |
| Adjusted FFO per diluted share and unit (1) | |
$ | 0.27 | | |
$ | 0.27 | | |
$ | 0.49 | | |
$ | 0.44 | |
| | |
| | | |
| | | |
| | | |
| | |
| Pro Forma(2) | |
| | | |
| | | |
| | | |
| | |
| RevPAR | |
$ | 127.06 | | |
$ | 122.71 | | |
$ | 124.20 | | |
$ | 112.25 | |
| RevPAR Growth | |
| 3.5 | % | |
| | | |
| 10.6 | % | |
| | |
| Hotel EBITDA | |
$ | 71,117 | | |
$ | 71,024 | | |
$ | 136,240 | | |
$ | 122,562 | |
| Hotel EBITDA margin | |
| 36.6 | % | |
| 38.2 | % | |
| 36.1 | % | |
| 36.4 | % |
| Hotel EBITDA margin growth | |
| -155 | bps | |
| | | |
| -29 | bps | |
| | |
| | |
| | | |
| | | |
| | | |
| | |
| Same Store(3) | |
| | | |
| | | |
| | | |
| | |
| RevPAR | |
$ | 126.89 | | |
$ | 122.49 | | |
$ | 122.59 | | |
$ | 110.85 | |
| RevPAR Growth | |
| 3.6 | % | |
| | | |
| 10.6 | % | |
| | |
| Hotel EBITDA | |
$ | 68,184 | | |
$ | 67,794 | | |
$ | 127,449 | | |
$ | 115,062 | |
| Hotel EBITDA margin | |
| 37.1 | % | |
| 38.5 | % | |
| 36.1 | % | |
| 36.2 | % |
| Hotel EBITDA margin growth | |
| -138 | bps | |
| | | |
| -11 | bps | |
| | |
| (1) | See tables later in this press release for a discussion and reconciliation of net loss to non-GAAP
financial measures, including earnings before interest, taxes, depreciation, and amortization (“EBITDA”), EBITDAre, adjusted
EBITDAre, funds from operations (“FFO”), FFO per diluted share and unit, adjusted FFO (“AFFO”), and AFFO per diluted
share and unit, as well as a reconciliation of operating income (loss) to hotel EBITDA. See “Non-GAAP Financial Measures”
at the end of this release. |
| | 2 | Page |
| (2) | Unless stated otherwise in this release, all pro forma information includes operating and financial
results for 101 hotels owned as of June 30, 2023, as if each hotel had been owned by the Company since January 1, 2022, and
remained open for the entirety of the measurement period. As a result, all pro forma information includes operating and financial results
for hotels acquired since January 1, 2022, which may include periods prior to the Company’s ownership. Pro forma and non-GAAP
financial measures are unaudited. |
| (3) | All same store information includes operating and financial results for 95 hotels owned as of June 30,
2023, and at all times during the three and six months ended June 30, 2023, and 2022. |
Year-to-Date 2023 Summary
| · | Net Loss: Net loss attributable to common stockholders was $6.0 million, or $0.06 per diluted share,
compared to a net loss of $4.4 million, or $0.04 per diluted share, in the same period of 2022. |
| · | Pro forma RevPAR: Pro forma RevPAR increased 10.6 percent to $124.20 compared to the same period
of 2022. Pro forma ADR increased 6.1 percent to $171.26, and pro forma occupancy increased 4.3 percent to 72.5 percent. |
| · | Same Store RevPAR: Same Store RevPAR increased 10.6 percent to $122.59 compared to the same period
of 2022. Same store ADR increased 6.2 percent to $169.21, and same store occupancy increased 4.2 percent to 72.4 percent. |
| · | Pro Forma Hotel EBITDA (1): Pro forma hotel EBITDA increased 11.2 percent to $136.2
million from $122.6 million, and pro forma hotel EBITDA margin contracted to 36.1 percent from 36.4 percent in the same period of 2022. |
| · | Same Store Hotel EBITDA (1): Same store hotel EBITDA increased 10.8 percent to $127.4
million from $115.1 million, and same store hotel EBITDA margin contracted to 36.1 percent from 36.2 percent in the same period of 2022. |
| · | Adjusted EBITDAre (1): Adjusted EBITDAre increased 11.2 percent to $97.3
million from $87.5 million, in the same period of 2022. |
| · | Adjusted FFO (1): Adjusted FFO increased 12.6 percent to $59.4 million, or $0.49 per
diluted share and unit, from $52.8 million, or $0.44 per diluted share and unit, in the same period of 2022. |
Recent Transaction Activity
The Nordic Lodge Steamboat Springs Acquired
for $13.7 Million
On June 23, 2023, the Company completed the
acquisition of The Nordic Lodge Steamboat Springs (“The Nordic Lodge Hotel”), an independent 47-guestroom hotel, for $13.7
million through its joint venture with GIC.
Located in the heart of downtown Steamboat Springs
and consistently ranked #1 on TripAdvisor’s Best Places to Stay in Steamboat Springs, the acquisition of The Nordic Lodge Hotel
provides a unique opportunity to own an asset with an irreplaceable downtown location, strong going-in yield, and immediate value enhancement
opportunities. The Nordic Lodge Hotel is located approximately two miles from the joint venture’s Residence Inn Steamboat Springs
hotel, offering incremental complexing opportunities to an already highly efficient operating model, highlighted by a gross operating
profit margin that exceeded 70% for the full year 2022.
Steamboat Springs is recognized as one of the
top mountain resorts in the U.S., and in addition to the well-known ski resort, Steamboat Springs offers year-round activities such as
hiking, biking, fishing, and rafting as well as events and festivals held throughout the city. The Company estimates The Nordic Lodge
Hotel to yield between a 10.0 percent and 10.5 percent capitalization rate based on the full year estimated 2023 net operating income
prior to any potential synergies related to common ownership with the Residence Inn Steamboat. The Company funded its 51% interest in
the joint venture acquisition using a portion of the net proceeds generated from the recently completed four-hotel portfolio sale and
cash on hand.
| | 3 | Page |
Residence Inn Scottsdale North Acquired
for $29.0 Million
On June 1, 2023, the Company completed the
previously announced acquisition of the 120-guestroom Residence Inn Scottsdale North (“Residence Inn Scottsdale”) for $29.0
million through its joint venture with GIC. The Residence Inn Scottsdale is located directly across North Scottsdale Road from the joint
venture’s Courtyard and Springhill Suites hotels, both of which are also owned by the GIC joint venture. The Company expects the
addition of a third Marriott-branded hotel to the existing sales cluster will create revenue and operational synergies and the market-leading
Residence Inn brand will allow the cluster to capture additional group and extended-stay opportunities.
The Company expects
the Residence Inn Scottsdale to yield between an 8.0 percent and 8.5 percent capitalization rate on full year estimated 2023 net operating
income prior to any synergies realized. The hotel was fully renovated in 2019 and requires minimal near-term capital expenditures.
The Company funded its 51% interest in the joint venture acquisition using a portion of the net proceeds generated from the recently completed
four-hotel portfolio sale.
Four-Hotel Portfolio Sale Completed For
$28.1 Million
On May 19, 2023, the Company completed the
previously announced disposition of four wholly-owned hotels totaling 467 guestrooms for a gross sales price of $28.1 million. The portfolio
of sold hotels included:
| Hotel | |
State | |
Rooms | |
| Hyatt Place Chicago/Lombard/Oak Brook | |
IL | |
| 151 | |
| Hyatt Place Chicago/Hoffman Estates | |
IL | |
| 126 | |
| Hilton Garden Inn Minneapolis/Eden Prairie | |
MN | |
| 97 | |
| Holiday Inn Express & Suites Eden Prairie – Minnetonka | |
MN | |
| 93 | |
| Total | |
| |
| 467 | |
The transaction represents a 4.2 percent capitalization
rate based on the aggregate net operating income of the hotels after a 4% FF&E reserve for the twelve months ended December 31,
2022. The Company will also forego comprehensive renovations that were estimated to be $21 million as a result of the sale. The aggregate
gross sales price of $28.1 million, plus estimated future capital improvements, represents a 2.4 percent capitalization rate for the trailing
twelve months ended December 31, 2022.
Capital Markets & Balance Sheet
On June 21, 2023, the Company successfully
completed the refinancing of its $600 million senior unsecured credit facility (the “Credit Facility”), which is comprised
of a $400 million senior unsecured revolving credit facility (the “Revolver”) and $200 million senior unsecured term loan
(the “Term Loan”). The amended and restated credit agreement provides for a maturity date of June 2028 for both the Revolver
and Term Loan, including extension options. The pricing grid from the prior credit facility has been maintained at a range of 140 to 240
basis points for the Revolver and 135 to 235 basis points for the Term Loan, each over the applicable adjusted SOFR rate. As a result
of this refinancing, the Company’s average length to maturity has been increased to over three years, including extension options,
with no debt maturities until the fourth quarter of 2024.
| | 4 | Page |
As of June 30, 2023, inclusive of its pro
rata share of the GIC Joint Venture credit facility, the Company had the following:
| · | Outstanding debt of $1.2 billion with a weighted average interest rate of 4.93 percent. After giving effect
to interest rate derivative agreements, $748.0 million, or 65 percent, of our outstanding debt had an average fixed interest rate, and
$406.0 million, or 35 percent, had a variable interest rate. |
| o | On July 1, 2023, two previously announced interest rate swaps that fix SOFR at 3.35% became effective
and result in the Company having approximately 74 percent fixed rate debt with a weighted average interest rate of 4.80 percent. |
| · | Unrestricted cash and cash equivalents of $45.1 million. |
| · | Total liquidity of $421.6 million, including unrestricted cash and cash equivalents and revolving credit
facility availability. |
Common and Preferred Dividend Declaration
On July 27, 2023, the Company declared a
quarterly cash dividend of $0.06 per share on its common stock and per common unit of limited partnership interest in Summit Hotel OP,
LP. The quarterly dividend of $0.06 per share represents an annualized dividend yield of 3.8% based on the closing price of shares of
the common stock on August 1, 2023.
In addition, the Board of Directors declared a
quarterly cash dividend of:
| · | $0.390625 per share on its 6.25% Series E Cumulative Redeemable Preferred Stock |
| · | $0.3671875 per share on its 5.875% Series F Cumulative Redeemable Preferred Stock. |
| · | $0.328125 per unit on its 5.25% Series Z Cumulative Perpetual Preferred Units |
The dividends are payable on August 31, 2023,
to holders of record as of August 17, 2023.
| | 5 | Page |
2023 Outlook
The Company is updating its previously provided
outlook for the full year 2023 based on 101 lodging assets, 57 of which were wholly owned as of August 2, 2023. The updated outlook
includes all transaction activity closed during the second quarter and the net disposition activity resulting in an estimated $2.0 million
reduction in adjusted EBITDAre and $1.6 million reduction in adjusted FFO for the full year. There are no additional acquisitions, dispositions,
or capital markets activities assumed in the Company’s full year 2023 outlook beyond the transactions already completed.
| | |
FYE 2023 Outlook | |
| Summit Operational | |
Low | | |
High | | |
Variance to Prior Midpoint | | |
% Change to Prior Midpoint | |
| Pro Forma RevPAR (1) | |
$ | 119.00 | | |
$ | 121.50 | | |
$ | - | | |
| - | |
| Pro Forma RevPAR Growth (1) | |
| 6.00 | % | |
| 8.00 | % | |
| -1.50 | % | |
| n/a | |
| Adjusted EBITDAre | |
$ | 183,000 | | |
$ | 193,000 | | |
$ | (10,150 | ) | |
| -5.1 | % |
| Adjusted FFO | |
$ | 105,000 | | |
$ | 115,300 | | |
$ | (9,950 | ) | |
| -8.3 | % |
| Adjusted FFO per Diluted Unit | |
$ | 0.86 | | |
$ | 0.94 | | |
$ | (0.08 | ) | |
| -8.3 | % |
| Capital Expenditures, Pro Rata | |
$ | 60,000 | | |
$ | 80,000 | | |
$ | - | | |
| - | |
| | |
| | | |
| | | |
| | | |
| | |
| |
|
FYE 2023 Outlook Adjusted for
Transactions (2) | |
| |
|
Variance to Prior Midpoint | | |
% Change to Prior Midpoint | |
| Pro Forma RevPAR (1) |
|
$ | - | | |
| - | |
| Pro Forma RevPAR Growth (1) |
|
| -1.50 | % | |
| n/a | |
| Adjusted EBITDAre |
|
$ | (8,150 | ) | |
| -4.1 | % |
| Adjusted FFO |
|
$ | (8,350 | ) | |
| -7.0 | % |
| Adjusted FFO per Diluted Unit |
|
$ | (0.07 | ) | |
| -7.0 | % |
| Capital Expenditures, Pro Rata |
|
$ | - | | |
| - | |
| (1) | All pro forma information includes operating and financial results for 101 lodging assets owned as
of August 2, 2023, as if each property had been owned by the Company since January 1, 2022, and will continue to be owned through
the entire year ending December 31, 2023. As a result, the pro forma information includes operating and financial results for lodging
assets acquired since January 1, 2022, which may include periods prior to the Company’s ownership. Pro forma and non-GAAP financial
measures are unaudited. |
| (2) | The variance to adjusted prior midpoint reflects the midpoint change in current outlook compared to
previous outlook had the Company included all transactions closed during the second quarter in its prior guidance given no transactions
were contemplated in the full year 2023 outlook update published in May 2023. |
Second Quarter 2023 Earnings Conference
Call
The Company will conduct its quarterly conference
call on Thursday, August 3, 2023, at 10:00 AM ET.
| 1. | To access the conference call, please
pre-register using this link. Registrants will receive a confirmation with dial-in
details. |
| 2. | A live webcast of the conference call
can be accessed using this link. A replay of the webcast will be available in the
Investors section of the Company's website, www.shpreit.com, until October 31,
2023. |
| | 6 | Page |
Supplemental Disclosures
In conjunction with this press release, the Company
has furnished a financial supplement with additional disclosures on its website. Visit www.shpreit.com for more information. The
Company has no obligation to update any of the information provided to conform to actual results or changes in portfolio, capital structure
or future expectations.
About Summit Hotel Properties
Summit Hotel Properties, Inc. is a publicly
traded real estate investment trust focused on owning premium-branded lodging properties with efficient operating models primarily in
the upscale segment of the lodging industry. As of August 2, 2023, the Company's portfolio consisted of 101 assets, 57 of which are
wholly owned, with a total of 15,035 guestrooms located in 24 states.
For additional information, please visit the
Company's website, www.shpreit.com, and follow on Twitter at @SummitHotel_INN and on Facebook at facebook.com/SummitHotelProperties.
Contact:
Adam Wudel
SVP – Finance & Capital Markets
Summit Hotel Properties, Inc.
(512) 538-2325
Forward-Looking Statements
This press release contains statements that
are “forward-looking statements” within the meaning of Section 27A of the Securities Act of 1933, as amended, and Section 21E
of the Securities Exchange Act of 1934, as amended, pursuant to the safe harbor provisions of the Private Securities Litigation Reform
Act of 1995. Forward-looking statements are generally identifiable by use of forward-looking terminology such as “may,” “will,”
“should,” “potential,” “intend,” “expect,” “seek,” “anticipate,”
“estimate,” “approximately,” “believe,” “could,” “project,” “predict,”
“forecast,” “continue,” “plan,” “likely,” “would” or other similar words or
expressions. Forward-looking statements are based on certain assumptions and can include future expectations, future plans and strategies,
financial and operating projections, or other forward-looking information. Examples of forward-looking statements include the following:
the Company’s ability to realize growth from the deployment of renovation capital; projections of the Company’s revenues and
expenses, capital expenditures or other financial items; descriptions of the Company’s plans or objectives for future operations,
acquisitions, dispositions, financings, redemptions or services; forecasts of the Company’s future financial performance and potential
increases in average daily rate, occupancy, RevPAR, room supply and demand, EBITDAre, Adjusted EBITDAre, FFO and AFFO; the Company’s
outlook with respect to pro forma RevPAR, pro forma RevPAR growth, RevPAR, RevPAR growth, AFFO, AFFO per diluted share and unit and renovation
capital deployed; and descriptions of assumptions underlying or relating to any of the foregoing expectations regarding the timing of
their occurrence. These forward-looking statements are subject to various risks and uncertainties, not all of which are known to the Company
and many of which are beyond the Company’s control, which could cause actual results to differ materially from such statements.
These risks and uncertainties include, but are not limited to, the state of the U.S. economy, supply and demand in the hotel industry,
and other factors as are described in greater detail in the Company’s filings with the Securities and Exchange Commission (“SEC”).
Unless legally required, the Company disclaims any obligation to update any forward-looking statements, whether as a result of new information,
future events, or otherwise.
For information about the Company’s business
and financial results, please refer to the “Management’s Discussion and Analysis of Financial Condition and Results of Operations”
and “Risk Factors” sections of the Company’s Annual Report on Form 10-K for the year ended December 31, 2022,
filed with the SEC, and its quarterly and other periodic filings with the SEC. The Company undertakes no duty to update the statements
in this release to conform the statements to actual results or changes in the Company’s expectations.
| | 7 | Page |
Summit Hotel Properties, Inc.
Condensed Consolidated Balance Sheets
(In thousands)
| | |
June 30, 2023 | | |
December 31, 2022 | |
| | |
(unaudited) | | |
| |
| ASSETS | |
| | | |
| | |
| Investments in lodging property, net | |
$ | 2,856,006 | | |
$ | 2,841,856 | |
| Assets held for sale, net | |
| 1,650 | | |
| 29,166 | |
| Cash and cash equivalents | |
| 58,456 | | |
| 51,255 | |
| Restricted cash | |
| 11,953 | | |
| 10,553 | |
| Right-of-use assets, net | |
| 35,624 | | |
| 35,023 | |
| Trade receivables, net | |
| 22,112 | | |
| 21,015 | |
| Prepaid expenses and other | |
| 15,641 | | |
| 8,378 | |
| Deferred charges, net | |
| 7,079 | | |
| 7,074 | |
| Other assets | |
| 25,166 | | |
| 17,950 | |
| Total assets | |
$ | 3,033,687 | | |
$ | 3,022,270 | |
LIABILITIES, REDEEMABLE
NON-CONTROLLING INTERESTS, AND EQUITY | |
| | | |
| | |
| Liabilities: | |
| | | |
| | |
| Debt, net of debt issuance costs | |
$ | 1,450,854 | | |
$ | 1,451,796 | |
| Lease liabilities, net | |
| 26,383 | | |
| 25,484 | |
| Accounts payable | |
| 5,479 | | |
| 5,517 | |
| Accrued expenses and other | |
| 88,776 | | |
| 81,304 | |
| Total liabilities | |
| 1,571,492 | | |
| 1,564,101 | |
| | |
| | | |
| | |
| Redeemable non-controlling interests | |
| 50,219 | | |
| 50,219 | |
| | |
| | | |
| | |
| Total stockholders' equity | |
| 949,246 | | |
| 959,813 | |
| Non-controlling interests | |
| 462,730 | | |
| 448,137 | |
| Total equity | |
| 1,411,976 | | |
| 1,407,950 | |
| Total liabilities, redeemable non-controlling interests, and equity | |
$ | 3,033,687 | | |
$ | 3,022,270 | |
| | 8 | Page |
Summit Hotel Properties, Inc.
Condensed Consolidated Statements of Operations
(Unaudited)
(In thousands, except per share amounts)
| | |
For the Three Months Ended
June 30, | | |
For the Six Months Ended
June 30, | |
| | |
2023 | | |
2022 | | |
2023 | | |
2022 | |
| Revenues: | |
| | |
| | |
| | |
| |
| Room | |
$ | 174,181 | | |
$ | 166,804 | | |
$ | 337,270 | | |
$ | 295,614 | |
| Food and beverage | |
| 10,269 | | |
| 7,664 | | |
| 20,899 | | |
| 13,326 | |
| Other | |
| 10,043 | | |
| 8,780 | | |
| 18,707 | | |
| 16,177 | |
| Total revenues | |
| 194,493 | | |
| 183,248 | | |
| 376,876 | | |
| 325,117 | |
| Expenses: | |
| | | |
| | | |
| | | |
| | |
| Room | |
| 38,788 | | |
| 35,783 | | |
| 74,697 | | |
| 64,193 | |
| Food and beverage | |
| 8,040 | | |
| 6,013 | | |
| 15,995 | | |
| 10,127 | |
| Other lodging property operating expenses | |
| 57,829 | | |
| 53,711 | | |
| 113,954 | | |
| 99,988 | |
| Property taxes, insurance and other | |
| 14,215 | | |
| 13,525 | | |
| 28,939 | | |
| 26,663 | |
| Management fees | |
| 4,992 | | |
| 5,042 | | |
| 9,797 | | |
| 8,837 | |
| Depreciation and amortization | |
| 37,510 | | |
| 38,058 | | |
| 74,418 | | |
| 74,332 | |
| Corporate general and administrative | |
| 9,100 | | |
| 8,074 | | |
| 17,099 | | |
| 17,211 | |
| Transaction costs | |
| 260 | | |
| 681 | | |
| 266 | | |
| 681 | |
| Recoveries of credit losses | |
| - | | |
| (250 | ) | |
| (250 | ) | |
| (250 | ) |
| Total expenses | |
| 170,734 | | |
| 160,637 | | |
| 334,915 | | |
| 301,782 | |
| (Loss) gain on disposal of assets, net | |
| (320 | ) | |
| 20,484 | | |
| (320 | ) | |
| 20,484 | |
| Operating income | |
| 23,439 | | |
| 43,095 | | |
| 41,641 | | |
| 43,819 | |
| Other income (expense): | |
| | | |
| | | |
| | | |
| | |
| Interest expense | |
| (22,248 | ) | |
| (15,118 | ) | |
| (43,157 | ) | |
| (28,557 | ) |
| Interest and other income, net | |
| 490 | | |
| 1,773 | | |
| 755 | | |
| 3,515 | |
| Total other expense, net | |
| (21,758 | ) | |
| (13,345 | ) | |
| (42,402 | ) | |
| (25,042 | ) |
| Income (loss) from continuing operations before income taxes | |
| 1,681 | | |
| 29,750 | | |
| (761 | ) | |
| 18,777 | |
| Income tax expense | |
| (791 | ) | |
| (6,437 | ) | |
| (319 | ) | |
| (4,437 | ) |
| Net income (loss) | |
| 890 | | |
| 23,313 | | |
| (1,080 | ) | |
| 14,340 | |
| Loss (income) attributable to non-controlling interests | |
| 2,982 | | |
| (10,748 | ) | |
| 4,351 | | |
| (9,629 | ) |
| Net income attributable to Summit Hotel Properties, Inc. before preferred dividends and distributions | |
| 3,872 | | |
| 12,565 | | |
| 3,271 | | |
| 4,711 | |
| Distributions to and accretion of redeemable non-controlling interests | |
| (657 | ) | |
| (653 | ) | |
| (1,314 | ) | |
| (1,208 | ) |
| Preferred dividends | |
| (3,968 | ) | |
| (3,968 | ) | |
| (7,938 | ) | |
| (7,938 | ) |
| Net (loss) income attributable to common stockholders | |
$ | (753 | ) | |
$ | 7,944 | | |
$ | (5,981 | ) | |
$ | (4,435 | ) |
| (Loss) income per share: | |
| | | |
| | | |
| | | |
| | |
| Basic | |
$ | (0.01 | ) | |
$ | 0.08 | | |
$ | (0.06 | ) | |
$ | (0.04 | ) |
| Diluted | |
$ | (0.01 | ) | |
$ | 0.07 | | |
$ | (0.06 | ) | |
$ | (0.04 | ) |
| Weighted average common shares outstanding: | |
| | | |
| | | |
| | | |
| | |
| Basic | |
| 105,562 | | |
| 105,199 | | |
| 105,438 | | |
| 105,049 | |
| Diluted | |
| 105,562 | | |
| 121,352 | | |
| 105,438 | | |
| 105,049 | |
| | 9 | Page |
Summit Hotel Properties, Inc.
Reconciliation of Net Loss to Non-GAAP Measures – Funds From Operations
(Unaudited)
(In thousands, except per share and unit amounts)
| | |
For the Three Months Ended
June 30, | | |
For the Six Months Ended
June 30, | |
| | |
2023 | | |
2022 | | |
2023 | | |
2022 | |
| Net income (loss) | |
$ | 890 | | |
$ | 23,313 | | |
$ | (1,080 | ) | |
$ | 14,340 | |
| Preferred dividends | |
| (3,968 | ) | |
| (3,968 | ) | |
| (7,938 | ) | |
| (7,938 | ) |
| Distributions to and accretion of redeemable non-controlling interests | |
| (657 | ) | |
| (653 | ) | |
| (1,314 | ) | |
| (1,208 | ) |
| Loss (income) related to non-controlling interests in consolidated joint ventures | |
| 2,971 | | |
| (9,031 | ) | |
| 3,651 | | |
| (8,949 | ) |
| Net (loss) income applicable to Common Stock and Common Units | |
$ | (764 | ) | |
$ | 9,661 | | |
$ | (6,681 | ) | |
$ | (3,755 | ) |
| Real estate-related depreciation | |
| 36,327 | | |
| 36,960 | | |
| 72,054 | | |
| 72,155 | |
| Loss (gain) on disposal of assets and other dispositions, net | |
| 320 | | |
| (20,484 | ) | |
| 368 | | |
| (20,484 | ) |
| Adjustments related to non-controlling interests in consolidated joint ventures | |
| (8,036 | ) | |
| 998 | | |
| (15,818 | ) | |
| (6,288 | ) |
| FFO applicable to Common Stock and Common Units | |
$ | 27,847 | | |
$ | 27,135 | | |
$ | 49,923 | | |
$ | 41,628 | |
| Recoveries of credit losses | |
| - | | |
| (250 | ) | |
| (250 | ) | |
| (250 | ) |
| Amortization of debt issuance costs | |
| 1,386 | | |
| 1,413 | | |
| 2,785 | | |
| 2,825 | |
| Amortization of franchise fees | |
| 144 | | |
| 169 | | |
| 286 | | |
| 337 | |
| Amortization of intangible assets, net | |
| 919 | | |
| 929 | | |
| 1,822 | | |
| 1,840 | |
| Equity-based compensation | |
| 2,578 | | |
| 2,142 | | |
| 4,046 | | |
| 5,840 | |
| Transaction costs and other | |
| 259 | | |
| 716 | | |
| 352 | | |
| 716 | |
| Non-cash interest (income) expense, net (1) | |
| (133 | ) | |
| 9 | | |
| (263 | ) | |
| (113 | ) |
| Non-cash lease expense, net | |
| 129 | | |
| 130 | | |
| 262 | | |
| 258 | |
| Casualty losses, net | |
| 935 | | |
| 119 | | |
| 1,471 | | |
| 304 | |
| Other non-cash items, net | |
| - | | |
| - | | |
| 768 | | |
| - | |
| Adjustments related to non-controlling interests in consolidated joint ventures | |
| (913 | ) | |
| 112 | | |
| (1,791 | ) | |
| (620 | ) |
| AFFO applicable to Common Stock and Common Units | |
$ | 33,151 | | |
$ | 32,624 | | |
$ | 59,411 | | |
$ | 52,765 | |
| FFO per share of Common Stock and Common Units | |
$ | 0.23 | | |
$ | 0.22 | | |
$ | 0.41 | | |
$ | 0.35 | |
| AFFO per share of Common Stock and Common Units | |
$ | 0.27 | | |
$ | 0.27 | | |
$ | 0.49 | | |
$ | 0.44 | |
| Weighted average diluted shares of Common Stock and Common Units | |
| | | |
| | | |
| | | |
| | |
| FFO and AFFO (2) | |
| 122,432 | | |
| 121,352 | | |
| 122,223 | | |
| 119,890 | |
| (1) | Non-cash interest income relates to the amortization of the discount on certain notes receivable. The
discount on these notes receivable was recorded at inception of the related loans based on the estimated value of the embedded purchase
options in the notes receivable. |
| (2) | The Company includes the outstanding OP units issued by Summit Hotel OP, LP, the Company’s operating
partnership, held by limited partners other than the Company because the OP units are redeemable for cash or, at the Company’s option,
shares of the Company’s common stock on a one-for-one basis. |
| | 10 | Page |
Summit Hotel Properties, Inc.
Reconciliation of Weighted Average Diluted
Common Shares
(Unaudited)
(In thousands)
| | |
For the Three Months Ended
June 30, | | |
For the Six Months Ended
June 30, | |
| | |
2023 | | |
2022 | | |
2023 | | |
2022 | |
| Weighted average of shares of common stock outstanding | |
| 105,562 | | |
| 105,199 | | |
| 105,438 | | |
| 105,049 | |
| Dilutive effect of unvested restricted stock awards | |
| 29 | | |
| 164 | | |
| 122 | | |
| 113 | |
| Dilutive effect of Common Units of Operating Partnership | |
| 15,977 | | |
| 15,989 | | |
| 15,977 | | |
| 14,728 | |
| Dilutive effect of shares of Common Stock issuable upon conversion of convertible debt | |
| 24,540 | | |
| 23,978 | | |
| 24,433 | | |
| 23,978 | |
| Adjusted weighted diluted shares of Common Stock | |
| 146,108 | | |
| 145,330 | | |
| 145,970 | | |
| 143,868 | |
| | |
| | | |
| | | |
| | | |
| | |
| Non-GAAP adjustment for dilutive effects of restricted stock awards | |
| 864 | | |
| - | | |
| 686 | | |
| - | |
| Non-GAAP adjustment for dilutive effect of shares of Common Stock issuable upon conversion of convertible debt | |
| (24,540 | ) | |
| (23,978 | ) | |
| (24,433 | ) | |
| (23,978 | ) |
| Non-GAAP weighted diluted share of Common Stock and Common Units | |
| 122,432 | | |
| 121,352 | | |
| 122,223 | | |
| 119,890 | |
| | 11 | Page |
Summit Hotel Properties, Inc.
Reconciliation
of Net Loss to Non-GAAP Measures – EBITDAre
(Unaudited)
(In thousands)
| | |
For the Three Months Ended
June 30, | | |
For the Six Months Ended
June 30, | |
| | |
2023 | | |
2022 | | |
2023 | | |
2022 | |
| Net income (loss) | |
$ | 890 | | |
$ | 23,313 | | |
$ | (1,080 | ) | |
$ | 14,340 | |
| Depreciation and amortization | |
| 37,510 | | |
| 38,058 | | |
| 74,418 | | |
| 74,332 | |
| Interest expense | |
| 22,248 | | |
| 15,118 | | |
| 43,157 | | |
| 28,557 | |
| Interest income | |
| (157 | ) | |
| (4 | ) | |
| (240 | ) | |
| (6 | ) |
| Income tax expense | |
| 791 | | |
| 6,437 | | |
| 319 | | |
| 4,437 | |
| EBITDA | |
$ | 61,282 | | |
$ | 82,922 | | |
$ | 116,574 | | |
$ | 121,660 | |
| Loss (gain) on disposal of assets and other dispositions, net | |
| 320 | | |
| (20,484 | ) | |
| 368 | | |
| (20,484 | ) |
| EBITDAre | |
$ | 61,602 | | |
$ | 62,438 | | |
$ | 116,942 | | |
$ | 101,176 | |
| Recoveries of credit losses | |
| - | | |
| (250 | ) | |
| (250 | ) | |
| (250 | ) |
| Amortization of key money liabilities | |
| (121 | ) | |
| (123 | ) | |
| (257 | ) | |
| (123 | ) |
| Equity-based compensation | |
| 2,578 | | |
| 2,142 | | |
| 4,046 | | |
| 5,840 | |
| Transaction costs and other | |
| 259 | | |
| 716 | | |
| 352 | | |
| 716 | |
| Non-cash interest (income) expense, net (1) | |
| (133 | ) | |
| 9 | | |
| (263 | ) | |
| (113 | ) |
| Non-cash lease expense, net | |
| 129 | | |
| 130 | | |
| 262 | | |
| 258 | |
| Casualty losses, net | |
| 935 | | |
| 119 | | |
| 1,471 | | |
| 304 | |
| Loss (income) related to non-controlling interests in consolidated joint ventures | |
| 2,971 | | |
| (9,031 | ) | |
| 3,651 | | |
| (8,949 | ) |
| Other non-cash items, net | |
| - | | |
| - | | |
| 713 | | |
| - | |
| Adjustments related to non-controlling interests in consolidated joint ventures | |
| (15,324 | ) | |
| (1,558 | ) | |
| (29,336 | ) | |
| (11,346 | ) |
| Adjusted EBITDAre | |
$ | 52,896 | | |
$ | 54,592 | | |
$ | 97,331 | | |
$ | 87,513 | |
| (1) | Non-cash interest income relates to the amortization of the discount on certain notes receivable. The
discount on these notes receivable was recorded at inception of the related loans based on the estimated value of the embedded purchase
options in the notes receivable. |
| | 12 | Page |
Summit Hotel Properties, Inc.
Pro Forma Hotel Operating Data
(Unaudited)
(In thousands)
| | |
For the Three Months Ended
June 30, | | |
For the Six Months Ended
June 30, | |
| Pro Forma Operating Data (1,2) | |
2023 | | |
2022 | | |
2023 | | |
2022 | |
| Pro forma room revenue | |
$ | 173,837 | | |
$ | 167,859 | | |
$ | 337,981 | | |
$ | 303,783 | |
| Pro forma other hotel operating revenue | |
| 20,273 | | |
| 18,148 | | |
| 39,498 | | |
| 33,052 | |
| Pro forma total revenues | |
| 194,110 | | |
| 186,007 | | |
| 377,479 | | |
| 336,835 | |
| Pro forma total hotel operating expenses | |
| 122,993 | | |
| 114,983 | | |
| 241,239 | | |
| 214,273 | |
| Pro forma hotel EBITDA | |
$ | 71,117 | | |
$ | 71,024 | | |
$ | 136,240 | | |
$ | 122,562 | |
| Pro forma hotel EBITDA Margin | |
| 36.6 | % | |
| 38.2 | % | |
| 36.1 | % | |
| 36.4 | % |
| | |
| | | |
| | | |
| | | |
| | |
| Reconciliations of Non-GAAP financial measures to comparable GAAP financial measures | |
| | | |
| | | |
| | | |
| | |
| | |
| | | |
| | | |
| | | |
| | |
| Revenue: | |
| | | |
| | | |
| | | |
| | |
| Total revenues | |
$ | 194,493 | | |
$ | 183,248 | | |
$ | 376,876 | | |
$ | 325,117 | |
| Total revenues - acquisitions (1) | |
| 1,278 | | |
| 6,953 | | |
| 4,716 | | |
| 19,157 | |
| Total revenues - dispositions (2) | |
| (1,661 | ) | |
| (4,194 | ) | |
| (4,113 | ) | |
| (7,439 | ) |
| Pro forma total revenues | |
| 194,110 | | |
| 186,007 | | |
| 377,479 | | |
| 336,835 | |
| | |
| | | |
| | | |
| | | |
| | |
| Hotel Operating Expenses: | |
| | | |
| | | |
| | | |
| | |
| Total hotel operating expenses | |
| 123,864 | | |
| 114,074 | | |
| 243,382 | | |
| 209,808 | |
| Hotel operating expenses - acquisitions (1) | |
| 790 | | |
| 4,298 | | |
| 2,279 | | |
| 11,454 | |
| Hotel operating expenses - dispositions (2) | |
| (1,661 | ) | |
| (3,389 | ) | |
| (4,422 | ) | |
| (6,989 | ) |
| Pro forma hotel operating expenses | |
| 122,993 | | |
| 114,983 | | |
| 241,239 | | |
| 214,273 | |
| | |
| | | |
| | | |
| | | |
| | |
| Hotel EBITDA: | |
| | | |
| | | |
| | | |
| | |
| Operating income | |
| 23,439 | | |
| 43,095 | | |
| 41,641 | | |
| 43,819 | |
| Loss (gain) on disposal of assets and other dispositions, net | |
| 320 | | |
| (20,484 | ) | |
| 320 | | |
| (20,484 | ) |
| Recoveries of credit losses | |
| - | | |
| (250 | ) | |
| (250 | ) | |
| (250 | ) |
| Transaction costs | |
| 260 | | |
| 681 | | |
| 266 | | |
| 681 | |
| Corporate general and administrative | |
| 9,100 | | |
| 8,074 | | |
| 17,099 | | |
| 17,211 | |
| Depreciation and amortization | |
| 37,510 | | |
| 38,058 | | |
| 74,418 | | |
| 74,332 | |
| Hotel EBITDA | |
| 70,629 | | |
| 69,174 | | |
| 133,494 | | |
| 115,309 | |
| Hotel EBITDA - acquisitions (1) | |
| (2,445 | ) | |
| (575 | ) | |
| (6,354 | ) | |
| 203 | |
| Hotel EBITDA - dispositions (2) | |
| - | | |
| (805 | ) | |
| 309 | | |
| (450 | ) |
| Same store hotel EBITDA | |
$ | 68,184 | | |
$ | 67,794 | | |
$ | 127,449 | | |
$ | 115,062 | |
| Hotel EBITDA - acquisitions (3) | |
| 2,933 | | |
| 3,230 | | |
| 8,791 | | |
| 7,500 | |
| Pro forma hotel EBITDA | |
$ | 71,117 | | |
$ | 71,024 | | |
$ | 136,240 | | |
$ | 122,562 | |
| (1) | For any hotels acquired by the Company after January 1, 2022 (the “Acquired Hotels”),
the Company has excluded the financial results of each of the Acquired Hotels for the period the Acquired Hotels were purchased by the
Company to June 30, 2023 (the “Acquisition Period”) in determining same-store hotel EBITDA. |
| (2) | For hotels sold by the Company between January 1, 2022, and June 30, 2023 (the “Disposed
Hotels”), the Company has excluded the financial results of each of the Disposed Hotels for the period beginning on January 1,
2022, and ending on the date the Disposed Hotels were sold by the Company (the “Disposition Period”) in determining same-store
hotel EBITDA. |
| (3) | Unaudited pro forma information includes operating results for 101 hotels owned as of June 30,
2023, as if all such hotels had been owned by the Company since January 1, 2022. For hotels acquired by the Company after January 1,
2022 (the “Acquired Hotels”), the Company has included in the pro forma information the financial results of each of the Acquired
Hotels for the period from January 1, 2022, to June 30, 2023. The financial results for the Acquired Hotels include information
provided by the third-party owner of such Acquired Hotel prior to purchase by the Company and have not been audited or reviewed by our
auditors or adjusted by us. The pro forma information is included to enable comparison of results for the current reporting period to
results for the comparable period of the prior year and are not indicative of future results. |
| | 13 | Page |
Summit Hotel Properties, Inc.
Pro Forma Hotel Operating Data
(Unaudited)
(In thousands, except operating statistics)
| | |
2022 | | |
2023 | | |
Trailing Twelve | |
| Pro Forma Operating Data (1,2) | |
Q3 | | |
Q4 | | |
Q1 | | |
Q2 | | |
Months Ended
June 30, 2023 | |
| Pro forma room revenue | |
$ | 157,960 | | |
$ | 152,776 | | |
$ | 164,144 | | |
$ | 173,837 | | |
$ | 648,717 | |
| Pro forma other hotel operating revenue | |
| 17,964 | | |
| 18,597 | | |
| 19,225 | | |
| 20,273 | | |
| 76,059 | |
| Pro forma total revenues | |
| 175,924 | | |
| 171,373 | | |
| 183,369 | | |
| 194,110 | | |
| 724,776 | |
| Pro forma total hotel operating expenses | |
| 115,209 | | |
| 108,447 | | |
| 118,246 | | |
| 122,993 | | |
| 464,895 | |
| Pro forma hotel EBITDA | |
$ | 60,715 | | |
$ | 62,926 | | |
$ | 65,123 | | |
$ | 71,117 | | |
$ | 259,881 | |
| Pro forma hotel EBITDA Margin | |
| 34.5 | % | |
| 36.7 | % | |
| 35.5 | % | |
| 36.6 | % | |
| 35.9 | % |
| | |
| | | |
| | | |
| | | |
| | | |
| | |
| Pro Forma Statistics (1,2) | |
| | | |
| | | |
| | | |
| | | |
| | |
| Rooms sold | |
| 989,042 | | |
| 948,793 | | |
| 940,790 | | |
| 1,032,690 | | |
| 3,911,315 | |
| Rooms available | |
| 1,382,944 | | |
| 1,382,983 | | |
| 1,353,060 | | |
| 1,368,094 | | |
| 5,487,081 | |
| Occupancy | |
| 71.5 | % | |
| 68.6 | % | |
| 69.5 | % | |
| 75.5 | % | |
| 71.3 | % |
| ADR | |
$ | 159.71 | | |
$ | 161.02 | | |
$ | 174.47 | | |
$ | 168.33 | | |
$ | 165.86 | |
| RevPAR | |
$ | 114.22 | | |
$ | 110.47 | | |
$ | 121.31 | | |
$ | 127.06 | | |
$ | 118.23 | |
| | |
| | | |
| | | |
| | | |
| | | |
| | |
| Actual Statistics | |
| | | |
| | | |
| | | |
| | | |
| | |
| Rooms sold | |
| 1,010,996 | | |
| 963,151 | | |
| 950,214 | | |
| 1,039,045 | | |
| 3,963,406 | |
| Rooms available | |
| 1,409,716 | | |
| 1,410,358 | | |
| 1,380,060 | | |
| 1,376,796 | | |
| 5,576,930 | |
| Occupancy | |
| 71.7 | % | |
| 68.3 | % | |
| 68.9 | % | |
| 75.5 | % | |
| 71.1 | % |
| ADR | |
$ | 158.39 | | |
$ | 159.50 | | |
$ | 171.63 | | |
$ | 167.64 | | |
$ | 164.26 | |
| RevPAR | |
$ | 113.59 | | |
$ | 108.92 | | |
$ | 118.18 | | |
$ | 126.51 | | |
$ | 116.74 | |
| | |
| | | |
| | | |
| | | |
| | | |
| | |
| Reconciliations of Non-GAAP financial measures to comparable GAAP financial measures | |
| | | |
| | | |
| | | |
| | | |
| | |
| | |
| | | |
| | | |
| | | |
| | | |
| | |
| Revenue: | |
| | | |
| | | |
| | | |
| | | |
| | |
| Total revenues | |
$ | 178,252 | | |
$ | 172,326 | | |
$ | 182,383 | | |
$ | 194,493 | | |
$ | 727,454 | |
| Total revenues from acquisitions (1) | |
| 1,934 | | |
| 2,090 | | |
| 3,438 | | |
| 1,278 | | |
| 8,740 | |
| Total revenues from dispositions (2) | |
| (4,262 | ) | |
| (3,043 | ) | |
| (2,452 | ) | |
| (1,661 | ) | |
| (11,418 | ) |
| Pro forma total revenues | |
| 175,924 | | |
| 171,373 | | |
| 183,369 | | |
| 194,110 | | |
| 724,776 | |
| | |
| | | |
| | | |
| | | |
| | | |
| | |
| Hotel Operating Expenses: | |
| | | |
| | | |
| | | |
| | | |
| | |
| Total hotel operating expenses | |
| 117,149 | | |
| 110,277 | | |
| 119,518 | | |
| 123,864 | | |
| 470,808 | |
| Total hotel operating expenses from acquisitions (1) | |
| 1,131 | | |
| 900 | | |
| 1,489 | | |
| 790 | | |
| 4,310 | |
| Total hotel operating expenses from dispositions (2) | |
| (3,071 | ) | |
| (2,730 | ) | |
| (2,761 | ) | |
| (1,661 | ) | |
| (10,223 | ) |
| Pro forma total hotel operating expenses | |
| 115,209 | | |
| 108,447 | | |
| 118,246 | | |
| 122,993 | | |
| 464,895 | |
| | |
| | | |
| | | |
| | | |
| | | |
| | |
| Hotel EBITDA: | |
| | | |
| | | |
| | | |
| | | |
| | |
| Operating income | |
| 17,230 | | |
| 6,733 | | |
| 18,202 | | |
| 23,439 | | |
| 65,604 | |
| Loss (gain) on disposal of assets and other dispositions, net | |
| 5 | | |
| 164 | | |
| - | | |
| 320 | | |
| 489 | |
| Loss on write down of assets | |
| - | | |
| 10,420 | | |
| - | | |
| - | | |
| 10,420 | |
| Recoveries of credit losses | |
| (850 | ) | |
| - | | |
| (250 | ) | |
| - | | |
| (1,100 | ) |
| Transaction costs | |
| 56 | | |
| 12 | | |
| 6 | | |
| 260 | | |
| 334 | |
| Corporate general and administrative | |
| 6,532 | | |
| 7,022 | | |
| 7,999 | | |
| 9,100 | | |
| 30,653 | |
| Depreciation and amortization | |
| 38,130 | | |
| 37,698 | | |
| 36,908 | | |
| 37,510 | | |
| 150,246 | |
| Hotel EBITDA | |
| 61,103 | | |
| 62,049 | | |
| 62,865 | | |
| 70,629 | | |
| 256,646 | |
| Hotel EBITDA from acquisitions (1) | |
| (205 | ) | |
| (2,899 | ) | |
| (3,909 | ) | |
| (2,445 | ) | |
| (9,458 | ) |
| Hotel EBITDA from dispositions (2) | |
| (1,191 | ) | |
| (313 | ) | |
| 309 | | |
| - | | |
| (1,195 | ) |
| Same store hotel EBITDA | |
$ | 59,707 | | |
$ | 58,837 | | |
$ | 59,265 | | |
$ | 68,184 | | |
$ | 245,993 | |
| Hotel EBITDA from acquisitions (3) | |
| 1,008 | | |
| 4,089 | | |
| 5,858 | | |
| 2,933 | | |
| 13,888 | |
| Pro forma hotel EBITDA | |
$ | 60,715 | | |
$ | 62,926 | | |
$ | 65,123 | | |
$ | 71,117 | | |
$ | 259,881 | |
| (1) | For any hotels acquired by the Company after July 1, 2022 (the “Acquired Hotels”),
the Company has excluded the financial results of each of the Acquired Hotels for the period the Acquired Hotels were purchased by the
Company to June 30, 2023 (the “Acquisition Period”) in determining same-store hotel EBITDA. |
| (2) | For hotels sold by the Company between July 1, 2022, and June 30, 2023 (the “Disposed
Hotels”), the Company has excluded the financial results of each of the Disposed Hotels for the period beginning on July 1,
2022, and ending on the date the Disposed Hotels were sold by the Company (the “Disposition Period”) in determining same-store
hotel EBITDA. |
| (3) | Unaudited pro forma information includes operating results for 101 hotels owned as of June 30,
2023, as if all such hotels had been owned by the Company since July 1, 2022. For hotels acquired by the Company after July 1,
2022 (the “Acquired Hotels”), the Company has included in the pro forma information the financial results of each of the Acquired
Hotels for the period from July 1, 2022, to June 30, 2023. The financial results for the Acquired Hotels include information
provided by the third-party owner of such Acquired Hotel prior to purchase by the Company and have not been audited or reviewed by our
auditors or adjusted by us. The pro forma information is included to enable comparison of results for the current reporting period to
results for the comparable period of the prior year and are not indicative of future results. |
| | 14 | Page |
Summit Hotel Properties, Inc.
Pro Forma and Same Store Data
(Unaudited)
| | |
For the Three Months Ended
June 30, | | |
For the Six Months Ended
June 30, | |
| | |
2023 | | |
2022 | | |
2023 | | |
2022 | |
| Pro Forma (101) | |
| | | |
| | | |
| | | |
| | |
| Rooms sold | |
| 1,032,690 | | |
| 1,016,362 | | |
| 1,973,480 | | |
| 1,882,374 | |
| Rooms available | |
| 1,368,094 | | |
| 1,367,882 | | |
| 2,721,154 | | |
| 2,706,209 | |
| Occupancy | |
| 75.5 | % | |
| 74.3 | % | |
| 72.5 | % | |
| 69.6 | % |
| ADR | |
$ | 168.33 | | |
$ | 165.16 | | |
$ | 171.26 | | |
$ | 161.38 | |
| RevPAR | |
$ | 127.06 | | |
$ | 122.71 | | |
$ | 124.20 | | |
$ | 112.25 | |
| | |
| | | |
| | | |
| | | |
| | |
| Occupancy change | |
| 1.6 | % | |
| | | |
| 4.3 | % | |
| | |
| ADR change | |
| 1.9 | % | |
| | | |
| 6.1 | % | |
| | |
| RevPAR change | |
| 3.5 | % | |
| | | |
| 10.6 | % | |
| | |
| | |
For the Three Months Ended
June 30, | | |
For the Six Months Ended
June 30, | |
| | |
2023 | | |
2022 | | |
2023 | | |
2022 | |
| Same-Store (95) | |
| | | |
| | | |
| | | |
| | |
| Rooms sold | |
| 992,651 | | |
| 979,471 | | |
| 1,890,386 | | |
| 1,814,858 | |
| Rooms available | |
| 1,311,856 | | |
| 1,311,856 | | |
| 2,609,296 | | |
| 2,609,265 | |
| Occupancy | |
| 75.7 | % | |
| 74.7 | % | |
| 72.4 | % | |
| 69.6 | % |
| ADR | |
$ | 167.70 | | |
$ | 164.06 | | |
$ | 169.21 | | |
$ | 159.37 | |
| RevPAR | |
$ | 126.89 | | |
$ | 122.49 | | |
$ | 122.59 | | |
$ | 110.85 | |
| | |
| | | |
| | | |
| | | |
| | |
| Occupancy change | |
| 1.3 | % | |
| | | |
| 4.2 | % | |
| | |
| ADR change | |
| 2.2 | % | |
| | | |
| 6.2 | % | |
| | |
| RevPAR change | |
| 3.6 | % | |
| | | |
| 10.6 | % | |
| | |
| (1) | Unaudited pro forma information includes operating results for 101 hotels owned as of June 30,
2023, as if each hotel had been owned by the Company since January 1, 2022. As a result, these pro forma operating and financial
measures include operating results for certain hotels for periods prior to the Company’s ownership. |
| (2) | Same-store information includes operating results for 95 hotels owned by the Company as of January 1,
2022, and at all times during the three and six months ended June 30, 2023, and 2022. |
| | 15 | Page |
Summit Hotel Properties, Inc.
Reconciliation of Net (Loss) Income to Non-GAAP Measures – EBITDA for Financial Outlook
(in thousands)
(Unaudited)
| | |
FYE 2023 Outlook | |
| | |
Low | | |
High | |
| Net loss | |
$ | (20,400 | ) | |
$ | (7,700 | ) |
| Depreciation and amortization | |
| 149,900 | | |
| 149,900 | |
| Interest expense | |
| 87,600 | | |
| 87,300 | |
| Interest income | |
| (200 | ) | |
| (200 | ) |
| Income tax expense | |
| 2,900 | | |
| 2,900 | |
| EBITDA | |
$ | 219,800 | | |
$ | 232,200 | |
| Loss on disposal of assets and other dispositions, net | |
| 400 | | |
| 400 | |
| EBITDAre | |
$ | 220,200 | | |
$ | 232,600 | |
| Recoveries of credit losses | |
| (300 | ) | |
| (300 | ) |
| Amortization of key money liabilities | |
| (300 | ) | |
| (300 | ) |
| Equity-based compensation | |
| 7,500 | | |
| 7,500 | |
| Transaction costs and other | |
| 500 | | |
| 500 | |
| Other non-cash items, net | |
| 2,500 | | |
| 2,500 | |
| Loss related to non-controlling interests in consolidated joint ventures | |
| 12,100 | | |
| 9,700 | |
| Adjustments related to non-controlling interests in consolidated joint ventures | |
| (59,200 | ) | |
| (59,200 | ) |
| Adjusted EBITDAre | |
$ | 183,000 | | |
$ | 193,000 | |
| | 16 | Page |
Summit Hotel Properties, Inc.
Reconciliation of Net (Loss) Income to Non-GAAP Measures – Funds From Operations for Financial Outlook
(In thousands except per share and unit)
(Unaudited)
| | |
FYE 2023 Outlook | |
| | |
Low | | |
High | |
| Net loss | |
$ | (20,400 | ) | |
$ | (7,700 | ) |
| Preferred dividends | |
| (15,900 | ) | |
| (15,900 | ) |
| Distributions to and accretion of redeemable non-controlling interests | |
| (2,600 | ) | |
| (2,600 | ) |
| Loss related to non-controlling interests in consolidated joint ventures | |
| 12,100 | | |
| 9,700 | |
| Net loss applicable to Common Stock and Common Units | |
$ | (26,800 | ) | |
$ | (16,500 | ) |
| Real estate-related depreciation | |
| 146,500 | | |
| 146,500 | |
| Loss on disposal of assets and other dispositions, net | |
| 400 | | |
| 400 | |
| Adjustments related to non-controlling interests in consolidated joint ventures | |
| (31,500 | ) | |
| (31,500 | ) |
| FFO applicable to Common Stock and Common Units | |
$ | 88,600 | | |
$ | 98,900 | |
| Recoveries of credit losses | |
| (300 | ) | |
| (300 | ) |
| Amortization of debt issuance costs | |
| 6,200 | | |
| 6,200 | |
| Amortization of franchise fees | |
| 600 | | |
| 600 | |
| Amortization of intangible assets, net | |
| 1,800 | | |
| 1,800 | |
| Equity-based compensation | |
| 7,500 | | |
| 7,500 | |
| Transaction costs and other | |
| 500 | | |
| 500 | |
| Other non-cash items, net | |
| 3,400 | | |
| 3,400 | |
| Adjustments related to non-controlling interests in consolidated joint ventures | |
| (3,300 | ) | |
| (3,300 | ) |
| AFFO applicable to Common Stock and Common Units | |
$ | 105,000 | | |
$ | 115,300 | |
| Weighted average diluted shares of Common Stock and Common Units for FFO and AFFO | |
| 122,400 | | |
| 122,400 | |
| FFO per Common Stock and Common Units | |
$ | 0.72 | | |
$ | 0.81 | |
| AFFO per Common Stock and Common Units | |
$ | 0.86 | | |
$ | 0.94 | |
| | 17 | Page |
Non-GAAP Financial Measures
We disclose certain “non-GAAP financial
measures,” which are measures of our historical financial performance. Non-GAAP financial measures are financial measures not prescribed
by Generally Accepted Accounting Principles ("GAAP"). These measures are as follows: (i) Funds From Operations (“FFO”)
and Adjusted Funds from Operations ("AFFO"), (ii) Earnings before Interest, Taxes, Depreciation and Amortization ("EBITDA"),
Earnings before Interest, Taxes, Depreciation and Amortization for Real Estate ("EBITDAre") and Adjusted EBITDAre,
and Hotel EBITDA (as described below). We caution investors that amounts presented in accordance with our definitions of non-GAAP financial
measures may not be comparable to similar measures disclosed by other companies, since not all companies calculate these non-GAAP financial
measures in the same manner. Our non-GAAP financial measures should be considered along with, but not as alternatives to, net income (loss)
as a measure of our operating performance. Our non-GAAP financial measures may include funds that may not be available for our discretionary
use due to functional requirements to conserve funds for capital expenditures, property acquisitions, debt service obligations and other
commitments and uncertainties. Although we believe that our non-GAAP financial measures can enhance the understanding of our financial
condition and results of operations, these non-GAAP financial measures are not necessarily better indicators of any trend as compared
to a comparable measure prescribed by GAAP such as net income (loss).
Funds From Operations (“FFO”)
and Adjusted FFO (“AFFO”)
As defined by Nareit, FFO represents net income
or loss (computed in accordance with GAAP), excluding preferred dividends, gains (or losses) from sales of real property, impairment losses
on real estate assets, items classified by GAAP as extraordinary, the cumulative effect of changes in accounting principles, plus depreciation
and amortization related to real estate assets, and adjustments for unconsolidated partnerships, and joint ventures. AFFO represents FFO
excluding amortization of deferred financing costs, franchise fees, equity-based compensation expense, transaction costs, debt transaction
costs, premiums on redemption of preferred shares, losses from net casualties, non-cash interest income and non-cash income tax related
adjustments to our deferred tax asset. Unless otherwise indicated, we present FFO and AFFO applicable to our common shares and common
units. We present FFO and AFFO because we consider FFO and AFFO an important supplemental measure of our operational performance and believe
it is frequently used by securities analysts, investors, and other interested parties in the evaluation of REITs, many of which present
FFO and AFFO when reporting their results. FFO and AFFO are intended to exclude GAAP historical cost depreciation and amortization, which
assumes that the value of real estate assets diminishes ratably over time. Historically, however, real estate values have risen or fallen
with market conditions. Because FFO and AFFO exclude depreciation and amortization related to real estate assets, gains and losses from
real property dispositions and impairment losses on real estate assets, and certain transaction costs related to lodging property acquisition
activities and debt, FFO and AFFO provide performance measures that, when compared year over year, reflect the effect to operations from
trends in occupancy, guestroom rates, operating costs, development activities and interest costs, providing perspective not immediately
apparent from net income. Our computation of FFO differs slightly from the computation of Nareit-defined FFO related to the reporting
of depreciation and amortization expense on assets at our corporate offices, which is de minimus. Our computation of FFO may also differ
from the methodology for calculating FFO used by other equity REITs and, accordingly, may not be comparable to such other REITs. FFO and
AFFO should not be considered as an alternative to net income (loss) (computed in accordance with GAAP) as an indicator of our liquidity,
nor is it indicative of funds available to fund our cash needs, including our ability to pay dividends or make distributions. Where indicated
in this release, FFO is based on our computation of FFO and not the computation of Nareit-defined FFO unless otherwise noted.
| | 18 | Page |
EBITDA, EBITDAre, Adjusted EBITDAre,
and Hotel EBITDA
In September 2017, Nareit proposed a standardized
performance measure, called EBITDAre, which is based on EBITDA and is expected to provide additional relevant information about
REITs as real estate companies in support of growing interest among generalist investors. The conclusion was reached that, while dedicated
REIT investors have long been accustomed to utilizing the industry’s supplemental measures such as FFO and net operating income
(“NOI”) to evaluate the investment quality of REITs as real estate companies, it would be helpful to generalist investors
for REITs as real estate companies to also present EBITDAre as a more widely known and understood supplemental measure of
performance. EBITDAre is intended to be a supplemental non-GAAP performance measure that is independent of a company’s
capital structure and will provide a uniform basis for one measurement of the enterprise value of a company compared to other REITs.
EBITDAre, as defined by Nareit, is calculated
as EBITDA, excluding: (i) loss and gains on disposition of property and (ii) asset impairments, if any. We believe EBITDAre
is useful to an investor in evaluating our operating performance because it provides investors with an indication of our ability to incur
and service debt, to satisfy general operating expenses, to make capital expenditures and to fund other cash needs or reinvest cash into
our business. We also believe it helps investors meaningfully evaluate and compare the results of our operations from period to period
by removing the effect of our asset base (primarily depreciation and amortization) from our operating results.
We make additional adjustments to EBITDAre when
evaluating our performance because we believe that the exclusion of certain additional non-recurring or unusual items described below
provides useful supplemental information to investors regarding our ongoing operating performance. We believe that the presentation of
Adjusted EBITDAre, when combined with the primary GAAP presentation of net income, is useful to an investor in evaluating our operating
performance because it provides investors with an indication of our ability to incur and service debt, to satisfy general operating expenses,
to make capital expenditures and to fund other cash needs or reinvest cash into our business. We also believe it helps investors meaningfully
evaluate and compare the results of our operations from period to period by removing the effect of our asset base (primarily depreciation
and amortization) from our operating results.
With respect to hotel
EBITDA, we believe that excluding the effect of corporate-level expenses and non-cash items provides a more complete understanding of
the operating results over which individual hotels and operators have direct control. We believe the property-level results provide investors
with supplemental information on the ongoing operational performance of our hotels and effectiveness of the third-party management companies
operating our business on a property-level basis.
We caution investors
that amounts presented in accordance with our definitions of EBITDA, EBITDAre, adjusted EBITDAre, and hotel EBITDA may not
be comparable to similar measures disclosed by other companies, since not all companies calculate these non-GAAP measures in the same
manner. EBITDA, EBITDAre, adjusted EBITDAre, and hotel EBITDA should not be considered as an alternative measure of our
net income (loss) or operating performance. EBITDA, EBITDAre, adjusted EBITDAre, and hotel EBITDA may include funds that
may not be available for our discretionary use due to functional requirements to conserve funds for capital expenditures and property
acquisitions and other commitments and uncertainties. Although we believe that EBITDA, EBITDAre, adjusted EBITDAre, and
hotel EBITDA can enhance your understanding of our financial condition and results of operations, these non-GAAP financial measures are
not necessarily a better indicator of any trend as compared to a comparable GAAP measure such as net income (loss). Above, we include
a quantitative reconciliation of EBITDA, EBITDAre, adjusted EBITDAre and hotel EBITDA to the most directly comparable GAAP
financial performance measure, which is net income (loss) and operating income (loss).
| | 19 | Page |
Exhibit 99.2
| EARNINGS RELEASE SUPPLEMENT
SECOND QUARTER 2023
(UNAUDITED)
AUGUST 3, 2023 |
| Table of Contents
Section I Forward-Looking Statements and Non-GAAP Financial Measure Disclosures
Section II Corporate Financial Schedules
Section III Operating & Property-Level Schedules
Section IV Capitalization and Debt Schedules
Section V Asset Listing
2 |
| Forward-Looking Statements
We make forward-looking statements in this presentation that are subject to risks and uncertainties. These forward-looking statements include information about possible or
assumed future results of our business, financial condition, liquidity, results of operations, plans, and objectives. When we use the words “believe,” “expect,” “anticipate,”
“estimate,” “plan,” “continue,” “intend,” “should,” “may,” or similar expressions, we intend to identify forward-looking statements. Statements regarding the following subjects,
among others, may be forward-looking by their nature:
• our ability to increase our dividend per share of common stock;
• the state of the U.S. economy generally or in specific geographic regions in which we operate, and the effect of general economic conditions on the lodging
industry and our business in particular;
• market trends in our industry, interest rates, real estate values and the capital markets;
• our business and investment strategy and, particularly, our ability to identify and complete hotel acquisitions and dispositions;
• our projected operating results;
• actions and initiatives of the U.S. government and changes to U.S. government policies and the execution and impact of such actions, initiatives and policies;
• our ability to manage our relationships with our management companies and franchisors;
• our ability to maintain our existing and future financing arrangements;
• changes in the value of our properties;
• the impact of and changes in governmental regulations, tax law and rates, accounting guidance and similar matters;
• our ability to satisfy the requirements for qualification as a REIT under the U.S. Tax Code;
• our ability to repay or refinance our indebtedness as it matures or becomes callable by lenders;
• the availability of qualified personnel;
• our ability to make distributions to our stockholders in the future;
• the general volatility of the market price of our securities; and
• the degree and nature of our competition.
Forward-looking statements are based on our beliefs, assumptions and expectations of our future performance, taking into account information currently available to us. You
should not place undue reliance on these forward-looking statements. These beliefs, assumptions and expectations can change as a result of many possible events or factors, not
all of which are known to us. These factors are discussed under “Item 1A. Risk Factors” in our Annual Report on Form 10-K for the year ended December 31, 2022, and in other
documents we have filed with the Securities and Exchange Commission. If a change occurs, our business, financial condition, liquidity and results of operations may vary
materially from those expressed in our forward-looking statements. Any forward-looking statement is effective only as of the date on which it is made. New risks and
uncertainties arise over time, and it is not possible for us to predict those events or how they may affect us. Except as required by law we are not obligated to, and do not intend
to, publicly update or revise any forward-looking statements, whether as a result of new information, future events or otherwise.
Additionally, this presentation contains certain unaudited historical and pro forma information and metrics which are based or calculated from historical data that is maintained or
produced by Summit Hotel Properties, Inc. or third parties. This presentation contain statistics and other data that may have been obtained from, or compiled from, information
made available by third-parties.
3 |
| Non-GAAP Financial Measures
We disclose certain “non-GAAP financial measures,” which are measures of our historical financial performance. Non-GAAP financial measures are financial measures not
prescribed by Generally Accepted Accounting Principles ("GAAP"). These measures are as follows: (i) Funds From Operations (“FFO”) and Adjusted Funds from Operations
("AFFO"), (ii) Earnings before Interest, Taxes, Depreciation and Amortization ("EBITDA"), Earnings before Interest, Taxes, Depreciation and Amortization for Real Estate
("EBITDAre") and Adjusted EBITDAre (as described below). We caution investors that amounts presented in accordance with our definitions of non-GAAP financial measures
may not be comparable to similar measures disclosed by other companies, since not all companies calculate these non-GAAP financial measures in the same manner. Our
non-GAAP financial measures should be considered along with, but not as alternatives to, net income (loss) as a measure of our operating performance. Our non-GAAP
financial measures may include funds that may not be available for our discretionary use due to functional requirements to conserve funds for capital expenditures, property
acquisitions, debt service obligations and other commitments and uncertainties. Although we believe that our non-GAAP financial measures can enhance the understanding
of our financial condition and results of operations, these non-GAAP financial measures are not necessarily better indicators of any trend as compared to a comparable
measure prescribed by GAAP such as net income (loss).
FFO and AFFO
As defined by Nareit, FFO represents net income or loss (computed in accordance with GAAP), excluding preferred dividends, gains (or losses) from sales of real
property, impairment losses on real estate assets, items classified by GAAP as extraordinary, the cumulative effect of changes in accounting principles, plus depreciation and
amortization related to real estate assets, and adjustments for unconsolidated partnerships, and joint ventures. AFFO represents FFO excluding amortization of deferred
financing costs, franchise fees, equity-based compensation expense, transaction costs, debt transaction costs, premiums on redemption of preferred shares, losses from net
casualties, non-cash interest income and non-cash income tax related adjustments to our deferred tax asset. Unless otherwise indicated, we present FFO and AFFO applicable
to our common shares and common units. We present FFO and AFFO because we consider FFO and AFFO an important supplemental measure of our operational
performance and believe it is frequently used by securities analysts, investors and other interested parties in the evaluation of REITs, many of which present FFO and AFFO
when reporting their results. FFO and AFFO are intended to exclude GAAP historical cost depreciation and amortization, which assumes that the value of real estate assets
diminishes ratably over time. Historically, however, real estate values have risen or fallen with market conditions. Because FFO and AFFO exclude depreciation and amortization
related to real estate assets, gains and losses from real property dispositions and impairment losses on real estate assets, and certain transaction costs related to lodging
property acquisition activities and debt, FFO and AFFO provide performance measures that, when compared year over year, reflect the effect to operations from trends in
occupancy, guestroom rates, operating costs, development activities and interest costs, providing perspective not immediately apparent from net income. Our computation of
FFO differs slightly from the computation of Nareit-defined FFO related to the reporting of depreciation and amortization expense on assets at our corporate offices, which is
de minimus. Our computation of FFO may also differ from the methodology for calculating FFO used by other equity REITs and, accordingly, may not be comparable to such
other REITs. FFO and AFFO should not be considered as an alternative to net income (loss) (computed in accordance with GAAP) as an indicator of our liquidity, nor is it
indicative of funds available to fund our cash needs, including our ability to pay dividends or make distributions. Where indicated in this Earnings Release Supplement, FFO is
based on our computation of FFO and not the computation of Nareit-defined FFO unless otherwise noted.
4 |
| Non-GAAP Financial Measures (cont.)
EBITDAre and Adjusted EBITDAre
In September 2017, Nareit proposed a standardized performance measure, called EBITDAre, which is based on EBITDA and is expected to provide
additional relevant information about REITs as real estate companies in support of growing interest among generalist investors. The conclusion was reached
that, while dedicated REIT investors have long been accustomed to utilizing the industry’s supplemental measures such as FFO and net operating income
(“NOI”) to evaluate the investment quality of REITs as real estate companies, it would be helpful to generalist investors for REITs as real estate companies to also
present EBITDAre as a more widely known and understood supplemental measure of performance. EBITDAre is intended to be a supplemental non-GAAP
performance measure that is independent of a company’s capital structure and will provide a uniform basis for one measurement of the enterprise value of a
company compared to other REITs.
EBITDAre, as defined by Nareit, is calculated as EBITDA, excluding: (i) loss and gains on disposition of property and (ii) asset impairments, if any. We
believe EBITDAre is useful to an investor in evaluating our operating performance because it provides investors with an indication of our ability to incur and
service debt, to satisfy general operating expenses, to make capital expenditures and to fund other cash needs or reinvest cash into our business. We also
believe it helps investors meaningfully evaluate and compare the results of our operations from period to period by removing the effect of our asset base
(primarily depreciation and amortization) from our operating results.
We make additional adjustments to EBITDAre when evaluating our performance because we believe that the exclusion of certain additional non-recurring or unusual items described below provides useful supplemental information to investors regarding our ongoing operating performance. We believe
that the presentation of Adjusted EBITDAre, when combined with the primary GAAP presentation of net income, is useful to an investor in evaluating our
operating performance because it provides investors with an indication of our ability to incur and service debt, to meet general operating expenses, to make
capital expenditures and to fund other cash needs, or reinvest cash into our business. We also believe it helps investors meaningfully evaluate and compare
the results of our operations from period to period by removing the effect of our asset base (primarily depreciation and amortization) from our operating
results.
5 |
| Table of Contents
Section I Forward-Looking Statements and Non-GAAP Financial Measure Disclosures
Section II Corporate Financial Schedules
Section III Operating & Property-Level Schedules
Section IV Capitalization and Debt Schedules
Section V Asset Listing
6 |
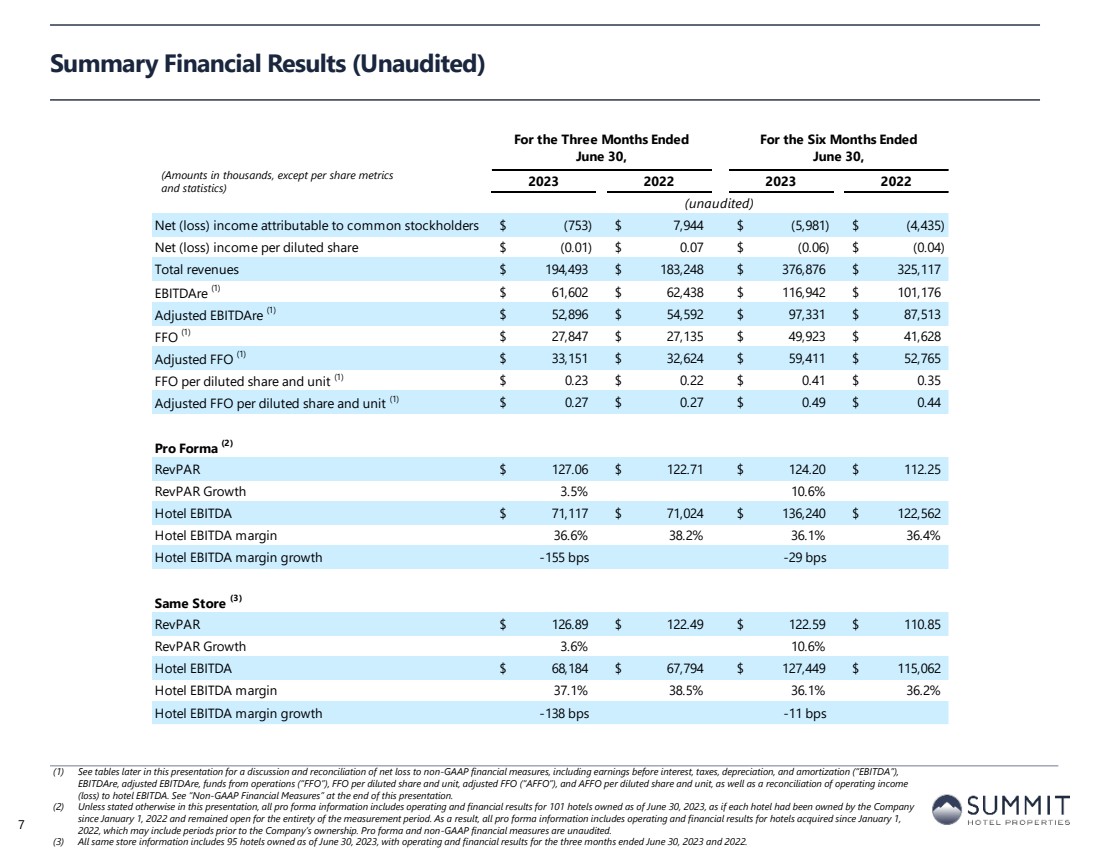
| For the Three Months Ended
June 30,
For the Six Months Ended
June 30,
2023 2022 2023 2022
(unaudited)
Net (loss) income attributable to common stockholders $ (753) $ 7,944 $ (5,981) $ (4,435)
Net (loss) income per diluted share $ (0.01) $ 0.07 $ (0.06) $ (0.04)
Total revenues $ 194,493 $ 183,248 $ 376,876 $ 325,117
EBITDAre (1) $ 61,602 $ 62,438 $ 116,942 $ 101,176
Adjusted EBITDAre (1) $ 52,896 $ 54,592 $ 97,331 $ 87,513
FFO (1) $ 27,847 $ 27,135 $ 49,923 $ 41,628
Adjusted FFO (1) $ 33,151 $ 32,624 $ 59,411 $ 52,765
FFO per diluted share and unit (1) $ 0.23 $ 0.22 $ 0.41 $ 0.35
Adjusted FFO per diluted share and unit (1) $ 0.27 $ 0.27 $ 0.49 $ 0.44
Pro Forma (2)
RevPAR $ 127.06 $ 122.71 $ 124.20 $ 112.25
RevPAR Growth 3.5% 10.6%
Hotel EBITDA $ 71,117 $ 71,024 $ 136,240 $ 122,562
Hotel EBITDA margin 36.6% 38.2% 36.1% 36.4%
Hotel EBITDA margin growth -155 bps -29 bps
Same Store (3)
RevPAR $ 126.89 $ 122.49 $ 122.59 $ 110.85
RevPAR Growth 3.6% 10.6%
Hotel EBITDA $ 68,184 $ 67,794 $ 127,449 $ 115,062
Hotel EBITDA margin 37.1% 38.5% 36.1% 36.2%
Hotel EBITDA margin growth -138 bps -11 bps
Summary Financial Results (Unaudited)
(1) See tables later in this presentation for a discussion and reconciliation of net loss to non-GAAP financial measures, including earnings before interest, taxes, depreciation, and amortization (“EBITDA”),
EBITDAre, adjusted EBITDAre, funds from operations (“FFO”), FFO per diluted share and unit, adjusted FFO (“AFFO”), and AFFO per diluted share and unit, as well as a reconciliation of operating income
(loss) to hotel EBITDA. See “Non-GAAP Financial Measures” at the end of this presentation.
(2) Unless stated otherwise in this presentation, all pro forma information includes operating and financial results for 101 hotels owned as of June 30, 2023, as if each hotel had been owned by the Company
since January 1, 2022 and remained open for the entirety of the measurement period. As a result, all pro forma information includes operating and financial results for hotels acquired since January 1,
2022, which may include periods prior to the Company’s ownership. Pro forma and non-GAAP financial measures are unaudited.
(3) All same store information includes 95 hotels owned as of June 30, 2023, with operating and financial results for the three months ended June 30, 2023 and 2022.
(Amounts in thousands, except per share metrics
and statistics)
7 |
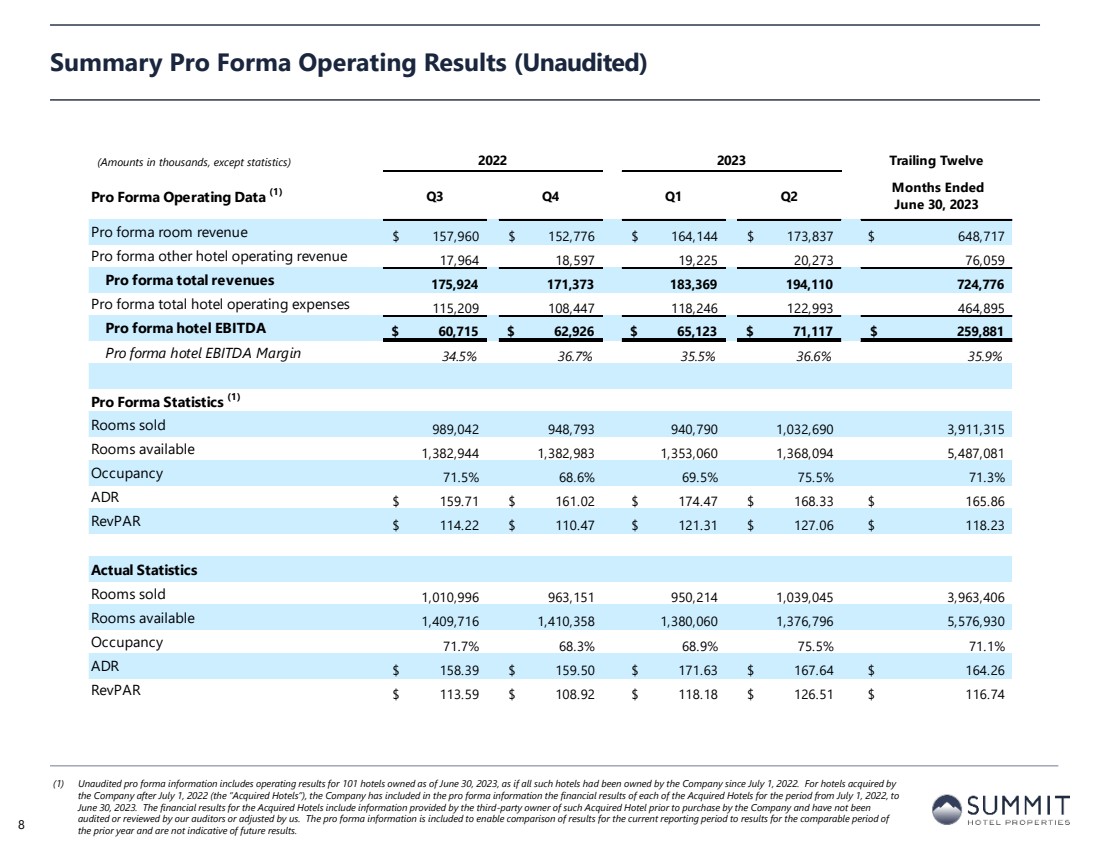
| 2022 2023 Trailing Twelve
Pro Forma Operating Data (1) Q3 Q4 Q1 Q2 Months Ended
June 30, 2023
Pro forma room revenue $ 157,960 $ 152,776 $ 164,144 $ 173,837 $ 648,717
Pro forma other hotel operating revenue 17,964 18,597 19,225 20,273 76,059
Pro forma total revenues 175,924 171,373 183,369 194,110 724,776
Pro forma total hotel operating expenses 115,209 108,447 118,246 122,993 464,895
Pro forma hotel EBITDA $ 60,715 $ 62,926 $ 65,123 $ 71,117 $ 259,881
Pro forma hotel EBITDA Margin 34.5% 36.7% 35.5% 36.6% 35.9%
Pro Forma Statistics (1)
Rooms sold 989,042 948,793 940,790 1,032,690 3,911,315
Rooms available 1,382,944 1,382,983 1,353,060 1,368,094 5,487,081
Occupancy 71.5% 68.6% 69.5% 75.5% 71.3%
ADR $ 159.71 $ 161.02 $ 174.47 $ 168.33 $ 165.86
RevPAR $ 114.22 $ 110.47 $ 121.31 $ 127.06 $ 118.23
Actual Statistics
Rooms sold 1,010,996 963,151 950,214 1,039,045 3,963,406
Rooms available 1,409,716 1,410,358 1,380,060 1,376,796 5,576,930
Occupancy 71.7% 68.3% 68.9% 75.5% 71.1%
ADR $ 158.39 $ 159.50 $ 171.63 $ 167.64 $ 164.26
RevPAR $ 113.59 $ 108.92 $ 118.18 $ 126.51 $ 116.74
Summary Pro Forma Operating Results (Unaudited)
(1) Unaudited pro forma information includes operating results for 101 hotels owned as of June 30, 2023, as if all such hotels had been owned by the Company since July 1, 2022. For hotels acquired by
the Company after July 1, 2022 (the “Acquired Hotels”), the Company has included in the pro forma information the financial results of each of the Acquired Hotels for the period from July 1, 2022, to
June 30, 2023. The financial results for the Acquired Hotels include information provided by the third-party owner of such Acquired Hotel prior to purchase by the Company and have not been
audited or reviewed by our auditors or adjusted by us. The pro forma information is included to enable comparison of results for the current reporting period to results for the comparable period of
the prior year and are not indicative of future results. 8
(Amounts in thousands, except statistics) |
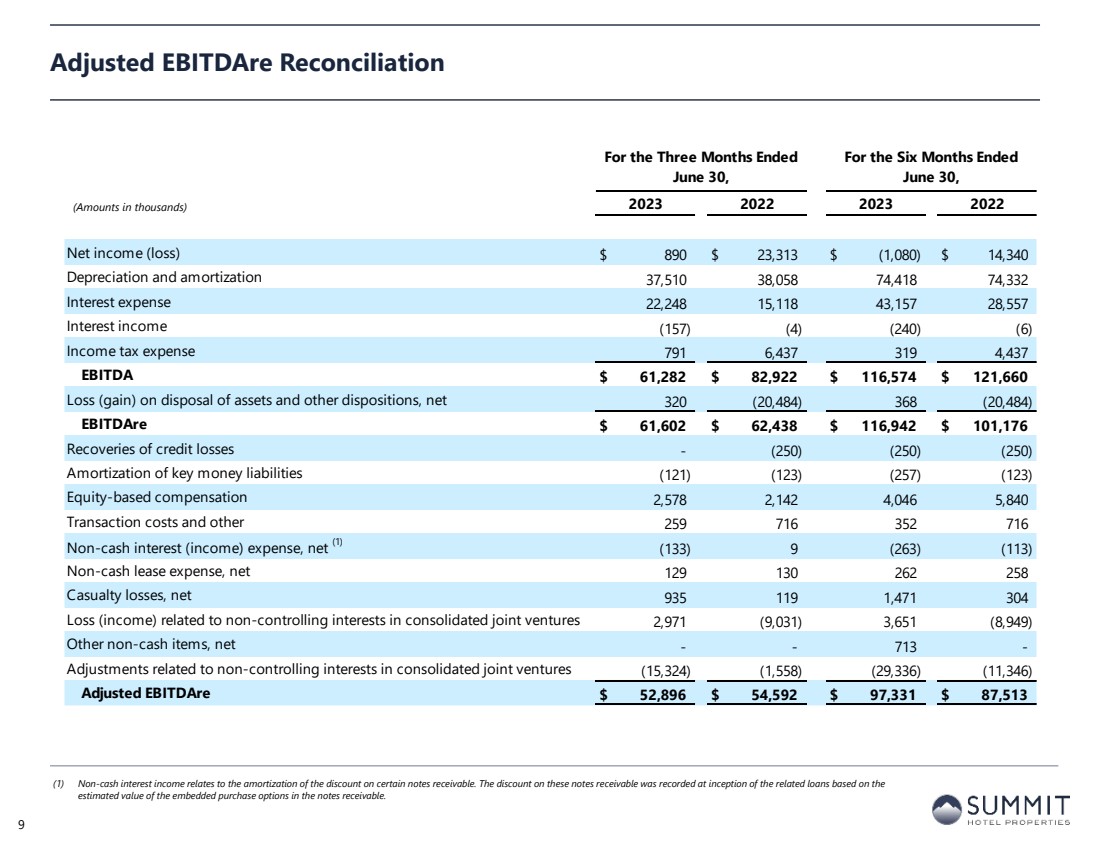
| For the Three Months Ended
June 30,
For the Six Months Ended
June 30,
2023 2022 2023 2022
Net income (loss) $ 890 $ 23,313 $ (1,080) $ 14,340
Depreciation and amortization 37,510 38,058 74,418 74,332
Interest expense 22,248 15,118 43,157 28,557
Interest income (157) (4) (240) (6)
Income tax expense 791 6,437 319 4,437
EBITDA $ 61,282 $ 82,922 $ 116,574 $ 121,660
Loss (gain) on disposal of assets and other dispositions, net 320 (20,484) 368 (20,484)
EBITDAre $ 61,602 $ 62,438 $ 116,942 $ 101,176
Recoveries of credit losses - (250) (250) (250)
Amortization of key money liabilities (121) (123) (257) (123)
Equity-based compensation 2,578 2,142 4,046 5,840
Transaction costs and other 259 716 352 716
Non-cash interest (income) expense, net (1) (133) 9 (263) (113)
Non-cash lease expense, net 129 130 262 258
Casualty losses, net 935 119 1,471 304
Loss (income) related to non-controlling interests in consolidated joint ventures 2,971 (9,031) 3,651 (8,949)
Other non-cash items, net - - 713 -
Adjustments related to non-controlling interests in consolidated joint ventures (15,324) (1,558) (29,336) (11,346)
Adjusted EBITDAre $ 52,896 $ 54,592 $ 97,331 $ 87,513
Adjusted EBITDAre Reconciliation
(1) Non-cash interest income relates to the amortization of the discount on certain notes receivable. The discount on these notes receivable was recorded at inception of the related loans based on the
estimated value of the embedded purchase options in the notes receivable.
9
(Amounts in thousands) |
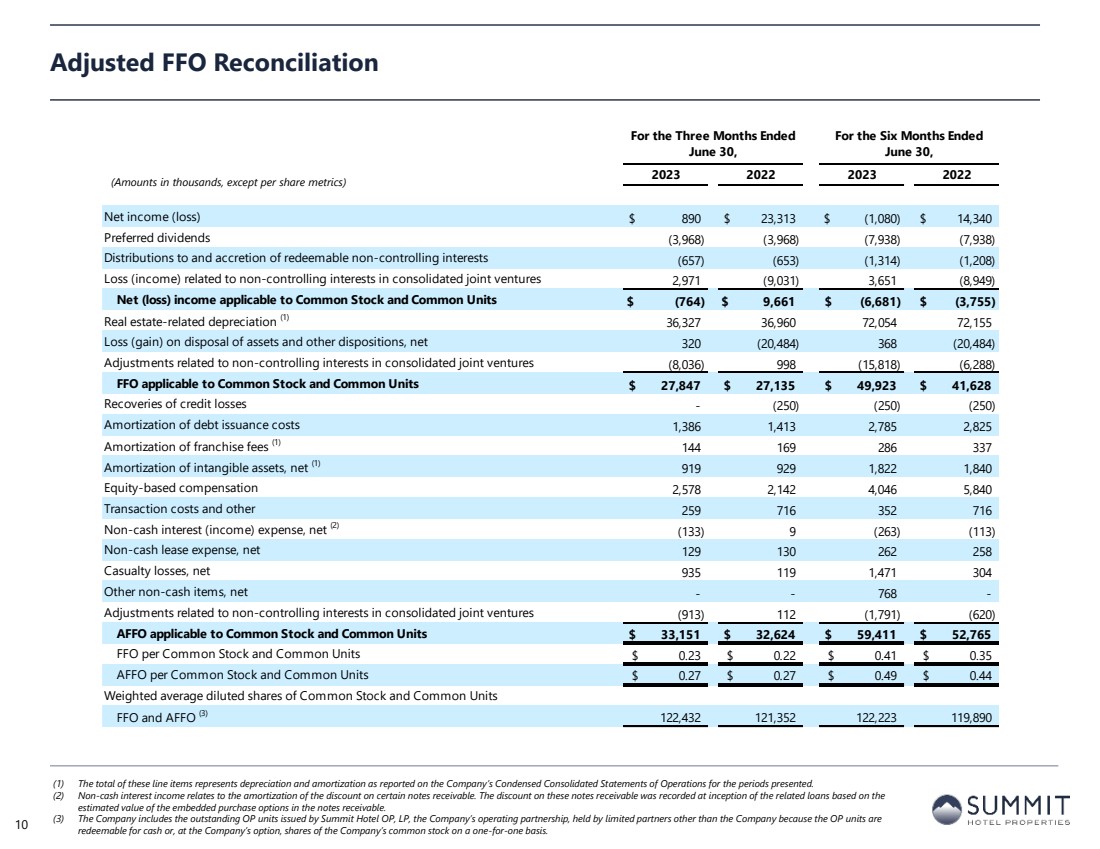
| For the Three Months Ended
June 30,
For the Six Months Ended
June 30,
2023 2022 2023 2022
Net income (loss) $ 890 $ 23,313 $ (1,080) $ 14,340
Preferred dividends (3,968) (3,968) (7,938) (7,938)
Distributions to and accretion of redeemable non-controlling interests (657) (653) (1,314) (1,208)
Loss (income) related to non-controlling interests in consolidated joint ventures 2,971 (9,031) 3,651 (8,949)
Net (loss) income applicable to Common Stock and Common Units $ (764) $ 9,661 $ (6,681) $ (3,755)
Real estate-related depreciation (1) 36,327 36,960 72,054 72,155
Loss (gain) on disposal of assets and other dispositions, net 320 (20,484) 368 (20,484)
Adjustments related to non-controlling interests in consolidated joint ventures (8,036) 998 (15,818) (6,288)
FFO applicable to Common Stock and Common Units $ 27,847 $ 27,135 $ 49,923 $ 41,628
Recoveries of credit losses - (250) (250) (250)
Amortization of debt issuance costs 1,386 1,413 2,785 2,825
Amortization of franchise fees (1) 144 169 286 337
Amortization of intangible assets, net (1) 919 929 1,822 1,840
Equity-based compensation 2,578 2,142 4,046 5,840
Transaction costs and other 259 716 352 716
Non-cash interest (income) expense, net (2) (133) 9 (263) (113)
Non-cash lease expense, net 129 130 262 258
Casualty losses, net 935 119 1,471 304
Other non-cash items, net - - 768 -
Adjustments related to non-controlling interests in consolidated joint ventures (913) 112 (1,791) (620)
AFFO applicable to Common Stock and Common Units $ 33,151 $ 32,624 $ 59,411 $ 52,765
FFO per Common Stock and Common Units $ 0.23 $ 0.22 $ 0.41 $ 0.35
AFFO per Common Stock and Common Units $ 0.27 $ 0.27 $ 0.49 $ 0.44
Weighted average diluted shares of Common Stock and Common Units
FFO and AFFO (3) 122,432 121,352 122,223 119,890
Adjusted FFO Reconciliation
(1) The total of these line items represents depreciation and amortization as reported on the Company’s Condensed Consolidated Statements of Operations for the periods presented.
(2) Non-cash interest income relates to the amortization of the discount on certain notes receivable. The discount on these notes receivable was recorded at inception of the related loans based on the
estimated value of the embedded purchase options in the notes receivable.
(3) The Company includes the outstanding OP units issued by Summit Hotel OP, LP, the Company’s operating partnership, held by limited partners other than the Company because the OP units are
redeemable for cash or, at the Company’s option, shares of the Company’s common stock on a one-for-one basis. 10
(Amounts in thousands, except per share metrics) |
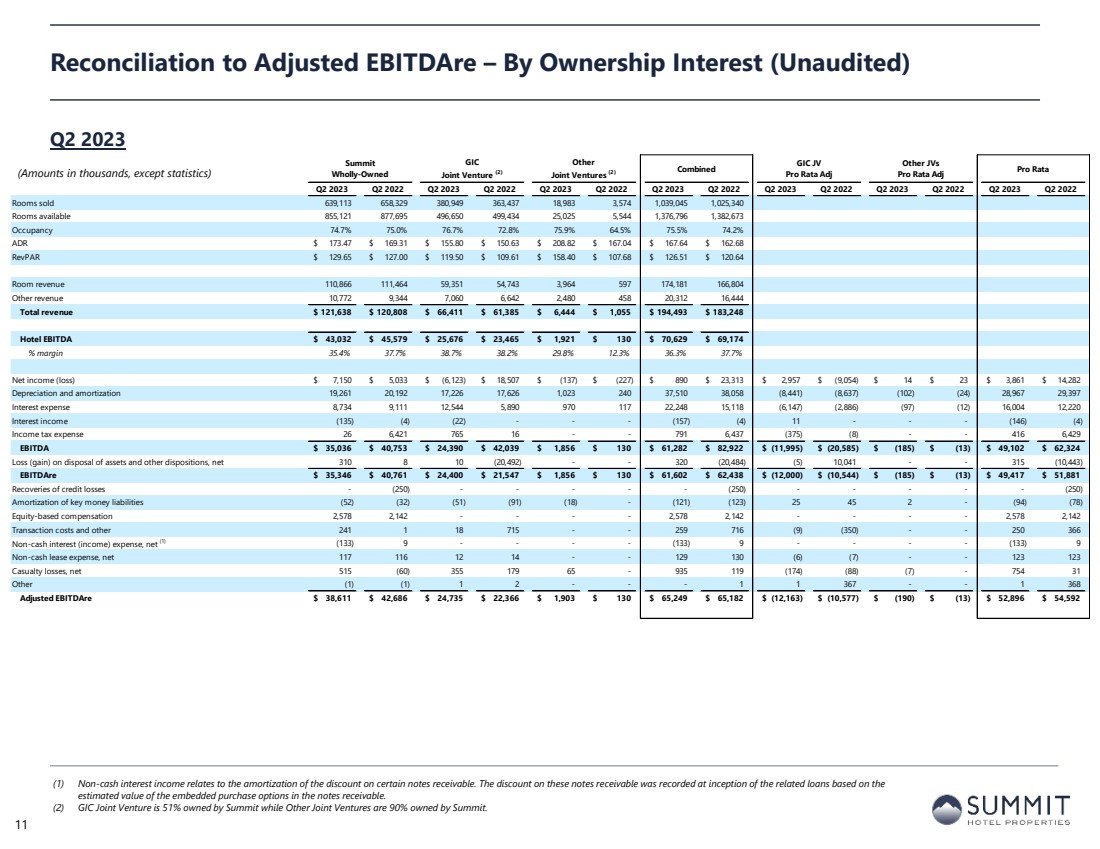
| Summit
Wholly-Owned
GIC
Joint Venture (2)
Other
Joint Ventures (2) Combined GIC JV
Pro Rata Adj
Other JVs
Pro Rata Adj Pro Rata SEC Filing - 10Q/K
Q2 2023 Q2 2022 Q2 2023 Q2 2022 Q2 2023 Q2 2022 Q2 2023 Q2 2022 Q2 2023 Q2 2022 Q2 2023 Q2 2022 Q2 2023 Q2 2022
Rooms sold 639,113 658,329 380,949 363,437 18,983 3,574 1,039,045 1,025,340
Rooms available 855,121 877,695 496,650 499,434 25,025 5,544 1,376,796 1,382,673
Occupancy 74.7% 75.0% 76.7% 72.8% 75.9% 64.5% 75.5% 74.2%
ADR $ 173.47 $ 169.31 $ 155.80 $ 150.63 $ 208.82 $ 167.04 $ 167.64 $ 162.68
RevPAR $ 129.65 $ 127.00 $ 119.50 $ 109.61 $ 158.40 $ 107.68 $ 126.51 $ 120.64
Room revenue 110,866 111,464 59,351 54,743 3,964 597 174,181 166,804
Other revenue 10,772 9,344 7,060 6,642 2,480 458 20,312 16,444
Total revenue $ 121,638 $ 120,808 $ 66,411 $ 61,385 $ 6,444 $ 1,055 $ 194,493 $ 183,248
Hotel EBITDA $ 43,032 $ 45,579 $ 25,676 $ 23,465 $ 1,921 $ 130 $ 70,629 $ 69,174
% margin 35.4% 37.7% 38.7% 38.2% 29.8% 12.3% 36.3% 37.7%
Net income (loss) $ 7,150 $ 5,033 $ (6,123) $ 18,507 $ (137) $ (227) $ 890 $ 23,313 $ 2,957 $ (9,054) $ 14 $ 23 $ 3,861 $ 14,282
Depreciation and amortization 19,261 20,192 17,226 17,626 1,023 240 37,510 38,058 (8,441) (8,637) (102) (24) 28,967 29,397
Interest expense 8,734 9,111 12,544 5,890 970 117 22,248 15,118 (6,147) (2,886) (97) (12) 16,004 12,220
Interest income (135) (4) (22) - - - (157) (4) 11 - - - (146) (4)
Income tax expense 26 6,421 765 16 - - 791 6,437 (375) (8) - - 416 6,429
EBITDA $ 35,036 $ 40,753 $ 24,390 $ 42,039 $ 1,856 $ 130 $ 61,282 $ 82,922 $ (11,995) $ (20,585) $ (185) $ (13) $ 49,102 $ 62,324
Loss (gain) on disposal of assets and other dispositions, net 310 8 10 (20,492) - - 320 (20,484) (5) 10,041 - - 315 (10,443)
EBITDAre $ 35,346 $ 40,761 $ 24,400 $ 21,547 $ 1,856 $ 130 $ 61,602 $ 62,438 $ (12,000) $ (10,544) $ (185) $ (13) $ 49,417 $ 51,881
Recoveries of credit losses - (250) - - - - - (250) - - - - - (250)
Amortization of key money liabilities (52) (32) (51) (91) (18) - (121) (123) 25 45 2 - (94) (78)
Equity-based compensation 2,578 2,142 - - - - 2,578 2,142 - - - - 2,578 2,142
Transaction costs and other 241 1 18 715 - - 259 716 (9) (350) - - 250 366
Non-cash interest (income) expense, net (1)
(133) 9 - - - - (133) 9 - - - - (133) 9
Non-cash lease expense, net 117 116 12 14 - - 129 130 (6) (7) - - 123 123
Casualty losses, net 515 (60) 355 179 65 - 935 119 (174) (88) (7) - 754 31
Other (1) (1) 1 2 - - - 1 1 367 - - 1 368
Adjusted EBITDAre $ 38,611 $ 42,686 $ 24,735 $ 22,366 $ 1,903 $ 130 $ 65,249 $ 65,182 $ (12,163) $ (10,577) $ (190) $ (13) $ 52,896 $ 54,592
Reconciliation to Adjusted EBITDAre – By Ownership Interest (Unaudited)
Q2 2023
(1) Non-cash interest income relates to the amortization of the discount on certain notes receivable. The discount on these notes receivable was recorded at inception of the related loans based on the
estimated value of the embedded purchase options in the notes receivable.
(2) GIC Joint Venture is 51% owned by Summit while Other Joint Ventures are 90% owned by Summit.
11
(Amounts in thousands, except statistics) |
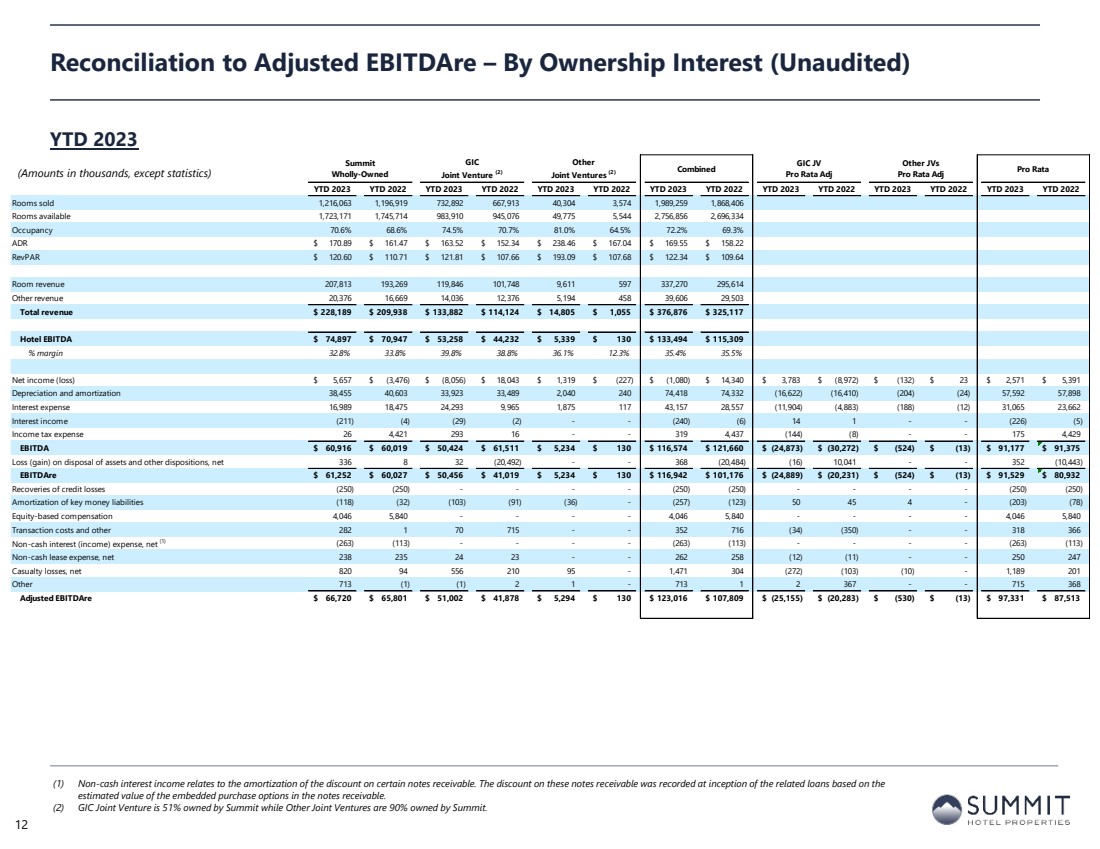
| Summit
Wholly-Owned
GIC
Joint Venture (2)
Other
Joint Ventures (2) Combined GIC JV
Pro Rata Adj
Other JVs
Pro Rata Adj Pro Rata SEC Filing - 10Q/K
YTD 2023 YTD 2022 YTD 2023 YTD 2022 YTD 2023 YTD 2022 YTD 2023 YTD 2022 YTD 2023 YTD 2022 YTD 2023 YTD 2022 YTD 2023 YTD 2022
Rooms sold 1,216,063 1,196,919 732,892 667,913 40,304 3,574 1,989,259 1,868,406
Rooms available 1,723,171 1,745,714 983,910 945,076 49,775 5,544 2,756,856 2,696,334
Occupancy 70.6% 68.6% 74.5% 70.7% 81.0% 64.5% 72.2% 69.3%
ADR $ 170.89 $ 161.47 $ 163.52 $ 152.34 $ 238.46 $ 167.04 $ 169.55 $ 158.22
RevPAR $ 120.60 $ 110.71 $ 121.81 $ 107.66 $ 193.09 $ 107.68 $ 122.34 $ 109.64
Room revenue 207,813 193,269 119,846 101,748 9,611 597 337,270 295,614
Other revenue 20,376 16,669 14,036 12,376 5,194 458 39,606 29,503
Total revenue $ 228,189 $ 209,938 $ 133,882 $ 114,124 $ 14,805 $ 1,055 $ 376,876 $ 325,117
Hotel EBITDA $ 74,897 $ 70,947 $ 53,258 $ 44,232 $ 5,339 $ 130 $ 133,494 $ 115,309
% margin 32.8% 33.8% 39.8% 38.8% 36.1% 12.3% 35.4% 35.5%
Net income (loss) $ 5,657 $ (3,476) $ (8,056) $ 18,043 $ 1,319 $ (227) $ (1,080) $ 14,340 $ 3,783 $ (8,972) $ (132) $ 23 $ 2,571 $ 5,391
Depreciation and amortization 38,455 40,603 33,923 33,489 2,040 240 74,418 74,332 (16,622) (16,410) (204) (24) 57,592 57,898
Interest expense 16,989 18,475 24,293 9,965 1,875 117 43,157 28,557 (11,904) (4,883) (188) (12) 31,065 23,662
Interest income (211) (4) (29) (2) - - (240) (6) 14 1 - - (226) (5)
Income tax expense 26 4,421 293 16 - - 319 4,437 (144) (8) - - 175 4,429
EBITDA $ 60,916 $ 60,019 $ 50,424 $ 61,511 $ 5,234 $ 130 $ 116,574 $ 121,660 $ (24,873) $ (30,272) $ (524) $ (13) $ 91,177 $ 91,375
Loss (gain) on disposal of assets and other dispositions, net 336 8 32 (20,492) - - 368 (20,484) (16) 10,041 - - 352 (10,443)
EBITDAre $ 61,252 $ 60,027 $ 50,456 $ 41,019 $ 5,234 $ 130 $ 116,942 $ 101,176 $ (24,889) $ (20,231) $ (524) $ (13) $ 91,529 $ 80,932
Recoveries of credit losses (250) (250) - - - - (250) (250) - - - - (250) (250)
Amortization of key money liabilities (118) (32) (103) (91) (36) - (257) (123) 50 45 4 - (203) (78)
Equity-based compensation 4,046 5,840 - - - - 4,046 5,840 - - - - 4,046 5,840
Transaction costs and other 282 1 70 715 - - 352 716 (34) (350) - - 318 366
Non-cash interest (income) expense, net (1)
(263) (113) - - - - (263) (113) - - - - (263) (113)
Non-cash lease expense, net 238 235 24 23 - - 262 258 (12) (11) - - 250 247
Casualty losses, net 820 94 556 210 95 - 1,471 304 (272) (103) (10) - 1,189 201
Other 713 (1) (1) 2 1 - 713 1 2 367 - - 715 368
Adjusted EBITDAre $ 66,720 $ 65,801 $ 51,002 $ 41,878 $ 5,294 $ 130 $ 123,016 $ 107,809 $ (25,155) $ (20,283) $ (530) $ (13) $ 97,331 $ 87,513
Reconciliation to Adjusted EBITDAre – By Ownership Interest (Unaudited)
YTD 2023
(1) Non-cash interest income relates to the amortization of the discount on certain notes receivable. The discount on these notes receivable was recorded at inception of the related loans based on the
estimated value of the embedded purchase options in the notes receivable.
(2) GIC Joint Venture is 51% owned by Summit while Other Joint Ventures are 90% owned by Summit.
12
(Amounts in thousands, except statistics) |
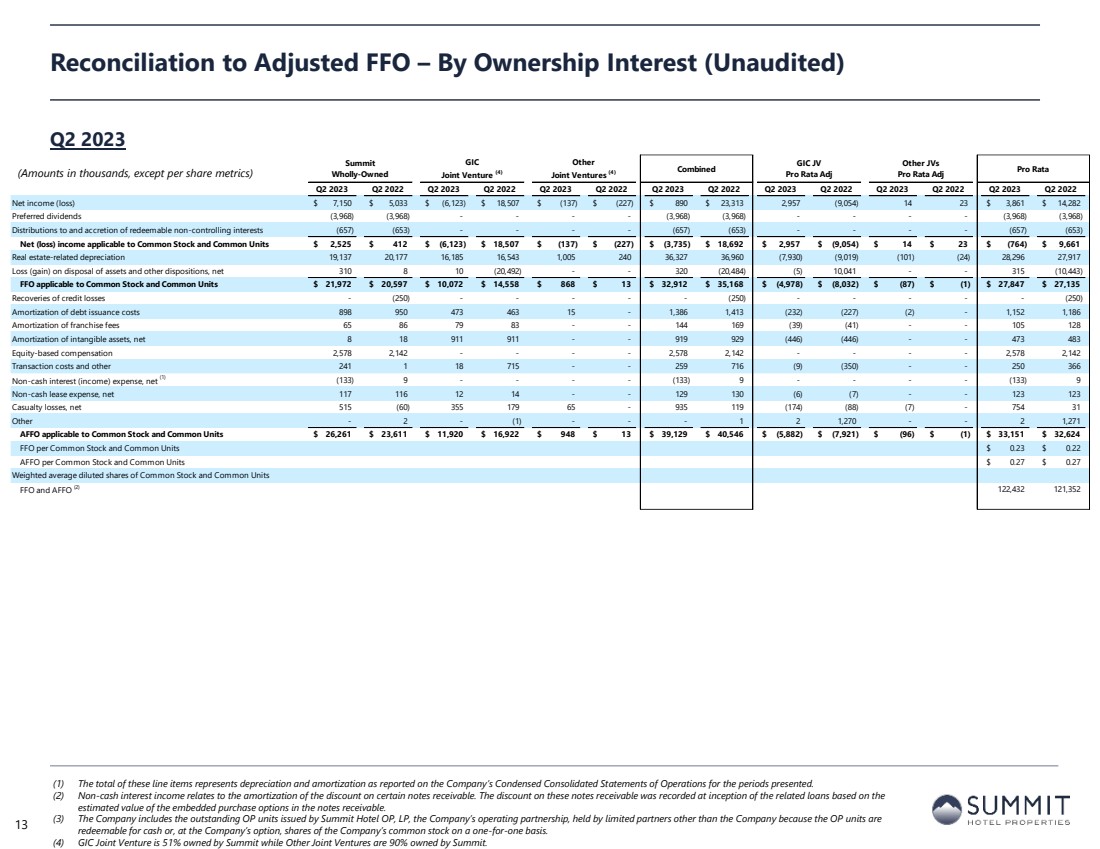
| Summit
Wholly-Owned
GIC
Joint Venture (4)
Other
Joint Ventures (4) Combined GIC JV
Pro Rata Adj
Other JVs
Pro Rata Adj Pro Rata
Q2 2023 Q2 2022 Q2 2023 Q2 2022 Q2 2023 Q2 2022 Q2 2023 Q2 2022 Q2 2023 Q2 2022 Q2 2023 Q2 2022 Q2 2023 Q2 2022
Net income (loss) $ 7,150 $ 5,033 $ (6,123) $ 18,507 $ (137) $ (227) $ 890 $ 23,313 2,957 (9,054) 14 23 $ 3,861 $ 14,282
Preferred dividends (3,968) (3,968) - - - - (3,968) (3,968) - - - - (3,968) (3,968)
Distributions to and accretion of redeemable non-controlling interests (657) (653) - - - - (657) (653) - - - - (657) (653)
Net (loss) income applicable to Common Stock and Common Units $ 2,525 $ 412 $ (6,123) $ 18,507 $ (137) $ (227) $ (3,735) $ 18,692 $ 2,957 $ (9,054) $ 14 $ 23 $ (764) $ 9,661
Real estate-related depreciation 19,137 20,177 16,185 16,543 1,005 240 36,327 36,960 (7,930) (9,019) (101) (24) 28,296 27,917
Loss (gain) on disposal of assets and other dispositions, net 310 8 10 (20,492) - - 320 (20,484) (5) 10,041 - - 315 (10,443)
FFO applicable to Common Stock and Common Units $ 21,972 $ 20,597 $ 10,072 $ 14,558 $ 868 $ 13 $ 32,912 $ 35,168 $ (4,978) $ (8,032) $ (87) $ (1) $ 27,847 $ 27,135
Recoveries of credit losses - (250) - - - - - (250) - - - - - (250)
Amortization of debt issuance costs 898 950 473 463 15 - 1,386 1,413 (232) (227) (2) - 1,152 1,186
Amortization of franchise fees 65 86 79 83 - - 144 169 (39) (41) - - 105 128
Amortization of intangible assets, net 8 18 911 911 - - 919 929 (446) (446) - - 473 483
Equity-based compensation 2,578 2,142 - - - - 2,578 2,142 - - - - 2,578 2,142
Transaction costs and other 241 1 18 715 - - 259 716 (9) (350) - - 250 366
Non-cash interest (income) expense, net (1)
(133) 9 - - - - (133) 9 - - - - (133) 9
Non-cash lease expense, net 117 116 12 14 - - 129 130 (6) (7) - - 123 123
Casualty losses, net 515 (60) 355 179 65 - 935 119 (174) (88) (7) - 754 31
Other - 2 - (1) - - - 1 2 1,270 - - 2 1,271
AFFO applicable to Common Stock and Common Units $ 26,261 $ 23,611 $ 11,920 $ 16,922 $ 948 $ 13 $ 39,129 $ 40,546 $ (5,882) $ (7,921) $ (96) $ (1) $ 33,151 $ 32,624
FFO per Common Stock and Common Units $ 0.23 $ 0.22
AFFO per Common Stock and Common Units $ 0.27 $ 0.27
Weighted average diluted shares of Common Stock and Common Units
FFO and AFFO (2)
122,432 121,352
Reconciliation to Adjusted FFO – By Ownership Interest (Unaudited)
Q2 2023
(1) The total of these line items represents depreciation and amortization as reported on the Company’s Condensed Consolidated Statements of Operations for the periods presented.
(2) Non-cash interest income relates to the amortization of the discount on certain notes receivable. The discount on these notes receivable was recorded at inception of the related loans based on the
estimated value of the embedded purchase options in the notes receivable.
(3) The Company includes the outstanding OP units issued by Summit Hotel OP, LP, the Company’s operating partnership, held by limited partners other than the Company because the OP units are
redeemable for cash or, at the Company’s option, shares of the Company’s common stock on a one-for-one basis.
(4) GIC Joint Venture is 51% owned by Summit while Other Joint Ventures are 90% owned by Summit.
13
(Amounts in thousands, except per share metrics) |
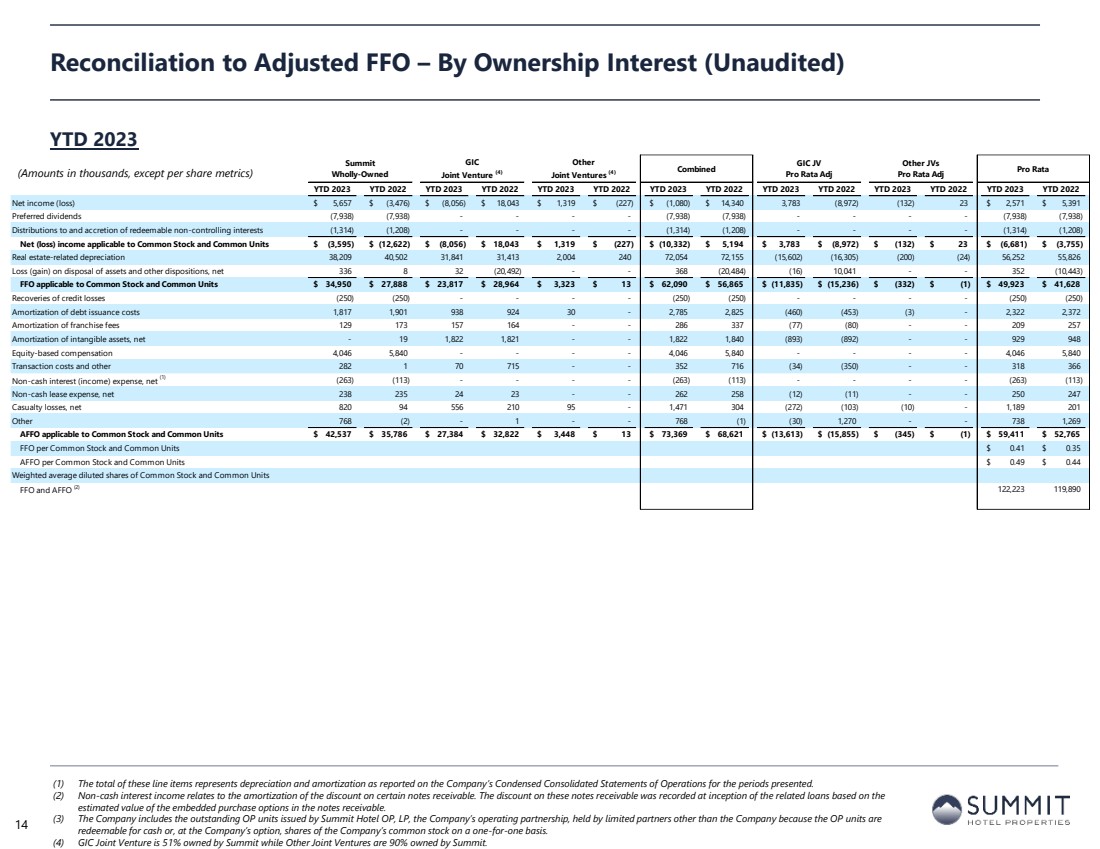
| Summit
Wholly-Owned
GIC
Joint Venture (4)
Other
Joint Ventures (4) Combined GIC JV
Pro Rata Adj
Other JVs
Pro Rata Adj Pro Rata
YTD 2023 YTD 2022 YTD 2023 YTD 2022 YTD 2023 YTD 2022 YTD 2023 YTD 2022 YTD 2023 YTD 2022 YTD 2023 YTD 2022 YTD 2023 YTD 2022
Net income (loss) $ 5,657 $ (3,476) $ (8,056) $ 18,043 $ 1,319 $ (227) $ (1,080) $ 14,340 3,783 (8,972) (132) 23 $ 2,571 $ 5,391
Preferred dividends (7,938) (7,938) - - - - (7,938) (7,938) - - - - (7,938) (7,938)
Distributions to and accretion of redeemable non-controlling interests (1,314) (1,208) - - - - (1,314) (1,208) - - - - (1,314) (1,208)
Net (loss) income applicable to Common Stock and Common Units $ (3,595) $ (12,622) $ (8,056) $ 18,043 $ 1,319 $ (227) $ (10,332) $ 5,194 $ 3,783 $ (8,972) $ (132) $ 23 $ (6,681) $ (3,755)
Real estate-related depreciation 38,209 40,502 31,841 31,413 2,004 240 72,054 72,155 (15,602) (16,305) (200) (24) 56,252 55,826
Loss (gain) on disposal of assets and other dispositions, net 336 8 32 (20,492) - - 368 (20,484) (16) 10,041 - - 352 (10,443)
FFO applicable to Common Stock and Common Units $ 34,950 $ 27,888 $ 23,817 $ 28,964 $ 3,323 $ 13 $ 62,090 $ 56,865 $ (11,835) $ (15,236) $ (332) $ (1) $ 49,923 $ 41,628
Recoveries of credit losses (250) (250) - - - - (250) (250) - - - - (250) (250)
Amortization of debt issuance costs 1,817 1,901 938 924 30 - 2,785 2,825 (460) (453) (3) - 2,322 2,372
Amortization of franchise fees 129 173 157 164 - - 286 337 (77) (80) - - 209 257
Amortization of intangible assets, net - 19 1,822 1,821 - - 1,822 1,840 (893) (892) - - 929 948
Equity-based compensation 4,046 5,840 - - - - 4,046 5,840 - - - - 4,046 5,840
Transaction costs and other 282 1 70 715 - - 352 716 (34) (350) - - 318 366
Non-cash interest (income) expense, net (1)
(263) (113) - - - - (263) (113) - - - - (263) (113)
Non-cash lease expense, net 238 235 24 23 - - 262 258 (12) (11) - - 250 247
Casualty losses, net 820 94 556 210 95 - 1,471 304 (272) (103) (10) - 1,189 201
Other 768 (2) - 1 - - 768 (1) (30) 1,270 - - 738 1,269
AFFO applicable to Common Stock and Common Units $ 42,537 $ 35,786 $ 27,384 $ 32,822 $ 3,448 $ 13 $ 73,369 $ 68,621 $ (13,613) $ (15,855) $ (345) $ (1) $ 59,411 $ 52,765
FFO per Common Stock and Common Units $ 0.41 $ 0.35
AFFO per Common Stock and Common Units $ 0.49 $ 0.44
Weighted average diluted shares of Common Stock and Common Units
FFO and AFFO (2)
122,223 119,890
Reconciliation to Adjusted FFO – By Ownership Interest (Unaudited)
YTD 2023
(1) The total of these line items represents depreciation and amortization as reported on the Company’s Condensed Consolidated Statements of Operations for the periods presented.
(2) Non-cash interest income relates to the amortization of the discount on certain notes receivable. The discount on these notes receivable was recorded at inception of the related loans based on the
estimated value of the embedded purchase options in the notes receivable.
(3) The Company includes the outstanding OP units issued by Summit Hotel OP, LP, the Company’s operating partnership, held by limited partners other than the Company because the OP units are
redeemable for cash or, at the Company’s option, shares of the Company’s common stock on a one-for-one basis.
(4) GIC Joint Venture is 51% owned by Summit while Other Joint Ventures are 90% owned by Summit.
14
(Amounts in thousands, except per share metrics) |
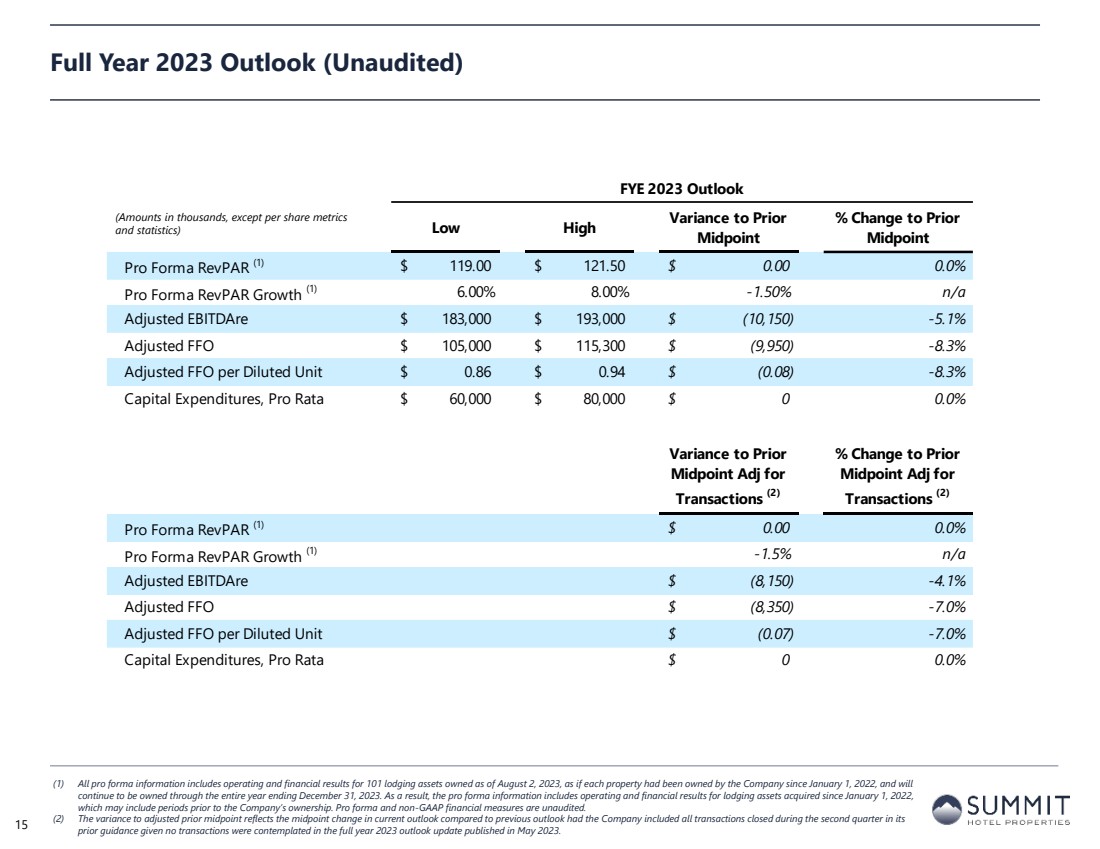
| FYE 2023 Outlook
Low High Variance to Prior
Midpoint
% Change to Prior
Midpoint
Pro Forma RevPAR (1) $ 119.00 $ 121.50 $ 0.00 0.0%
Pro Forma RevPAR Growth (1) 6.00% 8.00% -1.50% n/a
Adjusted EBITDAre $ 183,000 $ 193,000 $ (10,150) -5.1%
Adjusted FFO $ 105,000 $ 115,300 $ (9,950) -8.3%
Adjusted FFO per Diluted Unit $ 0.86 $ 0.94 $ (0.08) -8.3%
Capital Expenditures, Pro Rata $ 60,000 $ 80,000 $ 0 0.0%
Variance to Prior
Midpoint Adj for
Transactions (2)
% Change to Prior
Midpoint Adj for
Transactions (2)
Pro Forma RevPAR (1) $ 0.00 0.0%
Pro Forma RevPAR Growth (1) -1.5% n/a
Adjusted EBITDAre $ (8,150) -4.1%
Adjusted FFO $ (8,350) -7.0%
Adjusted FFO per Diluted Unit $ (0.07) -7.0%
Capital Expenditures, Pro Rata $ 0 0.0%
Full Year 2023 Outlook (Unaudited)
(1) All pro forma information includes operating and financial results for 101 lodging assets owned as of August 2, 2023, as if each property had been owned by the Company since January 1, 2022, and will
continue to be owned through the entire year ending December 31, 2023. As a result, the pro forma information includes operating and financial results for lodging assets acquired since January 1, 2022,
which may include periods prior to the Company’s ownership. Pro forma and non-GAAP financial measures are unaudited.
(2) The variance to adjusted prior midpoint reflects the midpoint change in current outlook compared to previous outlook had the Company included all transactions closed during the second quarter in its
prior guidance given no transactions were contemplated in the full year 2023 outlook update published in May 2023. 15
(Amounts in thousands, except per share metrics
and statistics) |
| Table of Contents
Section I Forward-Looking Statements and Non-GAAP Financial Measure Disclosures
Section II Corporate Financial Schedules
Section III Operating & Property-Level Schedules
Section IV Capitalization and Debt Schedules
Section V Asset Listing
16 |
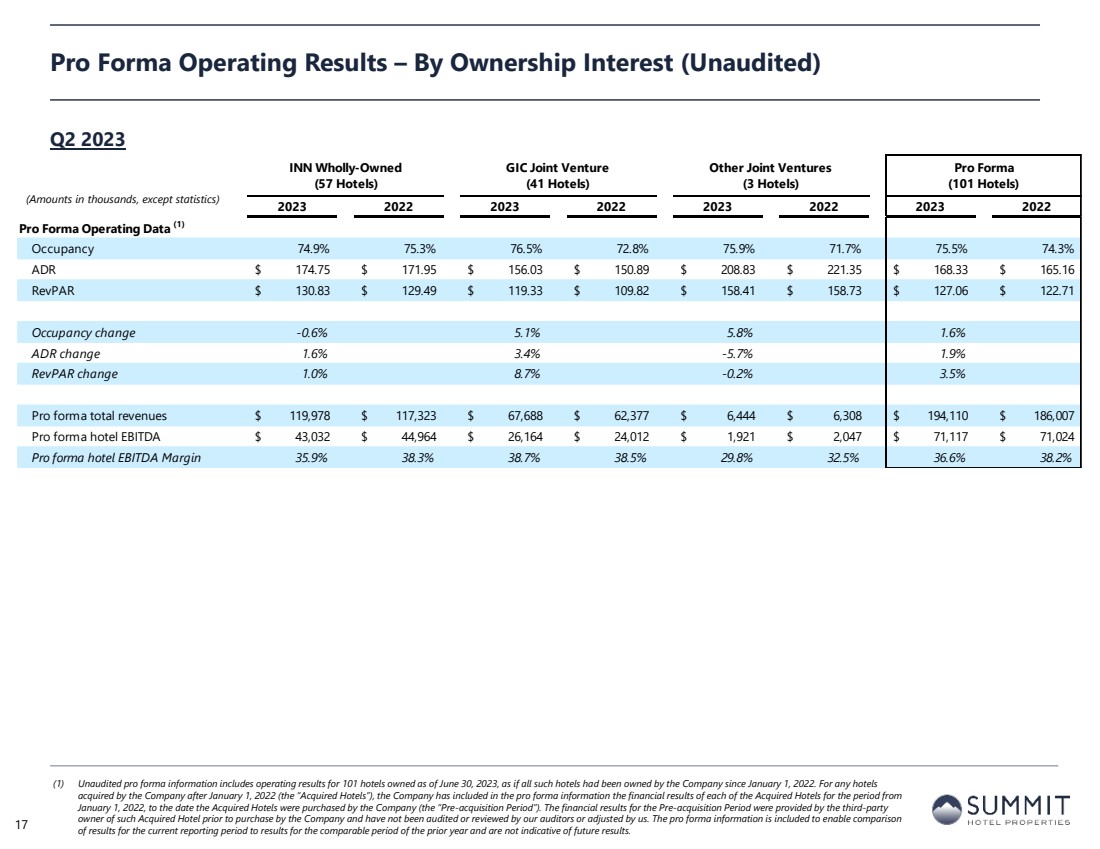
| INN Wholly-Owned
(57 Hotels)
GIC Joint Venture
(41 Hotels)
Other Joint Ventures
(3 Hotels)
Pro Forma
(101 Hotels)
2023 2022 2023 2022 2023 2022 2023 2022
Pro Forma Operating Data (1)
Occupancy 74.9% 75.3% 76.5% 72.8% 75.9% 71.7% 75.5% 74.3%
ADR $ 174.75 $ 171.95 $ 156.03 $ 150.89 $ 208.83 $ 221.35 $ 168.33 $ 165.16
RevPAR $ 130.83 $ 129.49 $ 119.33 $ 109.82 $ 158.41 $ 158.73 $ 127.06 $ 122.71
Occupancy change -0.6% 5.1% 5.8% 1.6%
ADR change 1.6% 3.4% -5.7% 1.9%
RevPAR change 1.0% 8.7% -0.2% 3.5%
Pro forma total revenues $ 119,978 $ 117,323 $ 67,688 $ 62,377 $ 6,444 $ 6,308 $ 194,110 $ 186,007
Pro forma hotel EBITDA $ 43,032 $ 44,964 $ 26,164 $ 24,012 $ 1,921 $ 2,047 $ 71,117 $ 71,024
Pro forma hotel EBITDA Margin 35.9% 38.3% 38.7% 38.5% 29.8% 32.5% 36.6% 38.2%
Pro Forma Operating Results – By Ownership Interest (Unaudited)
(1) Unaudited pro forma information includes operating results for 101 hotels owned as of June 30, 2023, as if all such hotels had been owned by the Company since January 1, 2022. For any hotels
acquired by the Company after January 1, 2022 (the “Acquired Hotels”), the Company has included in the pro forma information the financial results of each of the Acquired Hotels for the period from
January 1, 2022, to the date the Acquired Hotels were purchased by the Company (the “Pre-acquisition Period”). The financial results for the Pre-acquisition Period were provided by the third-party
owner of such Acquired Hotel prior to purchase by the Company and have not been audited or reviewed by our auditors or adjusted by us. The pro forma information is included to enable comparison
of results for the current reporting period to results for the comparable period of the prior year and are not indicative of future results.
Q2 2023
17
(Amounts in thousands, except statistics) |
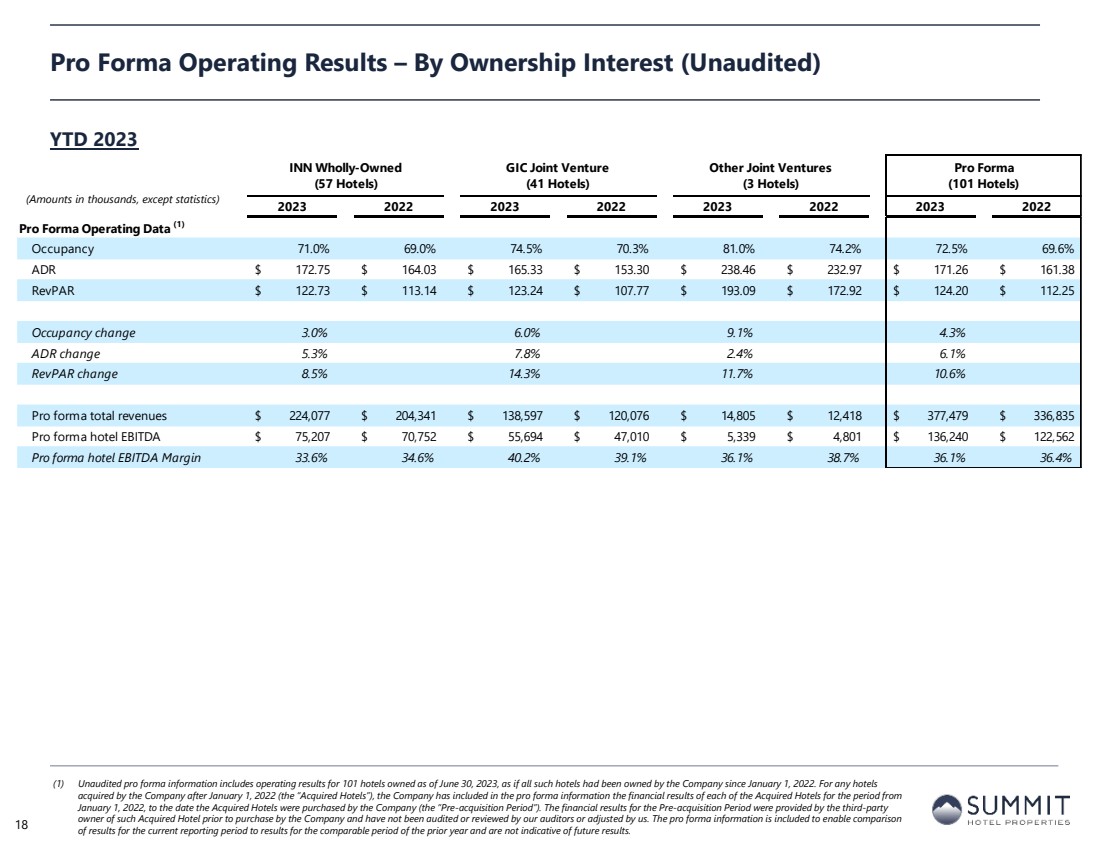
| INN Wholly-Owned
(57 Hotels)
GIC Joint Venture
(41 Hotels)
Other Joint Ventures
(3 Hotels)
Pro Forma
(101 Hotels)
2023 2022 2023 2022 2023 2022 2023 2022
Pro Forma Operating Data (1)
Occupancy 71.0% 69.0% 74.5% 70.3% 81.0% 74.2% 72.5% 69.6%
ADR $ 172.75 $ 164.03 $ 165.33 $ 153.30 $ 238.46 $ 232.97 $ 171.26 $ 161.38
RevPAR $ 122.73 $ 113.14 $ 123.24 $ 107.77 $ 193.09 $ 172.92 $ 124.20 $ 112.25
Occupancy change 3.0% 6.0% 9.1% 4.3%
ADR change 5.3% 7.8% 2.4% 6.1%
RevPAR change 8.5% 14.3% 11.7% 10.6%
Pro forma total revenues $ 224,077 $ 204,341 $ 138,597 $ 120,076 $ 14,805 $ 12,418 $ 377,479 $ 336,835
Pro forma hotel EBITDA $ 75,207 $ 70,752 $ 55,694 $ 47,010 $ 5,339 $ 4,801 $ 136,240 $ 122,562
Pro forma hotel EBITDA Margin 33.6% 34.6% 40.2% 39.1% 36.1% 38.7% 36.1% 36.4%
Pro Forma Operating Results – By Ownership Interest (Unaudited)
(1) Unaudited pro forma information includes operating results for 101 hotels owned as of June 30, 2023, as if all such hotels had been owned by the Company since January 1, 2022. For any hotels
acquired by the Company after January 1, 2022 (the “Acquired Hotels”), the Company has included in the pro forma information the financial results of each of the Acquired Hotels for the period from
January 1, 2022, to the date the Acquired Hotels were purchased by the Company (the “Pre-acquisition Period”). The financial results for the Pre-acquisition Period were provided by the third-party
owner of such Acquired Hotel prior to purchase by the Company and have not been audited or reviewed by our auditors or adjusted by us. The pro forma information is included to enable comparison
of results for the current reporting period to results for the comparable period of the prior year and are not indicative of future results.
YTD 2023
18
(Amounts in thousands, except statistics) |
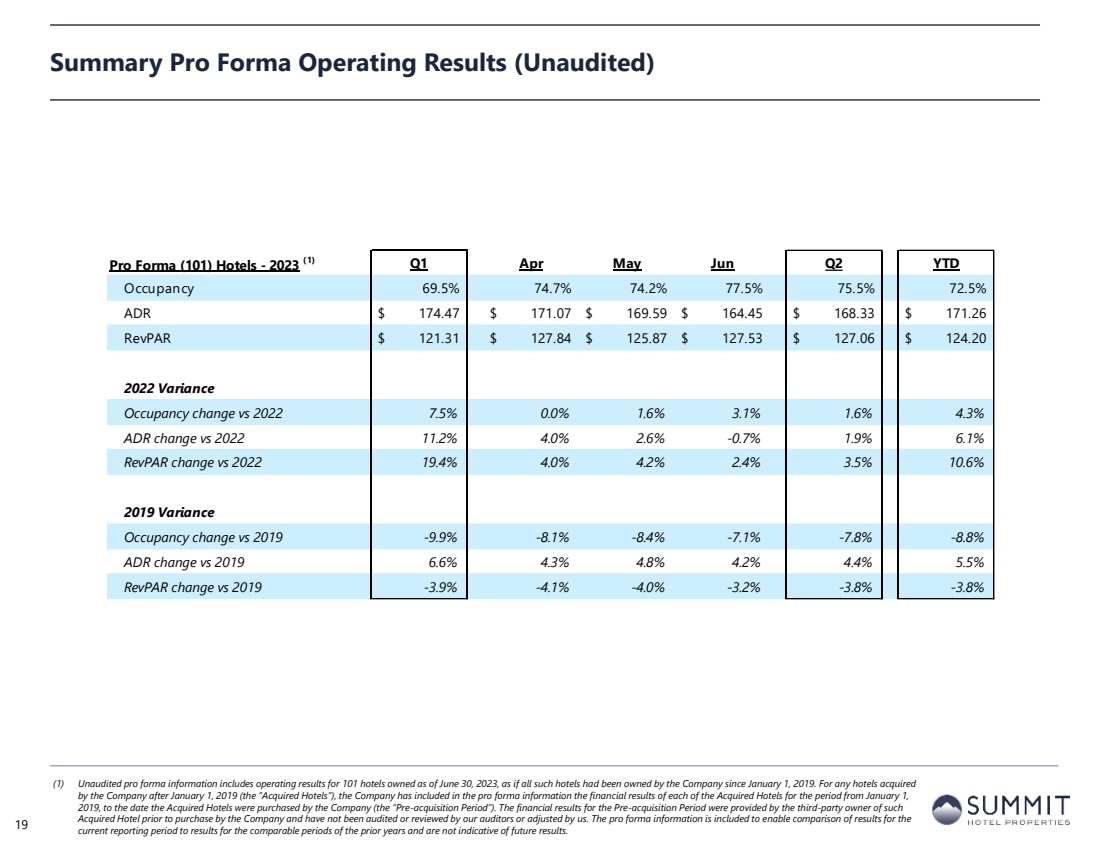
| Summary Pro Forma Operating Results (Unaudited)
(1) Unaudited pro forma information includes operating results for 101 hotels owned as of June 30, 2023, as if all such hotels had been owned by the Company since January 1, 2019. For any hotels acquired
by the Company after January 1, 2019 (the “Acquired Hotels”), the Company has included in the pro forma information the financial results of each of the Acquired Hotels for the period from January 1,
2019, to the date the Acquired Hotels were purchased by the Company (the “Pre-acquisition Period”). The financial results for the Pre-acquisition Period were provided by the third-party owner of such
Acquired Hotel prior to purchase by the Company and have not been audited or reviewed by our auditors or adjusted by us. The pro forma information is included to enable comparison of results for the
current reporting period to results for the comparable periods of the prior years and are not indicative of future results. 19
Pro Forma (101) Hotels - 2023 (1) Q1 Apr May Jun Q2 YTD
Occupancy 69.5% 74.7% 74.2% 77.5% 75.5% 72.5%
ADR $ 174.47 $ 171.07 $ 169.59 $ 164.45 $ 168.33 $ 171.26
RevPAR $ 121.31 $ 127.84 $ 125.87 $ 127.53 $ 127.06 $ 124.20
2022 Variance
Occupancy change vs 2022 7.5% 0.0% 1.6% 3.1% 1.6% 4.3%
ADR change vs 2022 11.2% 4.0% 2.6% -0.7% 1.9% 6.1%
RevPAR change vs 2022 19.4% 4.0% 4.2% 2.4% 3.5% 10.6%
2019 Variance
Occupancy change vs 2019 -9.9% -8.1% -8.4% -7.1% -7.8% -8.8%
ADR change vs 2019 6.6% 4.3% 4.8% 4.2% 4.4% 5.5%
RevPAR change vs 2019 -3.9% -4.1% -4.0% -3.2% -3.8% -3.8% |
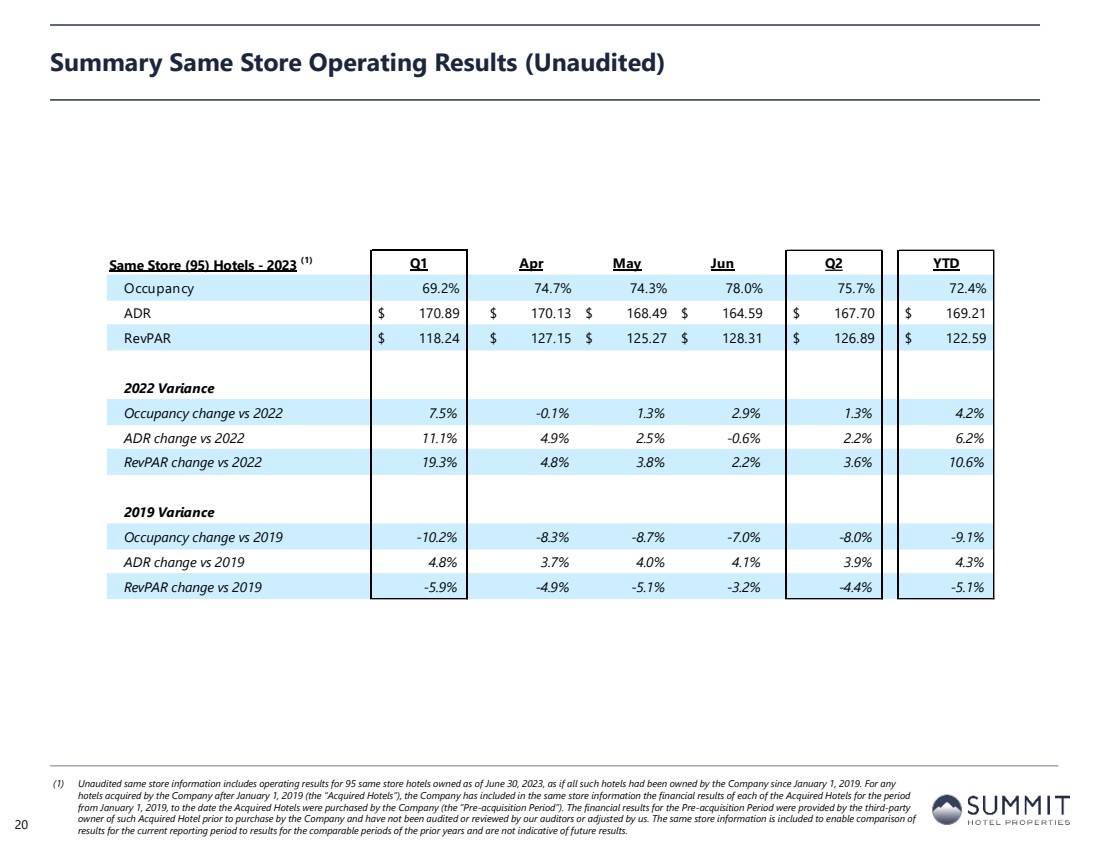
| Same Store (95) Hotels - 2023 (1) Q1 Apr May Jun Q2 YTD
Occupancy 69.2% 74.7% 74.3% 78.0% 75.7% 72.4%
ADR $ 170.89 $ 170.13 $ 168.49 $ 164.59 $ 167.70 $ 169.21
RevPAR $ 118.24 $ 127.15 $ 125.27 $ 128.31 $ 126.89 $ 122.59
2022 Variance
Occupancy change vs 2022 7.5% -0.1% 1.3% 2.9% 1.3% 4.2%
ADR change vs 2022 11.1% 4.9% 2.5% -0.6% 2.2% 6.2%
RevPAR change vs 2022 19.3% 4.8% 3.8% 2.2% 3.6% 10.6%
2019 Variance
Occupancy change vs 2019 -10.2% -8.3% -8.7% -7.0% -8.0% -9.1%
ADR change vs 2019 4.8% 3.7% 4.0% 4.1% 3.9% 4.3%
RevPAR change vs 2019 -5.9% -4.9% -5.1% -3.2% -4.4% -5.1%
Summary Same Store Operating Results (Unaudited)
(1) Unaudited same store information includes operating results for 95 same store hotels owned as of June 30, 2023, as if all such hotels had been owned by the Company since January 1, 2019. For any
hotels acquired by the Company after January 1, 2019 (the “Acquired Hotels”), the Company has included in the same store information the financial results of each of the Acquired Hotels for the period
from January 1, 2019, to the date the Acquired Hotels were purchased by the Company (the “Pre-acquisition Period”). The financial results for the Pre-acquisition Period were provided by the third-party
owner of such Acquired Hotel prior to purchase by the Company and have not been audited or reviewed by our auditors or adjusted by us. The same store information is included to enable comparison of
results for the current reporting period to results for the comparable periods of the prior years and are not indicative of future results. 20 |
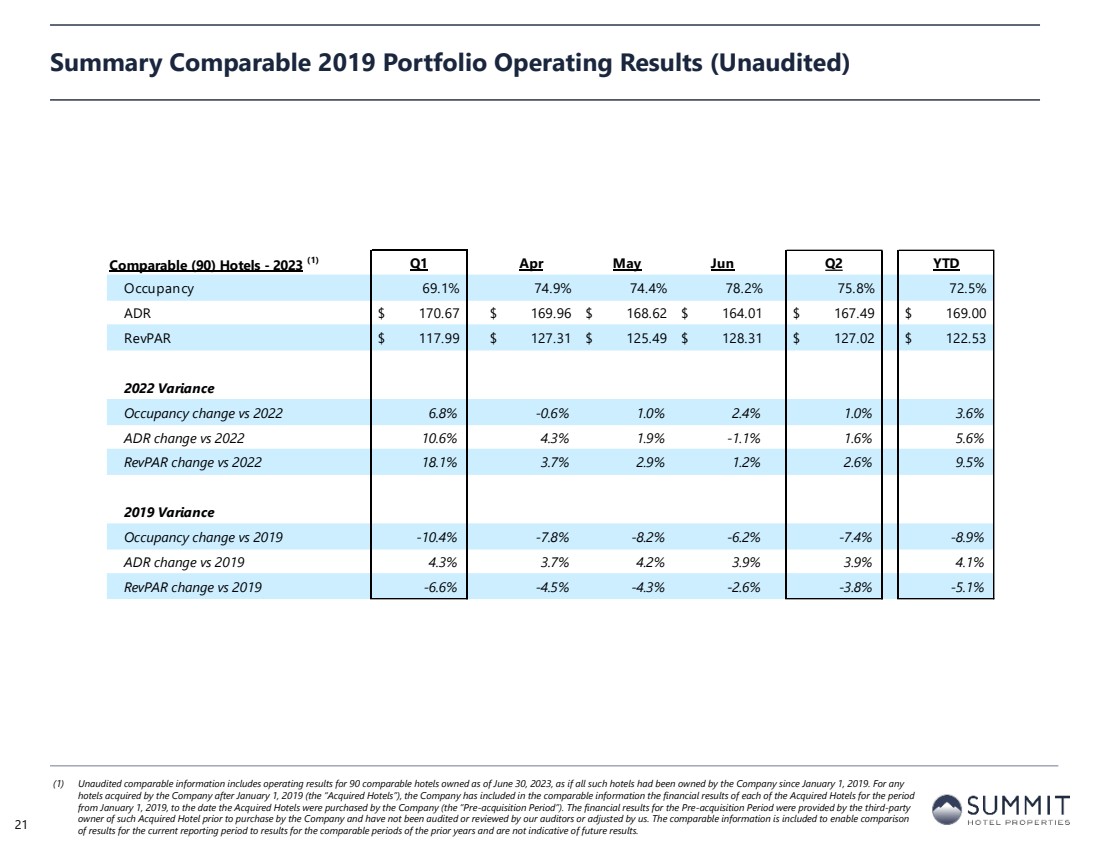
| Comparable (90) Hotels - 2023 (1) Q1 Apr May Jun Q2 YTD
Occupancy 69.1% 74.9% 74.4% 78.2% 75.8% 72.5%
ADR $ 170.67 $ 169.96 $ 168.62 $ 164.01 $ 167.49 $ 169.00
RevPAR $ 117.99 $ 127.31 $ 125.49 $ 128.31 $ 127.02 $ 122.53
2022 Variance
Occupancy change vs 2022 6.8% -0.6% 1.0% 2.4% 1.0% 3.6%
ADR change vs 2022 10.6% 4.3% 1.9% -1.1% 1.6% 5.6%
RevPAR change vs 2022 18.1% 3.7% 2.9% 1.2% 2.6% 9.5%
2019 Variance
Occupancy change vs 2019 -10.4% -7.8% -8.2% -6.2% -7.4% -8.9%
ADR change vs 2019 4.3% 3.7% 4.2% 3.9% 3.9% 4.1%
RevPAR change vs 2019 -6.6% -4.5% -4.3% -2.6% -3.8% -5.1%
Summary Comparable 2019 Portfolio Operating Results (Unaudited)
(1) Unaudited comparable information includes operating results for 90 comparable hotels owned as of June 30, 2023, as if all such hotels had been owned by the Company since January 1, 2019. For any
hotels acquired by the Company after January 1, 2019 (the “Acquired Hotels”), the Company has included in the comparable information the financial results of each of the Acquired Hotels for the period
from January 1, 2019, to the date the Acquired Hotels were purchased by the Company (the “Pre-acquisition Period”). The financial results for the Pre-acquisition Period were provided by the third-party
owner of such Acquired Hotel prior to purchase by the Company and have not been audited or reviewed by our auditors or adjusted by us. The comparable information is included to enable comparison
of results for the current reporting period to results for the comparable periods of the prior years and are not indicative of future results. 21 |
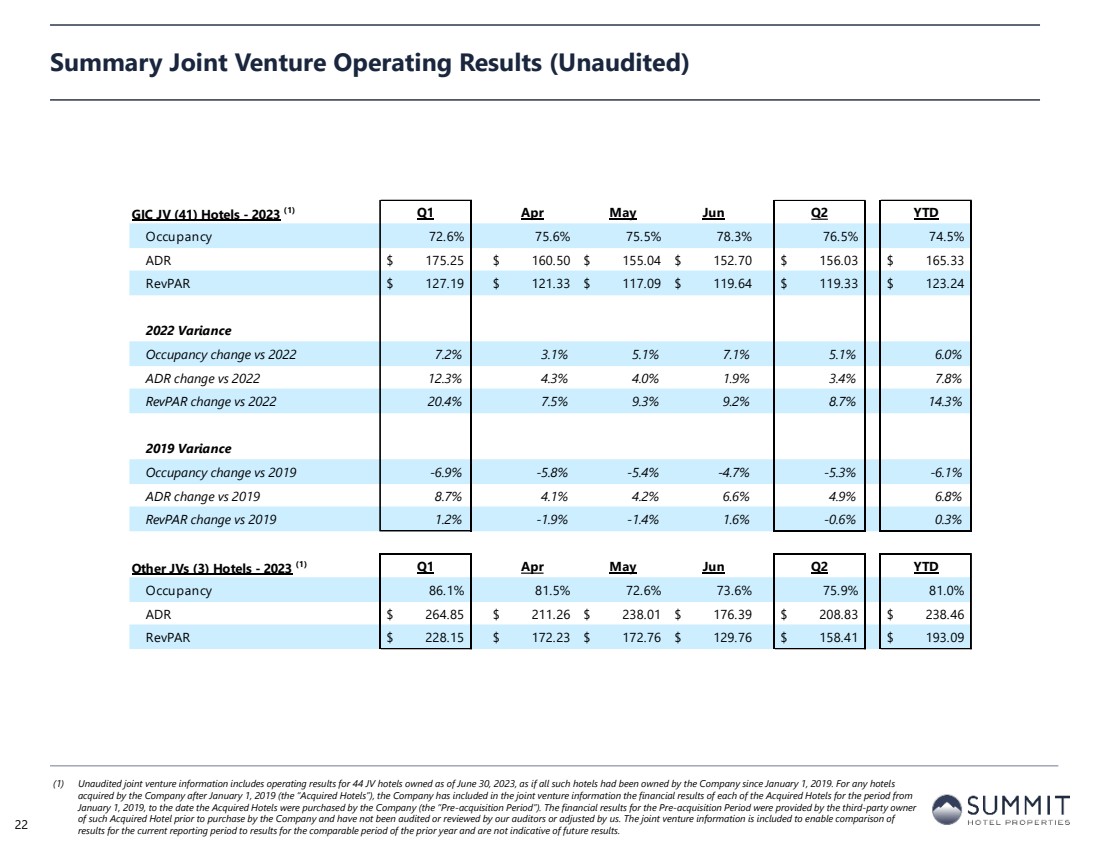
| Summary Joint Venture Operating Results (Unaudited)
(1) Unaudited joint venture information includes operating results for 44 JV hotels owned as of June 30, 2023, as if all such hotels had been owned by the Company since January 1, 2019. For any hotels
acquired by the Company after January 1, 2019 (the “Acquired Hotels”), the Company has included in the joint venture information the financial results of each of the Acquired Hotels for the period from
January 1, 2019, to the date the Acquired Hotels were purchased by the Company (the “Pre-acquisition Period”). The financial results for the Pre-acquisition Period were provided by the third-party owner
of such Acquired Hotel prior to purchase by the Company and have not been audited or reviewed by our auditors or adjusted by us. The joint venture information is included to enable comparison of
results for the current reporting period to results for the comparable period of the prior year and are not indicative of future results. 22
GIC JV (41) Hotels - 2023 (1) Q1 Apr May Jun Q2 YTD
Occupancy 72.6% 75.6% 75.5% 78.3% 76.5% 74.5%
ADR $ 175.25 $ 160.50 $ 155.04 $ 152.70 $ 156.03 $ 165.33
RevPAR $ 127.19 $ 121.33 $ 117.09 $ 119.64 $ 119.33 $ 123.24
2022 Variance
Occupancy change vs 2022 7.2% 3.1% 5.1% 7.1% 5.1% 6.0%
ADR change vs 2022 12.3% 4.3% 4.0% 1.9% 3.4% 7.8%
RevPAR change vs 2022 20.4% 7.5% 9.3% 9.2% 8.7% 14.3%
2019 Variance
Occupancy change vs 2019 -6.9% -5.8% -5.4% -4.7% -5.3% -6.1%
ADR change vs 2019 8.7% 4.1% 4.2% 6.6% 4.9% 6.8%
RevPAR change vs 2019 1.2% -1.9% -1.4% 1.6% -0.6% 0.3%
Other JVs (3) Hotels - 2023 (1) Q1 Apr May Jun Q2 YTD
Occupancy 86.1% 81.5% 72.6% 73.6% 75.9% 81.0%
ADR $ 264.85 $ 211.26 $ 238.01 $ 176.39 $ 208.83 $ 238.46
RevPAR $ 228.15 $ 172.23 $ 172.76 $ 129.76 $ 158.41 $ 193.09 |

| Table of Contents
Section I Forward-Looking Statements and Non-GAAP Financial Measure Disclosures
Section II Corporate Financial Schedules
Section III Operating & Property-Level Schedules
Section IV Capitalization and Debt Schedules
Section V Asset Listing
23 |
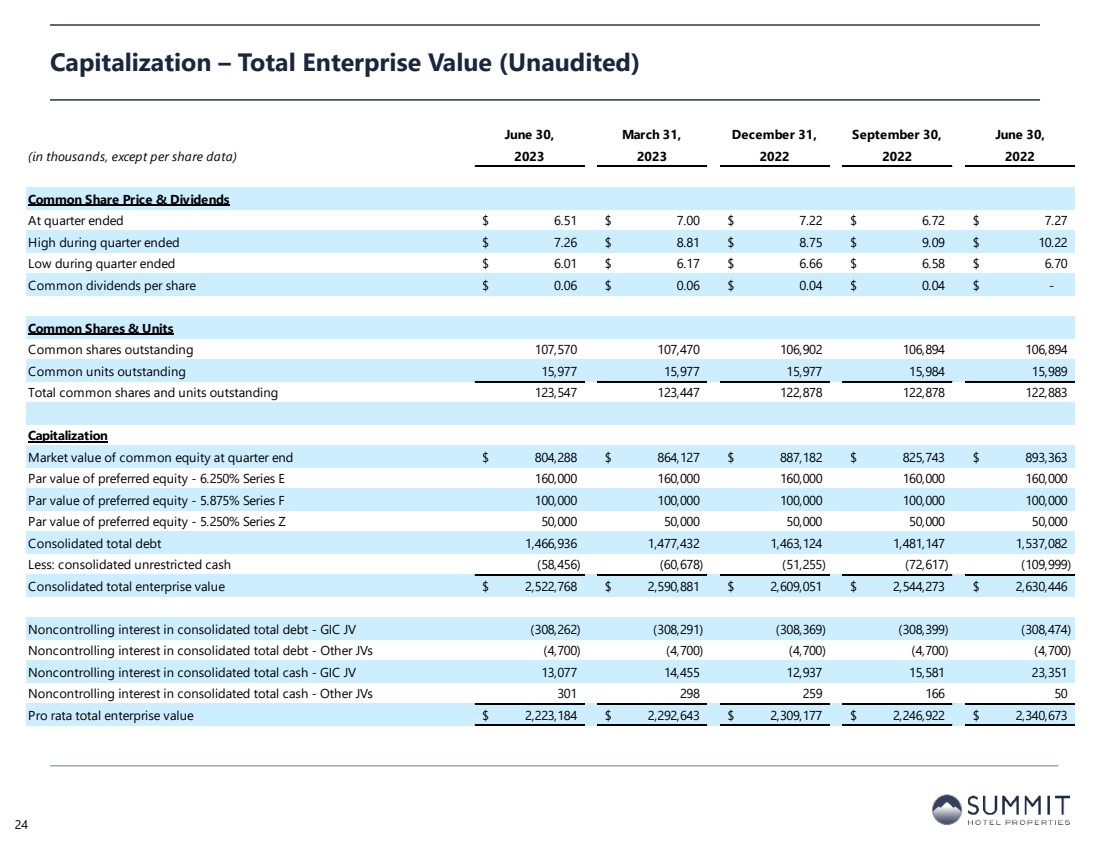
| June 30, March 31, December 31, September 30, June 30,
(in thousands, except per share data) 2023 2023 2022 2022 2022
Common Share Price & Dividends
At quarter ended $ 6.51 $ 7.00 $ 7.22 $ 6.72 $ 7.27
High during quarter ended $ 7.26 $ 8.81 $ 8.75 $ 9.09 $ 10.22
Low during quarter ended $ 6.01 $ 6.17 $ 6.66 $ 6.58 $ 6.70
Common dividends per share $ 0.06 $ 0.06 $ 0.04 $ 0.04 $ -
Common Shares & Units
Common shares outstanding 107,570 107,470 106,902 106,894 106,894
Common units outstanding 15,977 15,977 15,977 15,984 15,989
Total common shares and units outstanding 123,547 123,447 122,878 122,878 122,883
Capitalization
Market value of common equity at quarter end $ 804,288 $ 864,127 $ 887,182 $ 825,743 $ 893,363
Par value of preferred equity - 6.250% Series E 160,000 160,000 160,000 160,000 160,000
Par value of preferred equity - 5.875% Series F 100,000 100,000 100,000 100,000 100,000
Par value of preferred equity - 5.250% Series Z 50,000 50,000 50,000 50,000 50,000
Consolidated total debt 1,466,936 1,477,432 1,463,124 1,481,147 1,537,082
Less: consolidated unrestricted cash (58,456) (60,678) (51,255) (72,617) (109,999)
Consolidated total enterprise value $ 2,522,768 $ 2,590,881 $ 2,609,051 $ 2,544,273 $ 2,630,446
Noncontrolling interest in consolidated total debt - GIC JV (308,262) (308,291) (308,369) (308,399) (308,474)
Noncontrolling interest in consolidated total debt - Other JVs (4,700) (4,700) (4,700) (4,700) (4,700)
Noncontrolling interest in consolidated total cash - GIC JV 13,077 14,455 12,937 15,581 23,351
Noncontrolling interest in consolidated total cash - Other JVs 301 298 259 166 50
Pro rata total enterprise value $ 2,223,184 $ 2,292,643 $ 2,309,177 $ 2,246,922 $ 2,340,673
Capitalization – Total Enterprise Value (Unaudited)
24 |
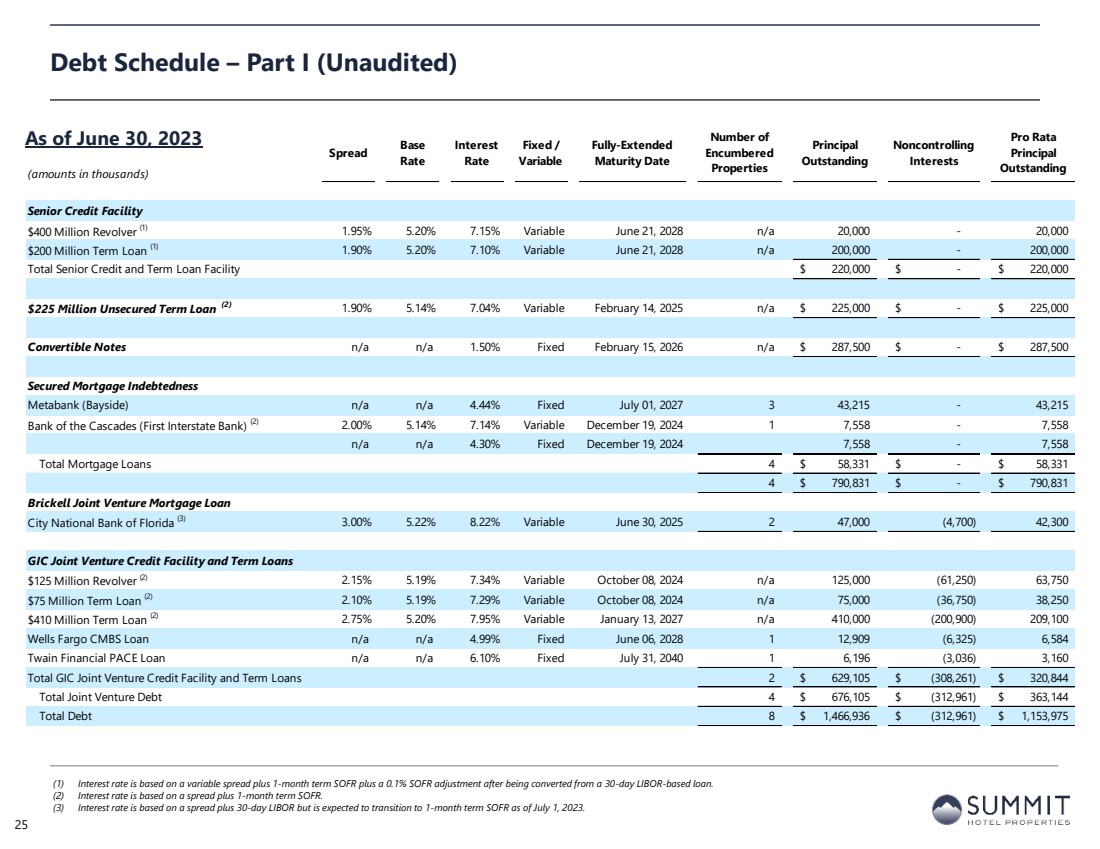
| (amounts in thousands)
Spread Base
Rate
Interest
Rate
Fixed /
Variable
Fully-Extended
Maturity Date
Number of
Encumbered
Properties
Principal
Outstanding
Noncontrolling
Interests
Pro Rata
Principal
Outstanding
Senior Credit Facility
$400 Million Revolver (1) 1.95% 5.20% 7.15% Variable June 21, 2028 n/a 20,000 - 20,000
$200 Million Term Loan (1) 1.90% 5.20% 7.10% Variable June 21, 2028 n/a 200,000 - 200,000
Total Senior Credit and Term Loan Facility $ 220,000 $ - $ 220,000
$225 Million Unsecured Term Loan (2) 1.90% 5.14% 7.04% Variable February 14, 2025 n/a $ 225,000 $ - $ 225,000
Convertible Notes n/a n/a 1.50% Fixed February 15, 2026 n/a $ 287,500 $ - $ 287,500
Secured Mortgage Indebtedness
Metabank (Bayside) n/a n/a 4.44% Fixed July 01, 2027 3 43,215 - 43,215
Bank of the Cascades (First Interstate Bank) (2) 2.00% 5.14% 7.14% Variable December 19, 2024 1 7,558 - 7,558
n/a n/a 4.30% Fixed December 19, 2024 7,558 - 7,558
Total Mortgage Loans 4 $ 58,331 $ - $ 58,331
4 $ 790,831 $ - $ 790,831
Brickell Joint Venture Mortgage Loan
City National Bank of Florida (3) 3.00% 5.22% 8.22% Variable June 30, 2025 2 47,000 (4,700) 42,300
GIC Joint Venture Credit Facility and Term Loans
$125 Million Revolver (2) 2.15% 5.19% 7.34% Variable October 08, 2024 n/a 125,000 (61,250) 63,750
$75 Million Term Loan (2) 2.10% 5.19% 7.29% Variable October 08, 2024 n/a 75,000 (36,750) 38,250
$410 Million Term Loan (2) 2.75% 5.20% 7.95% Variable January 13, 2027 n/a 410,000 (200,900) 209,100
Wells Fargo CMBS Loan n/a n/a 4.99% Fixed June 06, 2028 1 12,909 (6,325) 6,584
Twain Financial PACE Loan n/a n/a 6.10% Fixed July 31, 2040 1 6,196 (3,036) 3,160
Total GIC Joint Venture Credit Facility and Term Loans 2 $ 629,105 $ (308,261) $ 320,844
Total Joint Venture Debt 4 $ 676,105 $ (312,961) $ 363,144
Total Debt 8 $ 1,466,936 $ (312,961) $ 1,153,975
Debt Schedule – Part I (Unaudited)
(1) Interest rate is based on a variable spread plus 1-month term SOFR plus a 0.1% SOFR adjustment after being converted from a 30-day LIBOR-based loan.
(2) Interest rate is based on a spread plus 1-month term SOFR.
(3) Interest rate is based on a spread plus 30-day LIBOR but is expected to transition to 1-month term SOFR as of July 1, 2023.
As of June 30, 2023
25 |
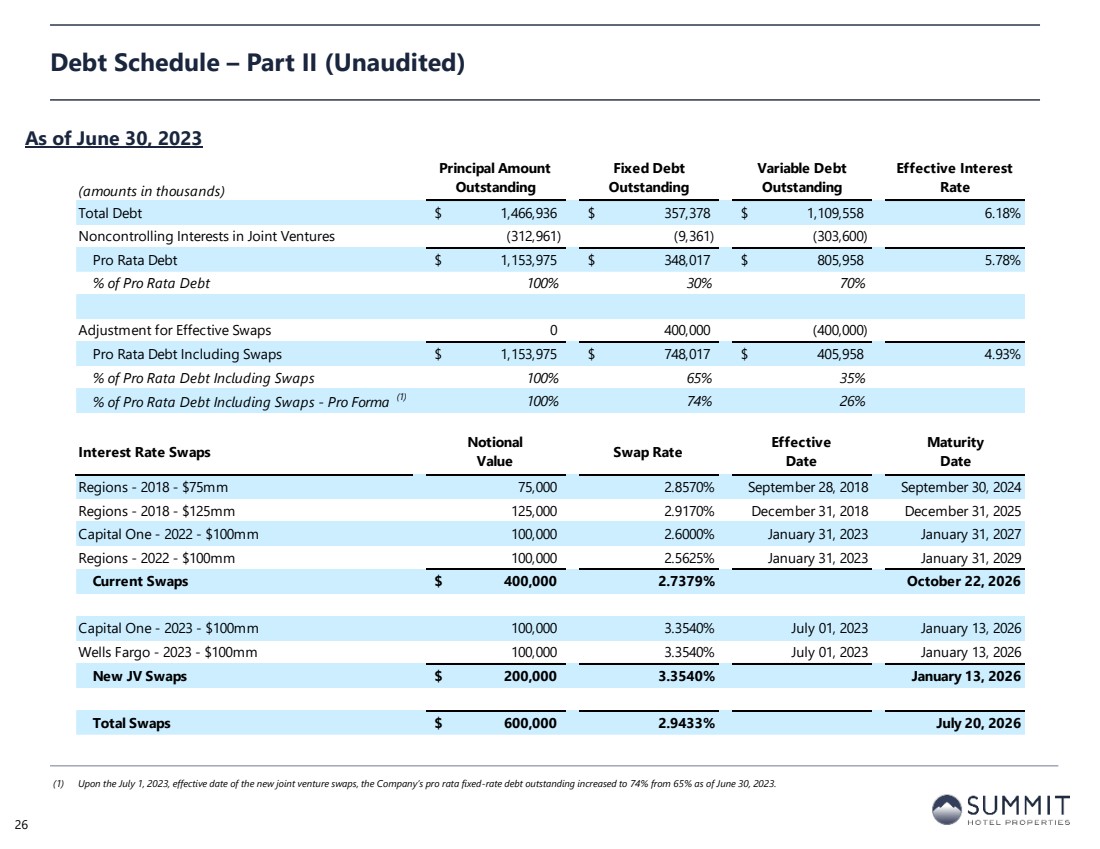
| Debt Schedule – Part II (Unaudited)
As of June 30, 2023
26
(1) Upon the July 1, 2023, effective date of the new joint venture swaps, the Company’s pro rata fixed-rate debt outstanding increased to 74% from 65% as of June 30, 2023.
(amounts in thousands)
Principal Amount
Outstanding
Fixed Debt
Outstanding
Variable Debt
Outstanding
Effective Interest
Rate
Total Debt $ 1,466,936 $ 357,378 $ 1,109,558 6.18%
Noncontrolling Interests in Joint Ventures (312,961) (9,361) (303,600)
Pro Rata Debt $ 1,153,975 $ 348,017 $ 805,958 5.78%
% of Pro Rata Debt 100% 30% 70%
Adjustment for Effective Swaps 0 400,000 (400,000)
Pro Rata Debt Including Swaps $ 1,153,975 $ 748,017 $ 405,958 4.93%
% of Pro Rata Debt Including Swaps 100% 65% 35%
% of Pro Rata Debt Including Swaps - Pro Forma (1) 100% 74% 26%
Interest Rate Swaps Notional
Value Swap Rate Effective
Date
Maturity
Date
Regions - 2018 - $75mm 75,000 2.8570% September 28, 2018 September 30, 2024
Regions - 2018 - $125mm 125,000 2.9170% December 31, 2018 December 31, 2025
Capital One - 2022 - $100mm 100,000 2.6000% January 31, 2023 January 31, 2027
Regions - 2022 - $100mm 100,000 2.5625% January 31, 2023 January 31, 2029
Current Swaps $ 400,000 2.7379% October 22, 2026
Capital One - 2023 - $100mm 100,000 3.3540% July 01, 2023 January 13, 2026
Wells Fargo - 2023 - $100mm 100,000 3.3540% July 01, 2023 January 13, 2026
New JV Swaps $ 200,000 3.3540% January 13, 2026
Total Swaps $ 600,000 2.9433% July 20, 2026 |
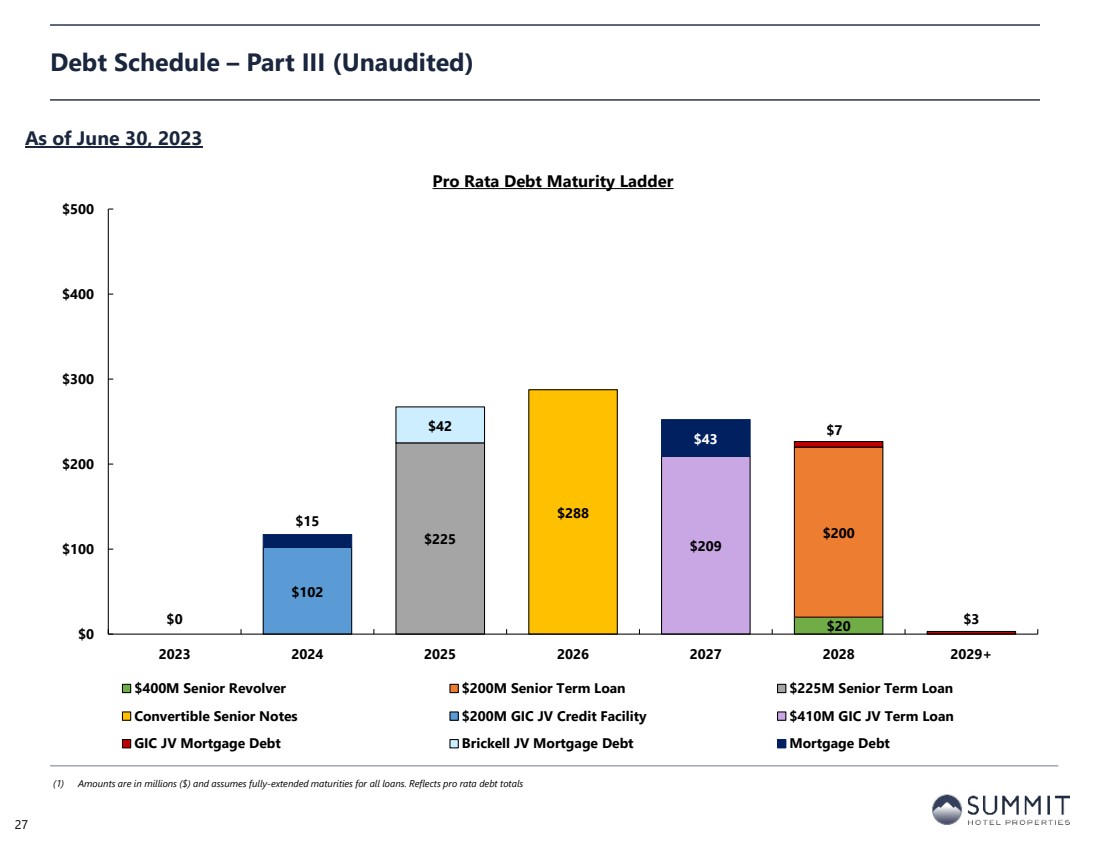
| $20
$200 $225
$288
$0
$102
$209
$7
$3
$42
$15
$43
$0
$100
$200
$300
$400
$500
2023 2024 2025 2026 2027 2028 2029+
Pro Rata Debt Maturity Ladder
$400M Senior Revolver $200M Senior Term Loan $225M Senior Term Loan
Convertible Senior Notes $200M GIC JV Credit Facility $410M GIC JV Term Loan
GIC JV Mortgage Debt Brickell JV Mortgage Debt Mortgage Debt
Debt Schedule – Part III (Unaudited)
(1) Amounts are in millions ($) and assumes fully-extended maturities for all loans. Reflects pro rata debt totals
27
As of June 30, 2023 |
| Table of Contents
Section I Forward-Looking Statements and Non-GAAP Financial Measure Disclosures
Section II Corporate Financial Schedules
Section III Operating & Property-Level Schedules
Section IV Capitalization and Debt Schedules
Section V Asset Listing
28 |
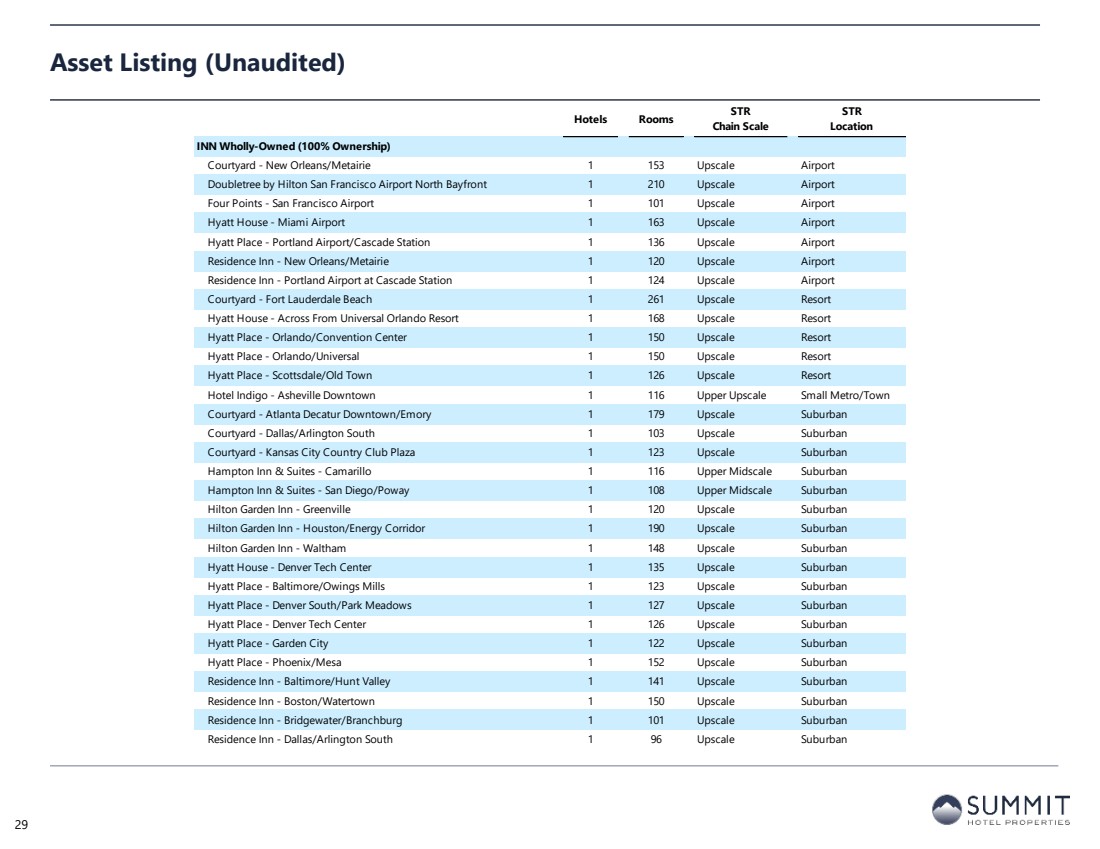
| Hotels Rooms STR
Chain Scale
STR
Location
INN Wholly-Owned (100% Ownership)
Courtyard - New Orleans/Metairie 1 153 Upscale Airport
Doubletree by Hilton San Francisco Airport North Bayfront 1 210 Upscale Airport
Four Points - San Francisco Airport 1 101 Upscale Airport
Hyatt House - Miami Airport 1 163 Upscale Airport
Hyatt Place - Portland Airport/Cascade Station 1 136 Upscale Airport
Residence Inn - New Orleans/Metairie 1 120 Upscale Airport
Residence Inn - Portland Airport at Cascade Station 1 124 Upscale Airport
Courtyard - Fort Lauderdale Beach 1 261 Upscale Resort
Hyatt House - Across From Universal Orlando Resort 1 168 Upscale Resort
Hyatt Place - Orlando/Convention Center 1 150 Upscale Resort
Hyatt Place - Orlando/Universal 1 150 Upscale Resort
Hyatt Place - Scottsdale/Old Town 1 126 Upscale Resort
Hotel Indigo - Asheville Downtown 1 116 Upper Upscale Small Metro/Town
Courtyard - Atlanta Decatur Downtown/Emory 1 179 Upscale Suburban
Courtyard - Dallas/Arlington South 1 103 Upscale Suburban
Courtyard - Kansas City Country Club Plaza 1 123 Upscale Suburban
Hampton Inn & Suites - Camarillo 1 116 Upper Midscale Suburban
Hampton Inn & Suites - San Diego/Poway 1 108 Upper Midscale Suburban
Hilton Garden Inn - Greenville 1 120 Upscale Suburban
Hilton Garden Inn - Houston/Energy Corridor 1 190 Upscale Suburban
Hilton Garden Inn - Waltham 1 148 Upscale Suburban
Hyatt House - Denver Tech Center 1 135 Upscale Suburban
Hyatt Place - Baltimore/Owings Mills 1 123 Upscale Suburban
Hyatt Place - Denver South/Park Meadows 1 127 Upscale Suburban
Hyatt Place - Denver Tech Center 1 126 Upscale Suburban
Hyatt Place - Garden City 1 122 Upscale Suburban
Hyatt Place - Phoenix/Mesa 1 152 Upscale Suburban
Residence Inn - Baltimore/Hunt Valley 1 141 Upscale Suburban
Residence Inn - Boston/Watertown 1 150 Upscale Suburban
Residence Inn - Bridgewater/Branchburg 1 101 Upscale Suburban
Residence Inn - Dallas/Arlington South 1 96 Upscale Suburban
Asset Listing (Unaudited)
29 |
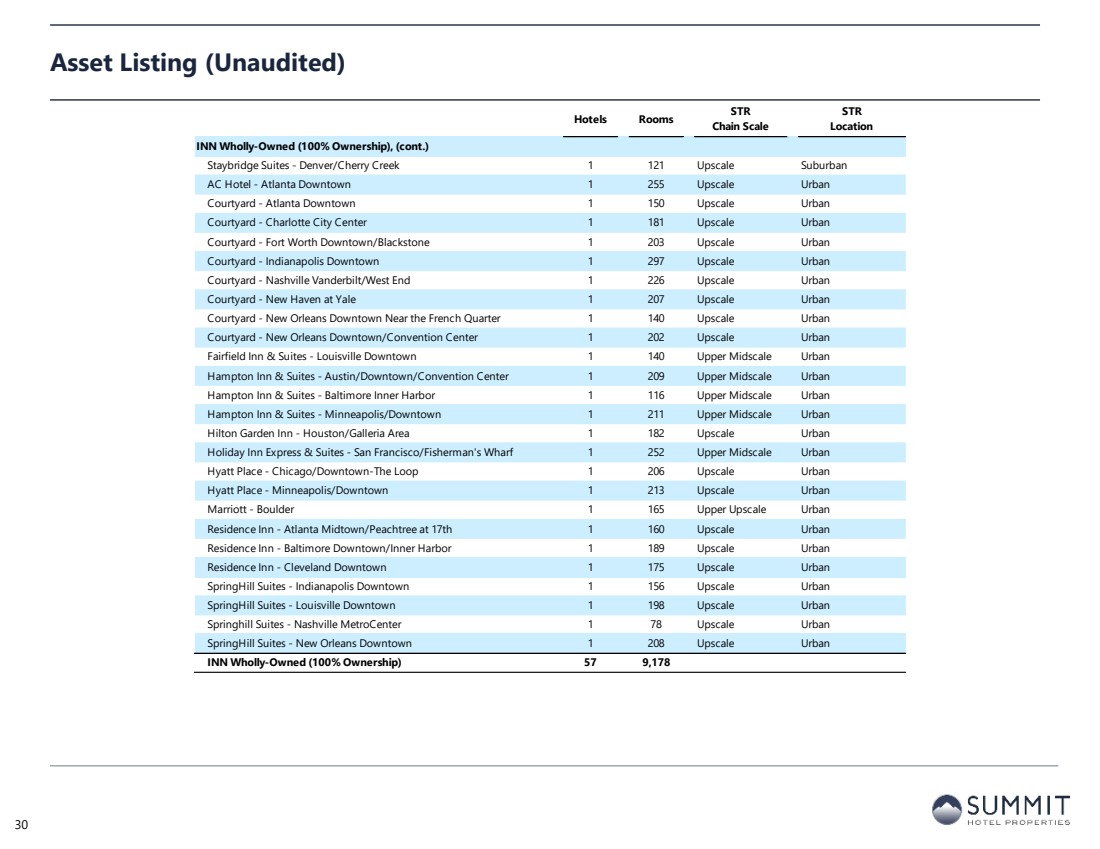
| Hotels Rooms STR
Chain Scale
STR
Location
INN Wholly-Owned (100% Ownership), (cont.)
Staybridge Suites - Denver/Cherry Creek 1 121 Upscale Suburban
AC Hotel - Atlanta Downtown 1 255 Upscale Urban
Courtyard - Atlanta Downtown 1 150 Upscale Urban
Courtyard - Charlotte City Center 1 181 Upscale Urban
Courtyard - Fort Worth Downtown/Blackstone 1 203 Upscale Urban
Courtyard - Indianapolis Downtown 1 297 Upscale Urban
Courtyard - Nashville Vanderbilt/West End 1 226 Upscale Urban
Courtyard - New Haven at Yale 1 207 Upscale Urban
Courtyard - New Orleans Downtown Near the French Quarter 1 140 Upscale Urban
Courtyard - New Orleans Downtown/Convention Center 1 202 Upscale Urban
Fairfield Inn & Suites - Louisville Downtown 1 140 Upper Midscale Urban
Hampton Inn & Suites - Austin/Downtown/Convention Center 1 209 Upper Midscale Urban
Hampton Inn & Suites - Baltimore Inner Harbor 1 116 Upper Midscale Urban
Hampton Inn & Suites - Minneapolis/Downtown 1 211 Upper Midscale Urban
Hilton Garden Inn - Houston/Galleria Area 1 182 Upscale Urban
Holiday Inn Express & Suites - San Francisco/Fisherman's Wharf 1 252 Upper Midscale Urban
Hyatt Place - Chicago/Downtown-The Loop 1 206 Upscale Urban
Hyatt Place - Minneapolis/Downtown 1 213 Upscale Urban
Marriott - Boulder 1 165 Upper Upscale Urban
Residence Inn - Atlanta Midtown/Peachtree at 17th 1 160 Upscale Urban
Residence Inn - Baltimore Downtown/Inner Harbor 1 189 Upscale Urban
Residence Inn - Cleveland Downtown 1 175 Upscale Urban
SpringHill Suites - Indianapolis Downtown 1 156 Upscale Urban
SpringHill Suites - Louisville Downtown 1 198 Upscale Urban
Springhill Suites - Nashville MetroCenter 1 78 Upscale Urban
SpringHill Suites - New Orleans Downtown 1 208 Upscale Urban
INN Wholly-Owned (100% Ownership) 57 9,178
Asset Listing (Unaudited)
30 |
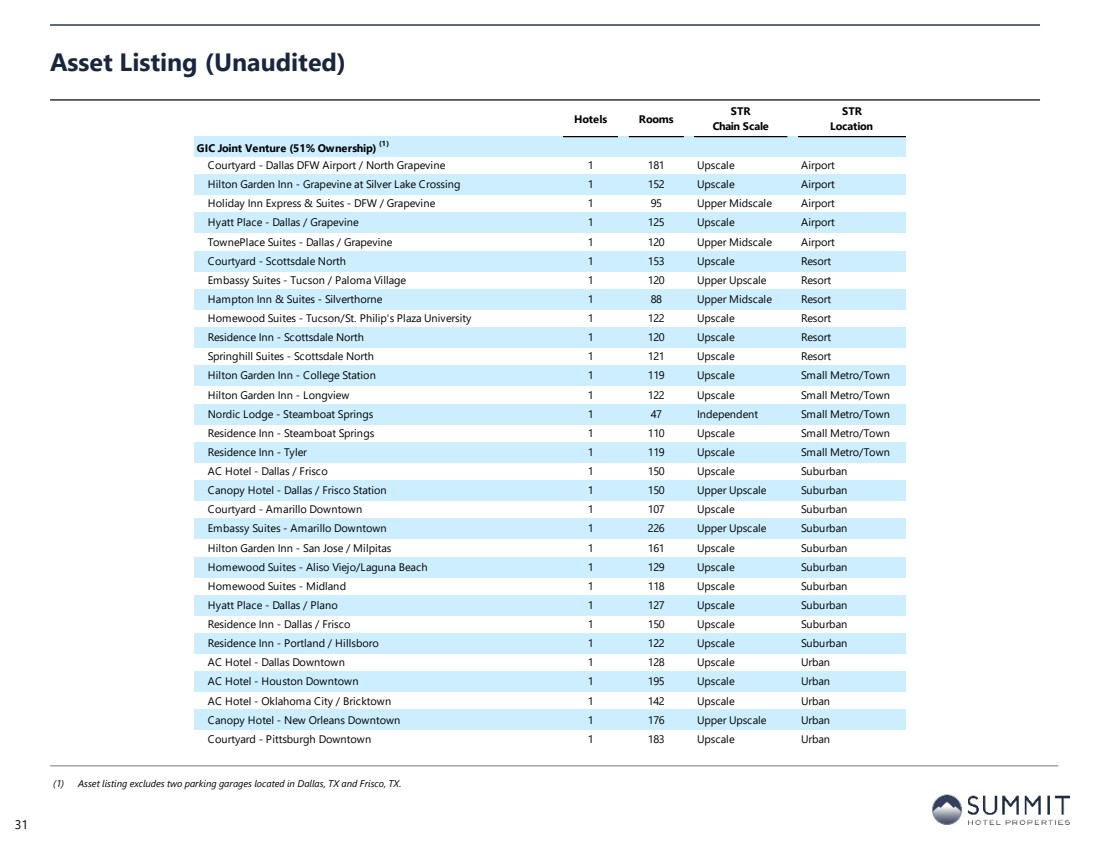
| Hotels Rooms STR
Chain Scale
STR
Location
GIC Joint Venture (51% Ownership) (1)
Courtyard - Dallas DFW Airport / North Grapevine 1 181 Upscale Airport
Hilton Garden Inn - Grapevine at Silver Lake Crossing 1 152 Upscale Airport
Holiday Inn Express & Suites - DFW / Grapevine 1 95 Upper Midscale Airport
Hyatt Place - Dallas / Grapevine 1 125 Upscale Airport
TownePlace Suites - Dallas / Grapevine 1 120 Upper Midscale Airport
Courtyard - Scottsdale North 1 153 Upscale Resort
Embassy Suites - Tucson / Paloma Village 1 120 Upper Upscale Resort
Hampton Inn & Suites - Silverthorne 1 88 Upper Midscale Resort
Homewood Suites - Tucson/St. Philip's Plaza University 1 122 Upscale Resort
Residence Inn - Scottsdale North 1 120 Upscale Resort
Springhill Suites - Scottsdale North 1 121 Upscale Resort
Hilton Garden Inn - College Station 1 119 Upscale Small Metro/Town
Hilton Garden Inn - Longview 1 122 Upscale Small Metro/Town
Nordic Lodge - Steamboat Springs 1 47 Independent Small Metro/Town
Residence Inn - Steamboat Springs 1 110 Upscale Small Metro/Town
Residence Inn - Tyler 1 119 Upscale Small Metro/Town
AC Hotel - Dallas / Frisco 1 150 Upscale Suburban
Canopy Hotel - Dallas / Frisco Station 1 150 Upper Upscale Suburban
Courtyard - Amarillo Downtown 1 107 Upscale Suburban
Embassy Suites - Amarillo Downtown 1 226 Upper Upscale Suburban
Hilton Garden Inn - San Jose / Milpitas 1 161 Upscale Suburban
Homewood Suites - Aliso Viejo/Laguna Beach 1 129 Upscale Suburban
Homewood Suites - Midland 1 118 Upscale Suburban
Hyatt Place - Dallas / Plano 1 127 Upscale Suburban
Residence Inn - Dallas / Frisco 1 150 Upscale Suburban
Residence Inn - Portland / Hillsboro 1 122 Upscale Suburban
AC Hotel - Dallas Downtown 1 128 Upscale Urban
AC Hotel - Houston Downtown 1 195 Upscale Urban
AC Hotel - Oklahoma City / Bricktown 1 142 Upscale Urban
Canopy Hotel - New Orleans Downtown 1 176 Upper Upscale Urban
Courtyard - Pittsburgh Downtown 1 183 Upscale Urban
Asset Listing (Unaudited)
(1) Asset listing excludes two parking garages located in Dallas, TX and Frisco, TX.
31 |
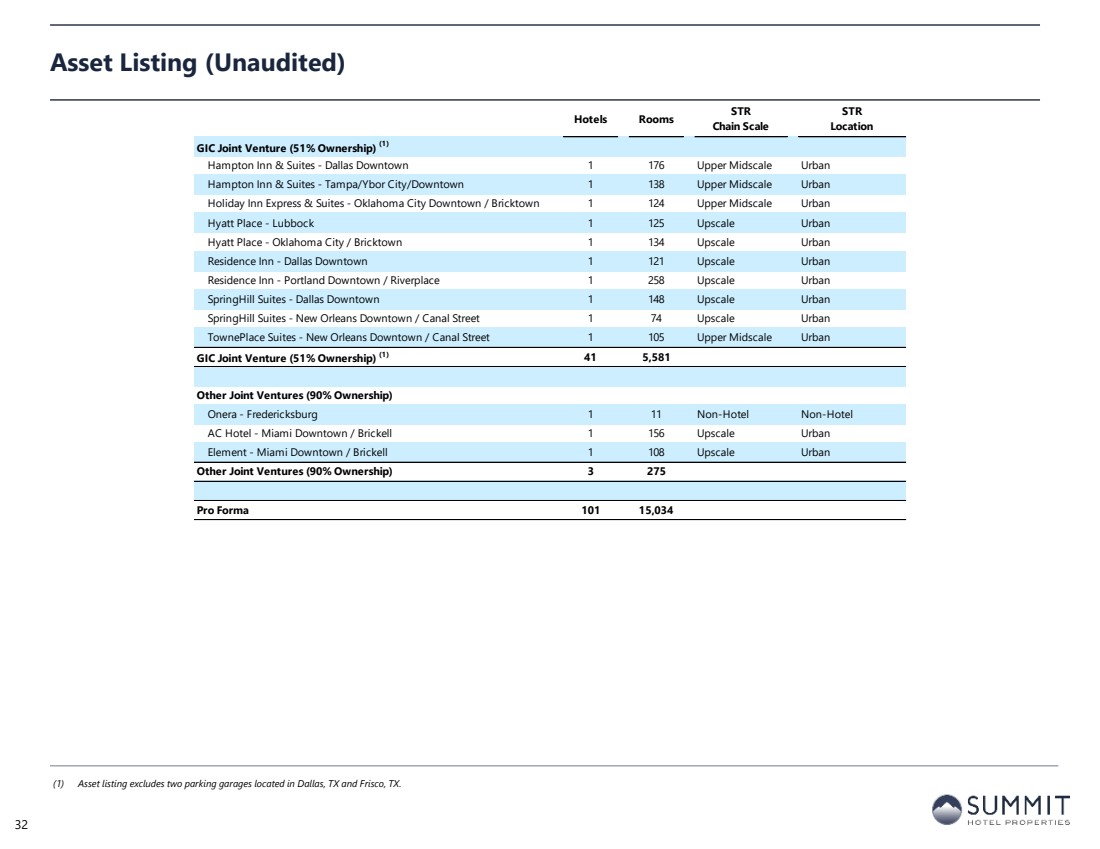
| Hotels Rooms STR
Chain Scale
STR
Location
GIC Joint Venture (51% Ownership) (1)
Hampton Inn & Suites - Dallas Downtown 1 176 Upper Midscale Urban
Hampton Inn & Suites - Tampa/Ybor City/Downtown 1 138 Upper Midscale Urban
Holiday Inn Express & Suites - Oklahoma City Downtown / Bricktown 1 124 Upper Midscale Urban
Hyatt Place - Lubbock 1 125 Upscale Urban
Hyatt Place - Oklahoma City / Bricktown 1 134 Upscale Urban
Residence Inn - Dallas Downtown 1 121 Upscale Urban
Residence Inn - Portland Downtown / Riverplace 1 258 Upscale Urban
SpringHill Suites - Dallas Downtown 1 148 Upscale Urban
SpringHill Suites - New Orleans Downtown / Canal Street 1 74 Upscale Urban
TownePlace Suites - New Orleans Downtown / Canal Street 1 105 Upper Midscale Urban
GIC Joint Venture (51% Ownership) (1) 41 5,581
Other Joint Ventures (90% Ownership)
Onera - Fredericksburg 1 11 Non-Hotel Non-Hotel
AC Hotel - Miami Downtown / Brickell 1 156 Upscale Urban
Element - Miami Downtown / Brickell 1 108 Upscale Urban
Other Joint Ventures (90% Ownership) 3 275
Pro Forma 101 15,034
Asset Listing (Unaudited)
(1) Asset listing excludes two parking garages located in Dallas, TX and Frisco, TX.
32 |
Cover
|
Aug. 02, 2023 |
| Document Information [Line Items] |
|
| Document Type |
8-K
|
| Amendment Flag |
false
|
| Document Period End Date |
Aug. 02, 2023
|
| Entity File Number |
001-35074
|
| Entity Registrant Name |
SUMMIT
HOTEL PROPERTIES, INC.
|
| Entity Central Index Key |
0001497645
|
| Entity Tax Identification Number |
27-2962512
|
| Entity Incorporation, State or Country Code |
MD
|
| Entity Address, Address Line One |
13215 Bee Cave Parkway, Suite B-300
|
| Entity Address, City or Town |
Austin
|
| Entity Address, State or Province |
TX
|
| Entity Address, Postal Zip Code |
78738
|
| City Area Code |
512
|
| Local Phone Number |
538-2300
|
| Written Communications |
false
|
| Soliciting Material |
false
|
| Pre-commencement Tender Offer |
false
|
| Pre-commencement Issuer Tender Offer |
false
|
| Entity Emerging Growth Company |
false
|
| Common Stock [Member] |
|
| Document Information [Line Items] |
|
| Title of 12(b) Security |
Common
Stock, $0.01 par value
|
| Trading Symbol |
INN
|
| Security Exchange Name |
NYSE
|
| Series E Cumulative Redeemable Preferred Stock 0.01 Par Value [Member] |
|
| Document Information [Line Items] |
|
| Title of 12(b) Security |
Series
E Cumulative Redeemable Preferred Stock, $0.01 par value
|
| Trading Symbol |
INN-PE
|
| Security Exchange Name |
NYSE
|
| Series F Cumulative Redeemable Preferred Stock 0.01 Par Value [Member] |
|
| Document Information [Line Items] |
|
| Title of 12(b) Security |
Series
F Cumulative Redeemable Preferred Stock, $0.01 par value
|
| Trading Symbol |
INN-PF
|
| Security Exchange Name |
NYSE
|
| X |
- DefinitionBoolean flag that is true when the XBRL content amends previously-filed or accepted submission.
| Name: |
dei_AmendmentFlag |
| Namespace Prefix: |
dei_ |
| Data Type: |
xbrli:booleanItemType |
| Balance Type: |
na |
| Period Type: |
duration |
|
| X |
- DefinitionFor the EDGAR submission types of Form 8-K: the date of the report, the date of the earliest event reported; for the EDGAR submission types of Form N-1A: the filing date; for all other submission types: the end of the reporting or transition period. The format of the date is YYYY-MM-DD.
| Name: |
dei_DocumentPeriodEndDate |
| Namespace Prefix: |
dei_ |
| Data Type: |
xbrli:dateItemType |
| Balance Type: |
na |
| Period Type: |
duration |
|
| X |
- DefinitionThe type of document being provided (such as 10-K, 10-Q, 485BPOS, etc). The document type is limited to the same value as the supporting SEC submission type, or the word 'Other'.
| Name: |
dei_DocumentType |
| Namespace Prefix: |
dei_ |
| Data Type: |
dei:submissionTypeItemType |
| Balance Type: |
na |
| Period Type: |
duration |
|
| X |
- DefinitionAddress Line 1 such as Attn, Building Name, Street Name
| Name: |
dei_EntityAddressAddressLine1 |
| Namespace Prefix: |
dei_ |
| Data Type: |
xbrli:normalizedStringItemType |
| Balance Type: |
na |
| Period Type: |
duration |
|
| X |
- Definition
+ References
+ Details
| Name: |
dei_EntityAddressCityOrTown |
| Namespace Prefix: |
dei_ |
| Data Type: |
xbrli:normalizedStringItemType |
| Balance Type: |
na |
| Period Type: |
duration |
|
| X |
- DefinitionCode for the postal or zip code
| Name: |
dei_EntityAddressPostalZipCode |
| Namespace Prefix: |
dei_ |
| Data Type: |
xbrli:normalizedStringItemType |
| Balance Type: |
na |
| Period Type: |
duration |
|
| X |
- DefinitionName of the state or province.
| Name: |
dei_EntityAddressStateOrProvince |
| Namespace Prefix: |
dei_ |
| Data Type: |
dei:stateOrProvinceItemType |
| Balance Type: |
na |
| Period Type: |
duration |
|
| X |
- DefinitionA unique 10-digit SEC-issued value to identify entities that have filed disclosures with the SEC. It is commonly abbreviated as CIK. Reference 1: http://www.xbrl.org/2003/role/presentationRef
-Publisher SEC
-Name Exchange Act
-Number 240
-Section 12
-Subsection b-2
| Name: |
dei_EntityCentralIndexKey |
| Namespace Prefix: |
dei_ |
| Data Type: |
dei:centralIndexKeyItemType |
| Balance Type: |
na |
| Period Type: |
duration |
|
| X |
- DefinitionIndicate if registrant meets the emerging growth company criteria. Reference 1: http://www.xbrl.org/2003/role/presentationRef
-Publisher SEC
-Name Exchange Act
-Number 240
-Section 12
-Subsection b-2
| Name: |
dei_EntityEmergingGrowthCompany |
| Namespace Prefix: |
dei_ |
| Data Type: |
xbrli:booleanItemType |
| Balance Type: |
na |
| Period Type: |
duration |
|
| X |
- DefinitionCommission file number. The field allows up to 17 characters. The prefix may contain 1-3 digits, the sequence number may contain 1-8 digits, the optional suffix may contain 1-4 characters, and the fields are separated with a hyphen.
| Name: |
dei_EntityFileNumber |
| Namespace Prefix: |
dei_ |
| Data Type: |
dei:fileNumberItemType |
| Balance Type: |
na |
| Period Type: |
duration |
|
| X |
- DefinitionTwo-character EDGAR code representing the state or country of incorporation.
| Name: |
dei_EntityIncorporationStateCountryCode |
| Namespace Prefix: |
dei_ |
| Data Type: |
dei:edgarStateCountryItemType |
| Balance Type: |
na |
| Period Type: |
duration |
|
| X |
- DefinitionThe exact name of the entity filing the report as specified in its charter, which is required by forms filed with the SEC. Reference 1: http://www.xbrl.org/2003/role/presentationRef
-Publisher SEC
-Name Exchange Act
-Number 240
-Section 12
-Subsection b-2
| Name: |
dei_EntityRegistrantName |
| Namespace Prefix: |
dei_ |
| Data Type: |
xbrli:normalizedStringItemType |
| Balance Type: |
na |
| Period Type: |
duration |
|
| X |
- DefinitionThe Tax Identification Number (TIN), also known as an Employer Identification Number (EIN), is a unique 9-digit value assigned by the IRS. Reference 1: http://www.xbrl.org/2003/role/presentationRef
-Publisher SEC
-Name Exchange Act
-Number 240
-Section 12
-Subsection b-2
| Name: |
dei_EntityTaxIdentificationNumber |
| Namespace Prefix: |
dei_ |
| Data Type: |
dei:employerIdItemType |
| Balance Type: |
na |
| Period Type: |
duration |
|
| X |
- DefinitionLocal phone number for entity.
| Name: |
dei_LocalPhoneNumber |
| Namespace Prefix: |
dei_ |
| Data Type: |
xbrli:normalizedStringItemType |
| Balance Type: |
na |
| Period Type: |
duration |
|
| X |
- DefinitionBoolean flag that is true when the Form 8-K filing is intended to satisfy the filing obligation of the registrant as pre-commencement communications pursuant to Rule 13e-4(c) under the Exchange Act. Reference 1: http://www.xbrl.org/2003/role/presentationRef
-Publisher SEC
-Name Exchange Act
-Number 240
-Section 13e
-Subsection 4c
| Name: |
dei_PreCommencementIssuerTenderOffer |
| Namespace Prefix: |
dei_ |
| Data Type: |
xbrli:booleanItemType |
| Balance Type: |
na |
| Period Type: |
duration |
|
| X |
- DefinitionBoolean flag that is true when the Form 8-K filing is intended to satisfy the filing obligation of the registrant as pre-commencement communications pursuant to Rule 14d-2(b) under the Exchange Act. Reference 1: http://www.xbrl.org/2003/role/presentationRef
-Publisher SEC
-Name Exchange Act
-Number 240
-Section 14d
-Subsection 2b
| Name: |
dei_PreCommencementTenderOffer |
| Namespace Prefix: |
dei_ |
| Data Type: |
xbrli:booleanItemType |
| Balance Type: |
na |
| Period Type: |
duration |
|
| X |
- DefinitionTitle of a 12(b) registered security. Reference 1: http://www.xbrl.org/2003/role/presentationRef
-Publisher SEC
-Name Exchange Act
-Number 240
-Section 12
-Subsection b
| Name: |
dei_Security12bTitle |
| Namespace Prefix: |
dei_ |
| Data Type: |
dei:securityTitleItemType |
| Balance Type: |
na |
| Period Type: |
duration |
|
| X |
- DefinitionName of the Exchange on which a security is registered. Reference 1: http://www.xbrl.org/2003/role/presentationRef
-Publisher SEC
-Name Exchange Act
-Number 240
-Section 12
-Subsection d1-1
| Name: |
dei_SecurityExchangeName |
| Namespace Prefix: |
dei_ |
| Data Type: |
dei:edgarExchangeCodeItemType |
| Balance Type: |
na |
| Period Type: |
duration |
|
| X |
- DefinitionBoolean flag that is true when the Form 8-K filing is intended to satisfy the filing obligation of the registrant as soliciting material pursuant to Rule 14a-12 under the Exchange Act. Reference 1: http://www.xbrl.org/2003/role/presentationRef
-Publisher SEC
-Name Exchange Act
-Section 14a
-Number 240
-Subsection 12
| Name: |
dei_SolicitingMaterial |
| Namespace Prefix: |
dei_ |
| Data Type: |
xbrli:booleanItemType |
| Balance Type: |
na |
| Period Type: |
duration |
|
| X |
- DefinitionTrading symbol of an instrument as listed on an exchange.
| Name: |
dei_TradingSymbol |
| Namespace Prefix: |
dei_ |
| Data Type: |
dei:tradingSymbolItemType |
| Balance Type: |
na |
| Period Type: |
duration |
|
| X |
- DefinitionBoolean flag that is true when the Form 8-K filing is intended to satisfy the filing obligation of the registrant as written communications pursuant to Rule 425 under the Securities Act. Reference 1: http://www.xbrl.org/2003/role/presentationRef
-Publisher SEC
-Name Securities Act
-Number 230
-Section 425
| Name: |
dei_WrittenCommunications |
| Namespace Prefix: |
dei_ |
| Data Type: |
xbrli:booleanItemType |
| Balance Type: |
na |
| Period Type: |
duration |
|
| X |
- Details
| Name: |
us-gaap_StatementClassOfStockAxis=us-gaap_CommonStockMember |
| Namespace Prefix: |
|
| Data Type: |
na |
| Balance Type: |
|
| Period Type: |
|
|
| X |
- Details
| Name: |
us-gaap_StatementClassOfStockAxis=inn_SeriesECumulativeRedeemablePreferredStock0.01ParValueMember |
| Namespace Prefix: |
|
| Data Type: |
na |
| Balance Type: |
|
| Period Type: |
|
|
| X |
- Details
| Name: |
us-gaap_StatementClassOfStockAxis=inn_SeriesFCumulativeRedeemablePreferredStock0.01ParValueMember |
| Namespace Prefix: |
|
| Data Type: |
na |
| Balance Type: |
|
| Period Type: |
|
|
Grafico Azioni Summit Hotel Properties (NYSE:INN-F)
Storico
Da Giu 2024 a Lug 2024

Grafico Azioni Summit Hotel Properties (NYSE:INN-F)
Storico
Da Lug 2023 a Lug 2024
