false
N-2
0001526329
0001526329
2023-12-01
2024-11-30
0001526329
2024-11-30
0001526329
2023-11-30
0001526329
2022-11-30
0001526329
2021-11-30
0001526329
2020-11-30
0001526329
2019-11-30
0001526329
2022-12-01
2023-11-30
0001526329
2021-12-01
2022-11-30
0001526329
2020-12-01
2021-11-30
0001526329
2019-12-01
2020-11-30
iso4217:USD
xbrli:shares
iso4217:USD
xbrli:shares
xbrli:pure
UNITED STATES
SECURITIES AND EXCHANGE COMMISSION
Washington, D.C. 20549
FORM N-CSR
CERTIFIED SHAREHOLDER REPORT OF REGISTERED
MANAGEMENT INVESTMENT COMPANIES
Investment Company Act file number 811-22585
Tortoise Pipeline & Energy Fund, Inc.
(Exact name of registrant as specified in charter)
5901 College Boulevard, Suite 400, Overland Park,
KS 66211
(Address of principal executive offices) (Zip code)
Matthew G.P. Sallee
Diane Bono
5901 College Boulevard, Suite 400, Overland Park, KS 66211
(Name and address of agent for service)
913-981-1020
Registrant's telephone number, including area code
Date of fiscal year end: November 30
Date of reporting period: November 30, 2024
Item 1. Report to Stockholders.
(a) The report to Shareholders is attached herewith.

Annual Report | November 30, 2024
2024
Annual Report
Closed-End
Funds
Tortoise
2024
Annual Report to Stockholders
This combined report provides you with a comprehensive
review of our funds that span essential assets.
TTP and TPZ distribution policies
Tortoise Pipeline & Energy Fund, Inc. (“TTP”)
and Tortoise Power and Energy Infrastructure Fund, Inc. (“TPZ”) are relying on exemptive relief permitting them to make long-term
capital gain distributions throughout the year. Each of TTP and TPZ, with approval of its Board of Directors (the “Board”),
has adopted a managed distribution policy (the “Policy”). Annual distribution amounts are expected to fall in the range of
7% to 10% of the average week-ending net asset value (“NAV”) per share for the prior fiscal semi-annual period. In accordance
with its Policy, TTP distributes a fixed amount per common share, currently $0.59, each quarter to its common shareholders. TPZ distributes
a fixed amount per common share, currently $0.105, each month to its common shareholders. These amounts are subject to change from time
to time at the discretion of the Board. Although the level of distributions is independent of TTP’s and TPZ’s performance,
TTP and TPZ expect such distributions to correlate with its performance over time. Each quarterly and monthly distribution to shareholders
is expected to be at the fixed amount established by the Board, except for extraordinary distributions in light of TTP’s and TPZ’s
performance for the entire calendar year and to enable TTP and TPZ to comply with the distribution requirements imposed by the Internal
Revenue Code. The Board may amend, suspend or terminate the Policy without prior notice to shareholders if it deems such action to be
in the best interests of TTP, TPZ and their respective shareholders. For example, the Board might take such action if the Policy had the
effect of shrinking TTP’s or TPZ’s assets to a level that was determined to be detrimental to TTP or TPZ shareholders. The
suspension or termination of the Policy could have the effect of creating a trading discount (if TTP’s or TPZ’s stock is trading
at or above net asset value), widening an existing trading discount, or decreasing an existing premium. You should not draw any conclusions
about TTP’s or TPZ’s investment performance from the amount of the distribution or from the terms of TTP’s or TPZ’s
distribution policy. Each of TTP and TPZ estimates that it has distributed more than its income and net realized capital gains; therefore,
a portion of your distribution may be a return of capital. A return of capital may occur, for example, when some or all of the money that
you invested in TTP or TPZ is paid back to you. A return of capital distribution does not necessarily reflect TTP’s or TPZ’s
investment performance and should not be confused with “yield” or “income.” The amounts and sources of distributions
reported are only estimates and are not being provided for tax reporting purposes. The actual amounts and sources of the amounts for tax
reporting purposes will depend upon TTP’s and TPZ’s investment experience during their fiscal year and may be subject to changes
based on tax regulations. TTP and TPZ will send you a Form 1099-DIV for the calendar year that will tell you how to report these distributions
for federal income tax purposes.
Tortoise
2024 Annual Report | November
30, 2024
Closed-end Fund Comparison
| |
Name/Ticker |
Primary
focus |
Structure |
Total Assets
($ millions)(1) |
Portfolio mix
by asset type(1) |
Portfolio mix
by structure(1) |
 |
Tortoise Energy
Infrastructure Corp.
NYSE: TYG
Inception: 2/2004 |
Energy
Infrastructure |
Regulated
investment
company |
$689.5 |
 |
 |
Tortoise Midstream
Energy Fund, Inc.
NYSE: NTG
Inception: 7/2010 |
Natural Gas
Infrastructure |
Regulated
investment
company |
$403.9 |
 |
 |
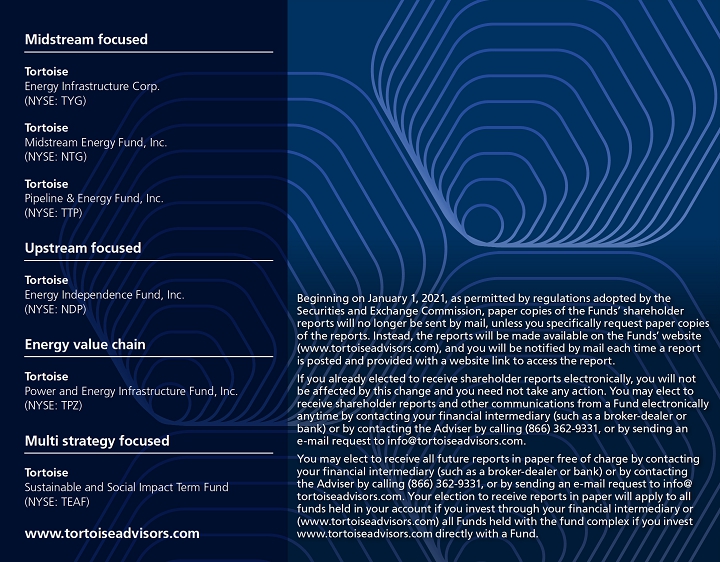
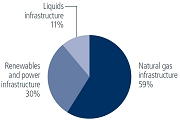
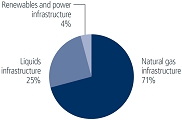
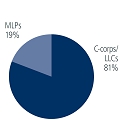
Tortoise Pipeline
& Energy Fund, Inc.
NYSE: TTP
Inception: 10/2011 |
North
American
pipeline
companies |
Regulated
investment
company |
$119.2 |
 |
 |
 |
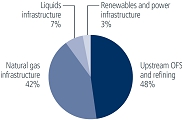
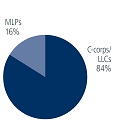
Tortoise Energy
Independence
Fund, Inc.
NYSE: NDP
Inception: 7/2012 |
North
American
oil & gas
producers |
Regulated
investment
company |
$87.0 |
 |
 |
 |
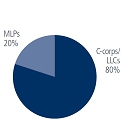
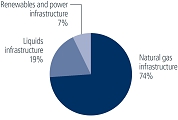
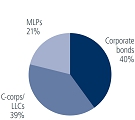
Tortoise Power
and Energy
Infrastructure
Fund, Inc.
NYSE: TPZ
Inception: 7/2009 |
Power
& energy
infrastructure
companies
(Fixed income
& equity) |
Regulated
investment
company |
$151.3 |
 |
 |
 |
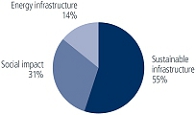
Tortoise Sustainable
and Social Impact
Term Fund
NYSE: TEAF
Inception: 3/2019 |
Essential
assets |
Regulated
investment
company |
$230.3 |
 |
 |
(1) As of 11/30/2024
(unaudited)
Tortoise
2024 Annual Report to closed-end fund stockholders
Dear
stockholder,
The
midstream energy sector, as measured by the Alerian Midstream Energy Index, posted a strong fiscal year 2024 gain of 53.0% while the
broader energy sector also finished higher, but less so, improving by 16.7% as represented by the S&P Energy Select Sector Index®.
Midstream management teams exhibited disciplined capital allocation, maintaining robust balance sheets, increasing dividends, strategically
repurchasing shares, and investing in high-return capital projects. During the year, project opportunities expanded significantly, driven
by rising power demand to support the development of data centers fueled by rapid advancements in artificial intelligence. In response
to this increased demand, new natural gas pipeline projects were anticipated to address the substantial growth in power needs, with natural
gas-fired power generation expected to play a vital role. Meanwhile, the broader energy sector’s performance reflected lower crude
oil demand growth forecasts for 2025, attributed to a weakening Chinese economy and reduced refining margins resulting from high utilization
rates and newly added international refining capacity.
Earnings
within the energy infrastructure sector were largely in line with or exceeded estimates throughout the fiscal year, driven by continued
volume growth, particularly from increased production in the Permian Basin. Additionally, the growing demand for exports of natural gas,
ethane, and propane contributed to performance. Discussions regarding the supply of natural gas to power data centers continued as a
key theme during earnings calls for natural gas infrastructure companies. The need for additional natural gas takeaway capacity from
the Permian Basin remained evident, as natural gas prices in West Texas were significantly lower than other pricing hubs, frequently
dipping into negative territory. Despite increased investments to address natural gas takeaway constraints and rising demand, capital
expenditures remain approximately half of pre-2020 levels, enabling companies to distribute substantial free cash flow for shareholder
returns. In fact, share buybacks are on track to surpass the $4 billion share repurchase expectation for 2024, underscoring its strong
financial performance and commitment to returning capital to shareholders.
The
broader energy sector delivered earnings that largely met expectations, with producers emphasizing their capacity to increase production
while simultaneously reducing capital expenditures, showcasing enhanced operational efficiency. Meanwhile, refining margins contracted
due to demand uncertainties and increased supply, exerting pressure on select stocks. Capital allocation strategies remained strongly
focused on maximizing shareholder value. Companies prioritized initiatives such as dividend growth, strategic share buybacks, maintaining
low leverage, and pursuing accretive mergers and acquisitions aimed at acquiring complementary assets. Additionally, consistent with
midstream segment trends, rising power demand fueled by artificial intelligence-driven data center expansion emerged as a key opportunity
that energy companies actively positioned themselves to capitalize on.
For
information on sustainable infrastructure, waste transition and social impact sectors, please refer to the Tortoise Sustainable and Social
Impact Term Fund letter on page 18.
The
S&P Energy Select Sector® Index is a capitalization-weighted index of S&P 500® Index companies
in the energy sector involved in the development or production of energy products. The Alerian Midstream Energy Index is a broad-based
composite of North American energy infrastructure companies. The capped, float-adjusted, capitalization-weighted index, whose constituents
earn the majority of their cash flow from midstream activities involving energy commodities, is disseminated real-time on a price-return
basis (AMNA) and on a total-return basis (AMNAX).
It
is not possible to invest directly in an index.
Performance
data quoted represent past performance; past performance does not guarantee future results. Like any other stock, total return and market
value will fluctuate so that an investment, when sold, may be worth more or less than its original cost.
(unaudited)
2024 Annual Report | November
30, 2024
Tortoise
Energy Infrastructure
Corp. (TYG)
Fund description
Tortoise Energy Infrastructure
Corp. (TYG) seeks a high level of total return with an emphasis on current distributions paid to stockholders. TYG invests primarily in
equity securities in energy infrastructure companies. The fund is positioned to benefit from growing energy demand and accelerated efforts
to reduce global CO2 emissions in energy production. Energy
infrastructure companies generate, transport and distribute electricity, as well as process, store, distribute and market natural gas,
natural gas liquids, refined products and crude oil.
Fund performance
The
midstream energy sector returned 53.0% for the fiscal year (as measured by the Alerian Midstream Energy Index or AMNA), topping broader
energy. This robust performance stemmed from several factors. Energy infrastructure company management teams demonstrated disciplined
capital allocation by maintaining healthy balance sheets, increasing dividends, opportunistically repurchasing shares, and investing
in high-return capital projects. Throughout the year, project opportunities expanded significantly as expected power demand surged to
support the development of data centers driven by the growing pace of advancements in artificial intelligence. Utilities also benefited
from the accelerating growth in load demand, prompting companies to raise their earnings guidance for the foreseeable future. The fund’s
market-based and NAV-based returns (including the reinvestment of distributions) for the fiscal year were 77.9% and 59.8%, respectively.
The Tortoise MLP Index and the Tortoise Decarbonization Infrastructure Index returned 28.2% and 44.1%, respectively, during the same
period
2024 fiscal year summary
| Quarterly
distributions paid per share |
$0.7800 |
| Distribution
rate (as of 11/30/2024) |
6.8% |
| Year-over-year
distribution increase (decrease) |
9.9% |
| Cumulative
distributions paid per share to stockholders since inception in February 2004 |
$46.8275 |
| Market-based
total return |
77.89% |
| NAV-based
total return |
59.78% |
| Premium
(discount) to NAV (as of 11/30/2024) |
(11.5)% |
Key asset performance drivers
| Top
five contributors |
Company
type |
| Targa
Resources Corp. |
Natural
gas pipeline |
| The
Williams Companies, Inc. |
Natural
gas pipeline |
| ONEOK,
Inc. |
Natural
gas pipeline |
| Constellation
Energy Corp. |
Power |
| MPLX
LP |
Refined
products pipeline |
| Bottom
five contributors |
Company
type |
| TK
NYS Solar Holdco LLC — Private |
Renewable
infrastructure |
| New
Fortress Energy Inc. |
Natural
gas pipeline |
| Xcel
Energy Inc. |
Diversified
infrastructure |
| AES
Corp. |
Power |
| South
Bow Corp. |
Crude
oil pipeline |
Unlike the fund
return, index return is pre-expenses and taxes.
Performance data
quoted represent past performance; past performance does not guarantee future results. Like any other stock, total return and market
value will fluctuate so that an investment, when sold, may be worth more or less than its original cost. Portfolio composition is subject
to change due to ongoing management of the fund. References to specific securities or sectors should not be construed as a recommendation
by the fund or its adviser. See Schedule of Investments for portfolio weighting at the end of the fiscal quarter.
(unaudited)
Tortoise
Energy
Infrastructure Corp. (TYG) (continued)
Value of $10,000
vs. Tortoise Energy Infrastructure Fund – Market (unaudited)
From November 30, 2014 through November 30, 2024
The
chart assumes an initial investment of $10,000. Performance reflects waivers of fee and operating expenses in effect. In the absence
of such waivers, total return would be reduced. Performance data quoted represents past performance and does not guarantee future results.
Investment returns and principal value will fluctuate, and when sold, may be worth more or less than their original cost. Performance
current to the most recent month-end may be lower or higher than the performance quoted and can be obtained by calling 866-362-9331.
Performance assumes the reinvestment of capital gains and income distributions. The performance does not reflect the deduction of taxes
that a shareholder would pay on Fund distributions or the redemption of Fund shares.
Annualized Rates of Return as of November 30, 2024
| | |
1-Year | |
3-Year | |
5-Year | |
10-Year | |
Since
Inception(1) |
| Tortoise
Energy Infrastructure Fund – NAV | |
59.78% | |
25.23% | |
1.98% | |
-4.54% | |
4.73% |
| Tortoise
Energy Infrastructure Fund – Market | |
77.89% | |
29.97% | |
0.00% | |
-5.10% | |
3.86% |
| Tortoise
MLP Index® | |
28.24% | |
29.74% | |
18.64% | |
4.58% | |
10.02% |
| Tortoise
Decarbonization Infrastructure IndexSM(2) | |
44.05% | |
N/A | |
N/A | |
N/A | |
N/A |
| (1) |
Inception date of the Fund was Feburary
25, 2004. |
| (2) |
The Tortoise Decarbonization Infrastructure
Index was added to reflect the inclusion of a broader scope of energy infrastructure equities including midstream, utilities, and
renewables in TYG effective November 30, 2021. |
Fund structure and distribution policy
The
fund is structured to qualify as a Regulated Investment Company (RIC) allowing it to pass-through to shareholders income and capital
gains earned, thus avoiding double-taxation. To qualify as a RIC, the fund must meet specific income, diversification and distribution
requirements. Regarding income, at least 90 percent of the fund’s gross income must be from dividends, interest and capital gains.
The fund must meet quarterly diversification requirements including the requirement that at least 50 percent of the assets be in cash,
cash equivalents or other securities with each single issuer of other securities not greater than 5 percent of total assets. No more
than 25 percent of total assets can be invested in any one issuer other than government securities or other RIC’s. The fund must
also distribute at least 90 percent of its investment company income. RIC’s are also subject to excise tax rules which require
RIC’s to distribute approximately 98 percent of net income and net capital gains to avoid a 4 percent excise tax.
The
fund has adopted a managed distribution policy (“MDP”). Annual distribution amounts are expected to fall in the range of
7% to 10% of the average week-ending net asset value (“NAV”) per share for the prior fiscal semi-annual period. Distribution
amounts will be reset both up and down to provide a consistent return on trailing NAV. Under the MDP, distribution amounts will normally
be reset in February and August, with no changes in distribution amounts in May and November.
Leverage
The
fund’s leverage utilization increased $11.7 million during the six months ended Q4 2024, compared to the six months ended Q2 2024,
and represented 18.4% of total assets at November 30, 2024. At year-end, the fund was in compliance with applicable coverage ratios,
67.6% of the leverage cost was fixed, the weighted-average maturity was 1.2 years and the weighted-average annual rate on leverage was
4.14%. These rates will vary in the future as a result of changing floating rates, utilization of the fund’s credit facility and
as leverage matures or is redeemed. During the fiscal year ended November 30, 2024, $14.5 million of Senior Notes were paid in full upon
maturity.
Please
see the Financial Statements and Notes to Financial Statements for additional detail regarding critical accounting policies, results
of operations, leverage, taxes and other important fund information.
For
further information regarding the fund’s leverage and distributions to stockholders, as well as a discussion of the tax impact
on distributions, please visit www.tortoiseadvisors.com.
(unaudited)
2024 Annual Report | November
30, 2024
TYG Key Financial Data (supplemental
unaudited information)
(dollar amounts in thousands unless otherwise indicated)
The information presented below is supplemental non-GAAP
financial information, is not inclusive of required financial disclosures (e.g. Total Expense Ratio), and should be read in conjunction
with the full financial statements.
| | |
2023 | | |
2024 | |
| | |
Q3(1) | | |
Q4(1) | | |
Q1(1) | | |
Q2(1) | | |
Q3(1) | | |
Q4(1) | |
| Selected Financial Information | |
| | | |
| | | |
| | | |
| | | |
| | | |
| | |
| Distributions paid on common stock | |
$ | 8,045 | | |
$ | 7,643 | | |
$ | 7,643 | | |
$ | 7,643 | | |
$ | 8,397 | | |
$ | 8,397 | |
| Distributions paid on common stock per share(2) | |
| 0.7100 | | |
| 0.7100 | | |
| 0.7100 | | |
| 0.7100 | | |
| 0.7800 | | |
| 0.7800 | |
| Total assets, end of period(3) | |
| 527,003 | | |
| 492,651 | | |
| 508,813 | | |
| 563,922 | | |
| 578,758 | | |
| 689,509 | |
| Average total assets during period(3)(4) | |
| 526,517 | | |
| 503,464 | | |
| 496,314 | | |
| 532,401 | | |
| 564,953 | | |
| 620,894 | |
| Leverage(5) | |
| 120,413 | | |
| 107,814 | | |
| 113,294 | | |
| 115,517 | | |
| 120,994 | | |
| 127,194 | |
| Leverage as a percent of total assets | |
| 22.8 | % | |
| 21.9 | % | |
| 22.3 | % | |
| 20.5 | % | |
| 20.9 | % | |
| 18.4 | % |
| Operating expenses before leverage costs and current taxes(6) | |
| 1.26 | % | |
| 1.73 | % | |
| 1.21 | % | |
| 1.28 | % | |
| 1.36 | % | |
| 1.42 | % |
| Net unrealized appreciation (depreciation), end of period | |
| (34,940 | ) | |
| (58,511 | ) | |
| (39,969 | ) | |
| 18,703 | | |
| 6,236 | | |
| 16,973 | |
| Net assets, end of period | |
| 403,510 | | |
| 380,497 | | |
| 382,860 | | |
| 435,800 | | |
| 455,838 | | |
| 559,339 | |
| Average net assets during period(7) | |
| 406,929 | | |
| 384,850 | | |
| 377,999 | | |
| 414,387 | | |
| 441,752 | | |
| 494,367 | |
| Net asset value per common share(2) | |
| 35.61 | | |
| 35.35 | | |
| 35.57 | | |
| 40.48 | | |
| 42.34 | | |
| 51.96 | |
| Market value per share(2) | |
| 30.13 | | |
| 28.11 | | |
| 29.27 | | |
| 33.51 | | |
| 35.77 | | |
| 46.00 | |
| Shares outstanding (000's) | |
| 11,332 | | |
| 10,765 | | |
| 10,765 | | |
| 10,765 | | |
| 10,765 | | |
| 10,765 | |
| (1) |
Q1 is the period from December through February. Q2 is the period from March
through May. Q3 is the period from June through August. Q4 is the period from September through November. |
| (2) |
Adjusted to reflect 1 for 4 reverse stock split effective May 1, 2020. |
| (3) |
Includes deferred issuance and offering costs on senior notes and preferred stock.
|
| (4) |
Computed by averaging month-end values within each period. |
| (5) |
Leverage consists of senior notes, preferred stock and outstanding borrowings
under credit facilities. |
| (6) |
As a percent of total assets |
| (7) |
Computed by averaging daily net assets within each period. |
Tortoise
Midstream Energy Fund, Inc. (NTG)
Fund description
The Tortoise Midstream Energy Fund (NTG) seeks to provide
stockholders with a high level of total return with an emphasis on current distributions. NTG invests primarily in midstream energy equities
that own and operate a network of pipeline and energy related logistical infrastructure assets with an emphasis on those that transport,
gather, process and store natural gas and natural gas liquids (NGLs). NTG targets midstream energy equities, including MLPs benefiting
from U.S. natural gas production and consumption expansion, with minimal direct commodity exposure.
Fund performance
The
midstream energy sector returned 53.0% for the fiscal year (as measured by the Alerian Midstream Energy Index or AMNA), topping broader
energy. This robust performance stemmed from several factors. Company management teams demonstrated disciplined capital allocation by
maintaining healthy balance sheets, increasing dividends, opportunistically repurchasing shares, and investing in high-return capital
projects. Throughout the year, project opportunities expanded significantly as expected power demand surged to support the development
of data centers driven by the growing pace of advancements in artificial intelligence. In response, new natural gas pipeline projects
were approved to accommodate the substantial growth in power demand, with natural gas-fired power generation expected to play a critical
role. The fund’s market-based and NAV-based returns (including the reinvestment of distributions) for the fiscal year were 83.9%
and 67.5%, respectively. The Tortoise MLP Index returned 28.2% during the same period.
| 2024
fiscal year summary |
|
| Quarterly distributions paid per share |
$0.8100 |
| Distribution rate (as of 11/30/2024) |
5.5% |
| Year-over-year distribution increase (decrease) |
5.2% |
| Cumulative distributions paid per share to stockholders since inception in July 2010 |
$27.2803 |
| Market-based total return |
83.92% |
| NAV-based total return |
67.53% |
| Premium (discount) to NAV (as of 11/30/2024) |
(11.9)% |
Key asset performance drivers
| Top
five contributors |
Company
type |
| Targa Resources Corp. |
Natural gas pipeline |
| ONEOK, Inc. |
Natural gas pipeline |
| The Williams Companies, Inc. |
Natural gas pipeline |
| MPLX LP |
Refined products pipeline |
| DT Midstream, Inc. |
Natural gas pipeline |
| Bottom
five contributors |
Company
type |
| New Fortress Energy Inc. |
Natural gas pipeline |
| CMS Energy Corp. |
Power |
| South Bow Corp. |
Crude oil pipeline |
| NextDecade Corp. |
Natural gas pipeline |
| NextEra Energy, Inc. |
Diversified infrastructure |
Unlike
the fund return, index return is pre-expenses and taxes.
Performance
data quoted represent past performance; past performance does not guarantee future results. Like any other stock, total return and market
value will fluctuate so that an investment, when sold, may be worth more or less than its original cost. Portfolio composition is subject
to change due to ongoing management of the fund. References to specific securities or sectors should not be construed as a recommendation
by the fund or its adviser. See Schedule of Investments for portfolio weighting at the end of the fiscal quarter.
(unaudited)
2024 Annual Report | November
30, 2024
Tortoise
Midstream Energy Fund, Inc.
(NTG) (continued)
Value of $10,000 vs. Tortoise
Midstream Energy Fund – Market (unaudited)
From November 30, 2014 through November 30, 2024
The
chart assumes an initial investment of $10,000. Performance reflects waivers of fee and operating expenses in effect. In the absence
of such waivers, total return would be reduced. Performance data quoted represents past performance and does not guarantee future results.
Investment returns and principal value will fluctuate, and when sold, may be worth more or less than their original cost. Performance
current to the most recent month-end may be lower or higher than the performance quoted and can be obtained by calling 866-362-9331.
Performance assumes the reinvestment of capital gains and income distributions. The performance does not reflect the deduction of taxes
that a shareholder would pay on Fund distributions or the redemption of Fund shares.
Annualized Rates of Return
as of November 30, 2024
| | |
1-Year | |
3-Year | |
5-Year | |
10-Year | |
Since
Inception(1) |
| Tortoise Midstream Energy Fund – NAV | |
67.53% | |
31.52% | |
-1.77% | |
-6.01% |
|
-0.89% |
| Tortoise Midstream Energy Fund – Market | |
83.92% | |
35.03% | |
-2.94% | |
-6.59% |
|
-2.07% |
| Tortoise MLP Index® | |
28.24% | |
29.74% | |
18.64% | |
4.58% |
|
8.40% |
| (1) |
Inception date of the Fund was July 27, 2010. |
Fund structure and distribution policy
The
fund is structured to qualify as a Regulated Investment Company (RIC) allowing it to pass-through to shareholders income and capital
gains earned, thus avoiding double-taxation. To qualify as a RIC, the fund must meet specific income, diversification and distribution
requirements. Regarding income, at least 90 percent of the fund’s gross income must be from dividends, interest and capital gains.
The fund must meet quarterly diversification requirements including the requirement that at least 50 percent of the assets be in cash,
cash equivalents or other securities with each single issuer of other securities not greater than 5 percent of total assets. No more
than 25 percent of total assets can be invested in any one issuer other than government securities or other RIC’s. The fund must
also distribute at least 90 percent of its investment company income. RIC’s are also subject to excise tax rules which require
RIC’s to distribute approximately 98 percent of net income and net capital gains to avoid a 4 percent excise tax.
The
fund has adopted a managed distribution policy (“MDP”). Annual distribution amounts are expected to fall in the range of
7% to 10% of the average week-ending net asset value (“NAV”) per share for the prior fiscal semi-annual period. Distribution
amounts will be reset both up and down to provide a consistent return on trailing NAV. Under the MDP, distribution amounts will normally
be reset in February and August, with no changes in distribution amounts in May and November.
Leverage
The
fund’s leverage utilization increased $7.6 million during the six months ended Q4 2024, compared to the six months ended Q2 2024,
and represented 15.9% of total assets at November 30, 2024. At year-end, the fund was in compliance with applicable coverage ratios,
66.9% of the leverage cost was fixed, the weighted-average maturity was 2.3 years and the weighted-average annual rate on leverage was
3.93%. These rates will vary in the future as a result of changing floating rates, utilization of the fund’s credit facility and
as leverage matures or is redeemed.
Please
see the Financial Statements and Notes to Financial Statements for additional detail regarding critical accounting policies, results
of operations, leverage, taxes and other important fund information.
For
further information regarding the fund’s leverage and distributions to stockholders, as well as a discussion of the tax impact
on distributions, please visit www.tortoiseadvisors.com.
(unaudited)
NTG
Key Financial Data (supplemental unaudited information)
(dollar amounts in thousands unless otherwise indicated)
The
information presented below is supplemental non-GAAP financial information, is not inclusive of required financial disclosures (e.g.
Total Expense Ratio), and should be read in conjunction with the full financial statements.
| | |
2023 | | |
2024 | |
| | |
Q3(1) | | |
Q4(1) | | |
Q1(1) | | |
Q2(1) | | |
Q3(1) | | |
Q4(1) | |
| Selected Financial Information | |
| | | |
| | | |
| | | |
| | | |
| | | |
| | |
| Distributions paid on common stock | |
$ | 4,128 | | |
$ | 3,921 | | |
$ | 3,921 | | |
$ | 3,921 | | |
$ | 4,125 | | |
$ | 4,125 | |
| Distributions paid on common stock per share(2) | |
| 0.7700 | | |
| 0.7700 | | |
| 0.7700 | | |
| 0.7700 | | |
| 0.8100 | | |
| 0.8100 | |
| Total assets, end of period(3) | |
| 287,287 | | |
| 272,818 | | |
| 279,021 | | |
| 310,068 | | |
| 330,395 | | |
| 403,852 | |
| Average total assets during period(3)(4) | |
| 280,548 | | |
| 276,916 | | |
| 273,920 | | |
| 295,102 | | |
| 317,465 | | |
| 354,818 | |
| Leverage(5) | |
| 60,720 | | |
| 53,524 | | |
| 56,024 | | |
| 56,569 | | |
| 58,524 | | |
| 64,124 | |
| Leverage as a percent of total assets | |
| 21.1 | % | |
| 19.6 | % | |
| 20.1 | % | |
| 18.2 | % | |
| 17.7 | % | |
| 15.9 | % |
| Operating expenses before leverage costs and current taxes(6) | |
| 1.43 | % | |
| 2.15 | % | |
| 1.33 | % | |
| 1.43 | % | |
| 1.54 | % | |
| 1.50 | % |
| Net unrealized appreciation (depreciation), end of period | |
| 17,267 | | |
| 5,003 | | |
| 14,580 | | |
| 44,972 | | |
| 33,654 | | |
| 49,755 | |
| Net assets, end of period | |
| 225,096 | | |
| 217,066 | | |
| 220,886 | | |
| 246,768 | | |
| 270,909 | | |
| 338,536 | |
| Average net assets during period(7) | |
| 220,209 | | |
| 217,415 | | |
| 214,843 | | |
| 238,661 | | |
| 256,498 | | |
| 292,471 | |
| Net asset value per common share(2) | |
| 41.99 | | |
| 42.62 | | |
| 43.37 | | |
| 48.45 | | |
| 53.19 | | |
| 66.47 | |
| Market value per common share(2) | |
| 35.40 | | |
| 34.22 | | |
| 35.84 | | |
| 40.34 | | |
| 44.95 | | |
| 58.59 | |
| Shares outstanding (000's) | |
| 5,361 | | |
| 5,093 | | |
| 5,093 | | |
| 5,093 | | |
| 5,093 | | |
| 5,093 | |
| (1) |
Q1 is the period from December through February. Q2 is the period from March
through May. Q3 is the period from June through August. Q4 is the period from September through November. |
| (2) |
Adjusted to reflect 1 for 10 reverse stock split effective May 1, 2020. |
| (3) |
Includes deferred issuance and offering costs on senior notes and preferred stock. |
| (4) |
Computed by averaging month-end values within each period. |
| (5) |
Leverage consists of senior notes, preferred stock and outstanding borrowings under the credit
facility. |
| (6) |
Computed as a percent of total assets. |
| (7) |
Computed by averaging daily net assets within each period. |
2024 Annual Report | November
30, 2024
Tortoise
Pipeline & Energy Fund, Inc. (TTP)
Fund description
The Tortoise Pipeline & Energy Fund (TTP) seeks a high
level of total return with an emphasis on current distributions paid to stockholders. TTP invests primarily in equity securities of North
American pipeline companies that transport natural gas, natural gas liquids (NGLs), crude oil and refined products and, to a lesser extent,
in other energy infrastructure companies.
Fund performance
The
midstream energy sector returned 53.0% for the fiscal year (as measured by the Alerian Midstream Energy Index or AMNA), topping broader
energy. This robust performance stemmed from several factors. Company management teams demonstrated disciplined capital allocation by
maintaining healthy balance sheets, increasing dividends, opportunistically repurchasing shares, and investing in high-return capital
projects. Throughout the year, project opportunities expanded significantly as expected power demand surged to support the development
of data centers driven by the growing pace of advancements in artificial intelligence. In response, new natural gas pipeline projects
were approved to accommodate the substantial growth in power demand, with natural gas-fired power generation expected to play a critical
role. The fund’s market-based and NAV-based returns (including the reinvestment of distributions) for the fiscal year were 98.8%
and 62.2%, respectively. The Tortoise North American Pipeline Index returned 48.0% during the same period.
| 2024
fiscal year summary |
|
| Quarterly distributions paid per share |
$0.5900 |
| Distribution rate (as of 11/30/2024) |
4.5% |
| Year-over-year distribution increase (decrease) |
0.0% |
| Cumulative distributions paid per share to stockholders
since inception in October 2011 |
$22.0175 |
| Market-based total return |
98.77% |
| NAV-based total return |
62.19% |
| Premium (discount) to NAV (as of 11/30/2024) |
(0.7)% |
Please
refer to the inside front cover of the report for important information about the fund’s distribution policy.
Key asset performance drivers
| Top
five contributors |
Company type |
| ONEOK, Inc. |
Natural gas pipeline |
| Targa Resources Corp. |
Natural gas pipeline |
| The Wiliams Companies Inc. |
Natural gas pipeline |
| Kinder Morgan, Inc. |
Natural gas pipeline |
| Plains GP Holdings LP |
Crude oil pipeline |
| Bottom five contributors |
Company type |
| EQT Corp. |
Oil & gas production |
| Westlake Chemical Partners LP |
Chemicals |
| Sunoco LP |
Refined products pipeline |
| Excelerate Energy, Inc. |
Natural gas pipeline |
| Clearway Energy, Inc. |
Diversified Infrastructure |
Unlike
the fund return, index return is pre-expenses.
Performance
data quoted represent past performance; past performance does not guarantee future results. Like any other stock, total return and market
value will fluctuate so that an investment, when sold, may be worth more or less than its original cost. Portfolio composition is subject
to change due to ongoing management of the fund. References to specific securities or sectors should not be construed as a recommendation
by the fund or its adviser. See Schedule of Investments for portfolio weighting at the end of the fiscal quarter.
(unaudited)
Tortoise
Pipeline & Energy Fund,
Inc. (TTP) (continued)
Value of $10,000 vs. Tortoise
Pipeline and Energy Fund – Market (unaudited)
From November 30, 2014 through November 30, 2024
The
chart assumes an initial investment of $10,000. Performance reflects waivers of fee and operating expenses in effect. In the absence
of such waivers, total return would be reduced. Performance data quoted represents past performance and does not guarantee future results.
Investment returns and principal value will fluctuate, and when sold, may be worth more or less than their original cost. Performance
current to the most recent month-end may be lower or higher than the performance quoted and can be obtained by calling 866-362-9331.
Performance assumes the reinvestment of capital gains and income distributions. The performance does not reflect the deduction of taxes
that a shareholder would pay on Fund distributions or the redemption of Fund shares.
| Annualized Rates of Return as of November 30, 2024 | |
| |
| |
| |
|
| | |
1-Year | |
3-Year | |
5-Year | |
10-Year | |
Since
Inception(1) |
| Tortoise Pipeline and Energy Fund – NAV | |
62.19% | |
33.32% | |
7.51% | |
-1.68% | |
3.02% |
| Tortoise Pipeline and Energy Fund – Market | |
98.77% | |
41.60% | |
9.92% | |
-1.01% | |
2.60% |
| Tortoise North American Pipeline Index | |
48.04% | |
26.00% | |
17.16% | |
8.41% | |
10.50% |
| (1) |
Inception date of the Fund was October 26, 2011. |
Fund structure and distribution policy
The
fund is structured to qualify as a Regulated Investment Company (RIC) allowing it to pass-through to shareholders income and capital
gains earned, thus avoiding double-taxation. To qualify as a RIC, the fund must meet specific income, diversification and distribution
requirements. Regarding income, at least 90 percent of the fund’s gross income must be from dividends, interest and capital gains.
The fund must meet quarterly diversification requirements including the requirement that at least 50 percent of the assets be in cash,
cash equivalents or other securities with each single issuer of other securities not greater than 5 percent of total assets. No more
than 25 percent of total assets can be invested in any one issuer other than government securities or other RIC’s. The fund must
also distribute at least 90 percent of its investment company income. RIC’s are also subject to excise tax rules which require
RIC’s to distribute approximately 98 percent of net income and net capital gains to avoid a 4 percent excise tax.
The
fund has adopted a distribution policy which is included on the inside front cover of this report. To summarize, the fund has adopted
a managed distribution policy (“MDP”). Annual distribution amounts are expected to fall in the range of 7% to 10% of the
average week-ending net asset value (“NAV”) per share for the prior fiscal semi-annual period. Distribution amounts will
be reset both up and down to provide a consistent return on trailing NAV. Under the MDP, distribution amounts will normally be reset
in February and August, with no changes in distribution amounts in May and November. The fund may designate a portion of its distributions
as capital gains and may also distribute additional capital gains in the last quarter of the year to meet annual excise distribution
requirements. Distribution amounts are subject to change from time to time at the discretion of the Board.
Leverage
The
fund’s leverage utilization decreased $4.3 million during the six months ended Q4 2024, compared to the six months ended Q2 2024,
and represented 10.5% of total assets at November 30, 2024. At year-end, the fund was in compliance with applicable coverage ratios,
78.8% of the leverage cost was fixed, the weighted-average maturity was less than 1 year and the weighted-average annual rate on leverage
was 4.83%. These rates will vary in the future as a result of changing floating rates, utilization of the fund’s credit facility
and as leverage matures or is redeemed.
Please
see the Financial Statements and Notes to Financial Statements for additional detail regarding critical accounting policies, results
of operations, leverage and other important fund information.
For
further information regarding the fund’s leverage and distributions to stockholders, as well as a discussion of the tax impact
on distributions, please visit www.tortoiseadvisors.com.
(unaudited)
2024 Annual
Report | November 30, 2024
TTP
Key Financial Data (supplemental unaudited information)
(dollar
amounts in thousands unless otherwise indicated)
The information presented below
is supplemental non-GAAP financial information, is not inclusive of required financial disclosures (e.g. Total Expense Ratio), and should
be read in conjunction with the full financial statements.
| | |
2023 | | |
2024 |
| | |
Q3(1) | | |
Q4(1) | | |
Q1(1) | | |
Q2(1) | | |
Q3(1) | | |
Q4(1) | |
| Selected Financial Information | |
| | | |
| | | |
| | | |
| | | |
| | | |
| | |
| Distributions paid on common stock | |
$ | 1,249 | | |
$ | 1,186 | | |
$ | 1,186 | | |
$ | 1,186 | | |
$ | 1,186 | | |
$ | 1,186 | |
| Distributions paid on common stock per share(2) | |
| 0.5900 | | |
| 0.5900 | | |
| 0.5900 | | |
| 0.5900 | | |
| 0.5900 | | |
| 0.5900 | |
| Total assets, end of period(3) | |
| 88,301 | | |
| 86,167 | | |
| 88,476 | | |
| 96,617 | | |
| 104,888 | | |
| 119,184 | |
| Average total assets during period(3)(4) | |
| 86,853 | | |
| 86,272 | | |
| 86,558 | | |
| 93,406 | | |
| 100,494 | | |
| 109,716 | |
| Leverage(5) | |
| 17,343 | | |
| 15,943 | | |
| 16,343 | | |
| 16,737 | | |
| 17,043 | | |
| 12,473 | |
| Leverage as a percent of total assets | |
| 19.6 | % | |
| 18.5 | % | |
| 18.5 | % | |
| 17.3 | % | |
| 16.2 | % | |
| 10.5 | % |
| Operating expenses before leverage costs(6) | |
| 1.39 | % | |
| 1.30 | % | |
| 1.32 | % | |
| 1.36 | % | |
| 1.33 | % | |
| 1.35 | % |
| Net unrealized appreciation (depreciation), end of period | |
| 17,306 | | |
| 17,779 | | |
| 21,106 | | |
| 29,711 | | |
| 40,518 | | |
| 57,670 | |
| Net assets, end of period | |
| 70,447 | | |
| 69,525 | | |
| 71,745 | | |
| 79,434 | | |
| 87,396 | | |
| 105,962 | |
| Average net assets during period(7) | |
| 69,717 | | |
| 69,161 | | |
| 69,552 | | |
| 77,012 | | |
| 82,595 | | |
| 93,146 | |
| Net asset value per common share(2) | |
| 33.29 | | |
| 34.58 | | |
| 35.68 | | |
| 39.51 | | |
| 43.47 | | |
| 52.70 | |
| Market value per common share(2) | |
| 28.36 | | |
| 28.02 | | |
| 29.23 | | |
| 34.70 | | |
| 41.69 | | |
| 52.34 | |
| Shares outstanding (000's) | |
| 2,116 | | |
| 2,011 | | |
| 2,011 | | |
| 2,011 | | |
| 2,011 | | |
| 2,011 | |
| (1) |
Q1 is the period from December through February. Q2 is the period from March
through May. Q3 is the period from June through August. Q4 is the period from September through November. |
| (2) |
Adjusted to reflect 1 for 4 reverse stock split effective May 1, 2020. |
| (3) |
Includes deferred issuance and offering costs on senior notes and preferred stock. (4) Computed
by averaging month-end values within each period. |
| (5) |
Leverage consists of senior notes, preferred stock and outstanding borrowings under the revolving
credit facility. |
| (6) |
Computed as a percent of total assets. |
| (7) |
Computed by averaging daily net assets within each period. |
Tortoise
Energy Independence Fund, Inc. (NDP)
Fund description
The Tortoise Energy Independence Fund
(NDP) seeks a high level of total return with an emphasis on current distributions paid to stockholders. NDP invests primarily in equity
securities of upstream North American energy companies that engage in the exploration and production of crude oil, condensate, natural
gas and natural gas liquids that generally have a significant presence in North American oil and gas fields, including shale reservoirs.
Fund performance
The
broad energy sector returned 16.7% for the annual fiscal period (as measured by the S&P 500 Energy Index). This performance stemmed
from several factors. Company management teams demonstrated disciplined capital allocation by maintaining healthy balance sheets, increasing
dividends, opportunistically repurchasing shares, and staying focused toward M&A. Throughout the year, natural gas opportunities
expanded significantly as expected power demand surged to support the development of data centers driven by the growing pace of advancements
in artificial intelligence. Concerns over terminal value risks for fossil fuel assets diminished as demand for U.S. liquefied natural
gas (LNG) remained strong and the adoption of electric vehicles slowed. Producers also specifically benefitted from improved drilling
efficiencies that offset lower energy commodity prices. The fund’s market-based and NAV-based returns (including the reinvestment
of distributions) for the fiscal year were 63.3% and 36.3%, respectively.
| 2024
fiscal year summary |
|
| Quarterly distributions paid per share |
$0.6300 |
| Distribution rate (as of 11/30/2024) |
5.7% |
| Year-over-year distribution increase (decrease) |
0.0% |
| Cumulative
distributions paid per share to stockholders since inception in July 2012 |
$19.8525 |
| Market-based total return |
63.28% |
| NAV-based total return |
36.30% |
| Premium (discount)
to NAV (as of 11/30/2024) |
(2.2)% |
Key asset performance drivers
| Top
five contributors |
Company
type |
| Targa Resources Corp. |
Natural gas pipeline |
| Energy Transfer LP |
Natural gas pipeline |
| Kodiak Gas Services, Inc. |
Gathering & processing |
| Cheniere Energy, Inc. |
Natural gas pipeline |
| Diamondback Energy, Inc. |
Oil & gas production |
| Bottom
five contributors |
Company
type |
| Occidental Petroleum Corp. |
Oil & gas production |
| Devon Energy Corp. |
Oil & gas production |
| ConocoPhillips |
Oil & gas production |
| Darling Ingredients, Inc. |
Renewable infrastructure |
| Mach Natural Resources LP |
Oil & gas production |
Unlike
the fund return, index return is pre-expenses.
Performance
data quoted represent past performance: past performance does not guarantee future results. Like any other stock, total return and market
value will fluctuate so that an investment, when sold, may be worth more or less than its original cost. Portfolio composition is subject
to change due to ongoing management of the fund. References to specific securities or sectors should not be construed as a recommendation
by the fund or its adviser. See Schedule of Investments for portfolio weighting at the end of the fiscal quarter.
(unaudited)
2024 Annual Report | November
30, 2024
Tortoise
Energy
Independence Fund, Inc. (NDP) (continued)
Value
of $10,000 vs. Tortoise Energy Independence Fund – Market (unaudited)
From November 30, 2014 through November 30, 2024
The
chart assumes an initial investment of $10,000. Performance reflects waivers of fee and operating expenses in effect. In the absence
of such waivers, total return would be reduced. Performance data quoted represents past performance and does not guarantee future results.
Investment returns and principal value will fluctuate, and when sold, may be worth more or less than their original cost. Performance
current to the most recent month-end may be lower or higher than the performance quoted and can be obtained by calling 866-362-9331.
Performance assumes the reinvestment of capital gains and income distributions. The performance does not reflect the deduction of taxes
that a shareholder would pay on Fund distributions or the redemption of Fund shares.
Annualized Rates of Return as of November
30, 2024
| | |
1-Year | |
3-Year | |
5-Year | |
10-Year | |
Since
Inception(1) |
| Tortoise Energy Independence Fund – NAV | |
| 36.30 | % | |
| 30.77 | % | |
| 12.48 | % | |
| -4.15 | % | |
| -2.48% |
| Tortoise Energy Independence Fund – Market | |
| 63.28 | % | |
| 35.19 | % | |
| 15.12 | % | |
| -3.73 | % | |
| -3.02% |
| S&P 500 Energy Select Sector Index | |
| 16.88 | % | |
| 25.33 | % | |
| 15.89 | % | |
| 6.05 | % | |
| 6.45% |
| (1) |
Inception date of the Fund was July 26, 2012. |
Fund structure and distribution
policy
The
fund is structured to qualify as a Regulated Investment Company (RIC) allowing it to pass-through to shareholders income and capital
gains earned, thus avoiding double-taxation. To qualify as a RIC, the fund must meet specific income, diversification and distribution
requirements. Regarding income, at least 90 percent of the fund’s gross income must be from dividends, interest and capital gains.
The fund must meet quarterly diversification requirements including the requirement that at least 50 percent of the assets be in cash,
cash equivalents or other securities with each single issuer of other securities not greater than 5 percent of total assets. No more
than 25 percent of total assets can be invested in any one issuer other than government securities or other RIC’s. The fund must
also distribute at least 90 percent of its investment company income. RIC’s are also subject to excise tax rules which require
RIC’s to distribute approximately 98 percent of net income and net capital gains to avoid a 4 percent excise tax.
The
fund has adopted a distribution policy which is included on the inside front cover of this report. To summarize, the fund has adopted
a managed distribution policy (“MDP”). Annual distribution amounts are expected to fall in the range of 7% to 10% of the
average week-ending net asset value (“NAV”) per share for the prior fiscal semi-annual period. Distribution amounts will
be reset both up and down to provide a consistent return on trailing NAV. Under the MDP, distribution amounts will normally be reset
in February and August, with no changes in distribution amounts in May and November. The fund may designate a portion of its distributions
as capital gains and may also distribute additional capital gains in the last quarter of the year to meet annual excise distribution
requirements. Distribution amounts are subject to change from time to time at the discretion of the Board.
Leverage
The
fund’s leverage utilization increased by $1.4 million, during the six months ended Q4 2024 as compared to the six months ended
Q2 2024. The fund utilizes all floating rate leverage that had a weighted-average annual rate of 5.54% and represented 13.3% of total
assets at year-end. During the period, the fund maintained compliance with its applicable coverage ratios. The interest rate on the fund’s
leverage will vary in the future along with changing floating rates.
Please
see the Financial Statements and Notes to Financial Statements for additional detail regarding critical accounting policies, results
of operations, leverage and other important fund information.
For
further information regarding the fund’s leverage and distributions to stockholders, as well as a discussion of the tax impact
on distributions, please visit www.tortoiseadvisors.com.
(unaudited)
NDP
Key Financial Data (supplemental unaudited information)
(dollar amounts in thousands unless otherwise indicated)
The information presented below
is supplemental non-GAAP financial information, is not inclusive of required financial disclosures (e.g. Total Expense Ratio), and should
be read in conjunction with the full financial statements.
| | |
2023 | | |
2024 |
| | |
Q3(1) | | |
Q4(1) | | |
Q1(1) | | |
Q2(1) | | |
Q3(1) | | |
Q4(1) | |
| Selected
Financial Information | |
| | | |
| | | |
| | | |
| | | |
| | | |
| | |
| Distributions
paid on common stock | |
$ | 1,105 | | |
$ | 1,050 | | |
$ | 1,050 | | |
$ | 1,050 | | |
$ | 1,049 | | |
$ | 1,049 | |
| Distributions
paid on common stock per share(2) | |
| 0.6300 | | |
| 0.6300 | | |
| 0.6300 | | |
| 0.6300 | | |
| 0.6300 | | |
| 0.6300 | |
| Total assets, end of period | |
| 72,535 | | |
| 68,156 | | |
| 69,682 | | |
| 76,577 | | |
| 77,627 | | |
| 86,961 | |
| Average
total assets during period(3) | |
| 69,136 | | |
| 71,088 | | |
| 67,823 | | |
| 74,387 | | |
| 77,299 | | |
| 79,863 | |
| Leverage(4) | |
| 8,600 | | |
| 8,800 | | |
| 9,700 | | |
| 10,200 | | |
| 10,900 | | |
| 11,600 | |
| Leverage as a percent
of total assets | |
| 11.9 | % | |
| 12.9 | % | |
| 13.9 | % | |
| 13.3 | % | |
| 14.0 | % | |
| 13.3 | % |
| Operating expenses
before leverage costs as a percent of total assets | |
| 1.34 | % | |
| 1.35 | % | |
| 1.31 | % | |
| 1.37 | % | |
| 1.33 | % | |
| 1.34 | % |
| Net unrealized
appreciation (depreciation), end of period | |
| 29,184 | | |
| 24,611 | | |
| 26,314 | | |
| 33,435 | | |
| 34,769 | | |
| 42,858 | |
| Net assets, end of period | |
| 63,590 | | |
| 59,053 | | |
| 59,743 | | |
| 66,122 | | |
| 66,453 | | |
| 75,108 | |
| Average
net assets during period(5) | |
| 60,016 | | |
| 62,520 | | |
| 57,737 | | |
| 65,132 | | |
| 65,845 | | |
| 68,337 | |
| Net
asset value per common share(2) | |
| 36.26 | | |
| 35.45 | | |
| 35.86 | | |
| 39.69 | | |
| 39.89 | | |
| 45.08 | |
| Market
value per common share(2) | |
| 31.15 | | |
| 28.95 | | |
| 30.81 | | |
| 33.98 | | |
| 38.23 | | |
| 44.10 | |
| Shares outstanding (000's) | |
| 1,754 | | |
| 1,666 | | |
| 1,666 | | |
| 1,666 | | |
| 1,666 | | |
| 1,666 | |
| (1) |
Q1 is the period from December through February. Q2 is the period from March through May. Q3
is the period from June through August. Q4 is the period from September through November. |
| (2) |
Adjusted to reflect 1 for 8 reverse stock split effective May 1, 2020. |
| (3) |
Computed by averaging month-end values within each period. |
| (4) |
Leverage consists of outstanding borrowings under the margin loan facility. |
| (5) |
Computed by averaging
daily net assets within each period. |
2024 Annual
Report | November 30, 2024
Tortoise
Power and Energy Infrastructure
Fund, Inc. (TPZ)
Fund description
The
Tortoise Power and Energy Infrastructure Fund (TPZ) seeks to provide a high level of current income to stockholders, with a secondary
objective of capital appreciation. TPZ seeks to invest primarily in fixed income and dividend-paying equity securities of power and energy
infrastructure companies that provide stable and defensive characteristics throughout economic cycles.
Fund performance
The
midstream energy sector returned 53.0% for the fiscal year (as measured by the Alerian Midstream Energy Index or AMNA), topping broader
energy. This robust performance stemmed from several factors. Energy infrastructure company management teams demonstrated disciplined
capital allocation by maintaining healthy balance sheets, increasing dividends, opportunistically repurchasing shares, and investing
in high-return capital projects. Throughout the year, project opportunities expanded significantly as expected power demand surged to
support the development of data centers driven by the growing pace of advancements in artificial intelligence. Utilities also benefited
from the accelerating growth in load demand, prompting companies to raise their earnings guidance for the foreseeable future. The fund’s
market-based and NAV-based returns (including the reinvestment of distributions) for the fiscal year were 65.8% and 41.6%, respectively.
Comparatively, the TPZ Benchmark Composite* returned 15.3% for the same period. The fund’s equity holdings outperformed its fixed
income holdings for the fiscal year on a total return basis.
| 2024 fiscal year summary |
|
| Quarterly distributions paid per share |
$0.3150 |
| Monthly distributions paid per share |
$0.1050 |
| Distribution rate (as of 11/30/2024) |
6.1% |
| Year-over-year distribution increase (decrease) |
0.0% |
| Cumulative distributions
to stockholders since inception in July 2009 |
$22.1550 |
| Market-based total return |
65.78% |
| NAV-based total return |
41.57% |
| Premium (discount)
to NAV (as of 11/30/2024) |
(2.2)% |
| * |
The TPZ Benchmark Composite includes the BofA Merrill Lynch U.S. Energy Index (CIEN), the BofA Merrill Lynch U.S. Electricity Index (CUEL) and the Tortoise MLP Index® (TMLP). It is comprised of a blend of 70% fixed income and 30% equity securities issued by companies in the power and energy infrastructure sectors. |
Please
refer to the inside front cover of the report for important information about the fund’s distribution policy.
Key asset performance drivers
| Top
five contributors |
Company type |
| Targa Resources Corp. |
Natural gas pipeline |
| ONEOK, Inc. |
Natural gas pipeline |
| The Williams Companies, Inc. |
Natural gas pipeline |
| MPLX LP |
Refined products pipeline |
| Energy Transfer LP |
Natural gas pipeline |
| Bottom five contributors |
Company type |
| Holly Energy Partners, L.P. |
Refined products pipeline |
| PBF Energy, Inc. |
Refining |
| EQT Corp. |
Oil & gas production |
| HF Sinclair Corp |
Refining |
| Clearway Energy, Inc. |
Diversified infrastructure |
Unlike
the fund return, index return is pre-expenses.
Performance
data quoted represent past performance; past performance does not guarantee future results. Like any other stock, total return and market
value will fluctuate so that an investment, when sold, may be worth more or less than its original cost. Portfolio composition is subject
to change due to ongoing management of the fund. References to specific securities or sectors should not be construed as a recommendation
by the fund or its adviser. See Schedule of Investments for portfolio weighting at the end of the fiscal quarter.
(unaudited)
Tortoise
Power
and Energy Infrastructure Fund, Inc. (TPZ) (continued)
Value
of $10,000 vs. Tortoise Power and Energy Infrastructure Fund – Market (unaudited)
From November 30, 2014 through
November 30, 2024
The
chart assumes an initial investment of $10,000. Performance reflects waivers of fee and operating expenses in effect. In the absence
of such waivers, total return would be reduced. Performance data quoted represents past performance and does not guarantee future results.
Investment returns and principal value will fluctuate, and when sold, may be worth more or less than their original cost. Performance
current to the most recent month-end may be lower or higher than the performance quoted and can be obtained by calling 866-362-9331.
Performance assumes the reinvestment of capital gains and income distributions. The performance does not reflect the deduction of taxes
that a shareholder would pay on Fund distributions or the redemption of Fund shares.
Annualized Rates of Return as of
November 30, 2024
| | |
1-Year | |
3-Year |
5-Year | |
10-Year | |
Since
Inception(2) |
| Tortoise Power and Energy Infrastructure Fund – NAV | |
41.57% | |
22.19% |
12.52% | |
4.69% | |
8.30% |
| Tortoise Power and Energy Infrastructure Fund – Market | |
65.78% | |
27.73% |
14.93% | |
5.98% | |
8.14% |
| TPZ Benchmark Composite(1) | |
15.28% | |
7.16% |
6.91% | |
3.93% | |
6.58% |
| (1) |
The TPZ Benchmark Composite includes the BofA Merrill Lynch U.S. Energy Index (CIEN), the BofA Merrill Lynch U.S. Electricity Index (CUEL) and the Tortoise MLP Index® (TMLP). |
| (2) |
Inception date of the Fund was July 29, 2009. |
Fund structure and distribution
policy
The
fund is structured to qualify as a Regulated Investment Company (RIC) allowing it to pass-through to shareholders income and capital
gains earned, thus avoiding double-taxation. To qualify as a RIC, the fund must meet specific income, diversification and distribution
requirements. Regarding income, at least 90 percent of the fund gross income must be from dividends, interest and capital gains. The
fund must meet quarterly diversification requirements including the requirement that at least 50 percent of the assets be in cash, cash
equivalents or other securities with each single issuer of other securities not greater than 5 percent of total assets. No more than
25 percent of total assets can be invested in any one issuer other than government securities or other RIC’s. The fund must also
distribute at least 90 percent of its investment company income. RIC’s are also subject to excise tax rules which require RIC’s
to distribute approximately 98 percent of net income and net capital gains to avoid a 4 percent excise tax.
The
fund has adopted a distribution policy which is included on the inside front cover of this report. To summarize, the fund has adopted
a managed distribution policy (“MDP”). Annual distribution amounts are expected to fall in the range of 7% to 10% of the
average week-ending net asset value (“NAV”) per share for the prior fiscal semi-annual period. Distribution amounts will
be reset both up and down to provide a consistent return on trailing NAV. Under the MDP, distribution amounts will normally be reset
in February and August, with no changes in distribution amounts in May and November. The fund may designate a portion of its distributions
as capital gains and may also distribute additional capital gains in the last quarter of the year to meet annual excise distribution
requirements. Distribution amounts are subject to change from time to time at the discretion of the Board.
Leverage
The
fund’s leverage utilization increased $1.2 million during the six months ended Q4 2024, as compared to the six months ended Q2
2024, and represented 16.9% of total assets at November 30, 2024. During the period, the fund maintained compliance with its applicable
coverage ratios. The fund utilizes all floating rate leverage that had a weighted-average annual rate of 5.57%. These rates will vary
in the future as a result of changing floating rates.
Please
see the Financial Statements and Notes to Financial Statements for additional detail regarding critical accounting policies, results
of operations, leverage and other important fund information.
For
further information regarding the fund’s leverage and distributions to stockholders, as well as a discussion of the tax impact
on distributions, please visit www.tortoiseadvisors.com.
(unaudited)
2024 Annual
Report | November 30, 2024
TPZ
Key Financial Data (supplemental unaudited information)
(dollar amounts in thousands unless otherwise indicated)
The information presented below
is supplemental non-GAAP financial information, is not inclusive of required financial disclosures (e.g. Total Expense Ratio), and should
be read in conjunction with the full financial statements.
| | |
2023 | | |
2024 |
| | |
Q3(1) | | |
Q4(1) | | |
Q1(1) | | |
Q2(1) | | |
Q3(1) | | |
Q4(1) | |
| Selected Financial Information | |
| | | |
| | | |
| | | |
| | | |
| | | |
| | |
| Distributions paid on common stock | |
$ | 1,953 | | |
$ | 1,921 | | |
$ | 1,855 | | |
$ | 1,855 | | |
$ | 1,856 | | |
$ | 1,856 | |
| Distributions paid on common stock per share | |
| 0.3150 | | |
| 0.3150 | | |
| 0.3150 | | |
| 0.3150 | | |
| 0.3150 | | |
| 0.3150 | |
| Total assets, end of period | |
| 124,656 | | |
| 120,802 | | |
| 124,804 | | |
| 129,248 | | |
| 135,367 | | |
| 151,275 | |
| Average total assets during period(2) | |
| 122,556 | | |
| 122,039 | | |
| 122,267 | | |
| 127,457 | | |
| 131,842 | | |
| 140,247 | |
| Leverage(3) | |
| 25,400 | | |
| 24,600 | | |
| 25,000 | | |
| 24,300 | | |
| 24,500 | | |
| 25,500 | |
| Leverage as a percent of total assets | |
| 20.4 | % | |
| 20.4 | % | |
| 20.0 | % | |
| 18.8 | % | |
| 18.1 | % | |
| 16.9 | % |
| Operating expenses before leverage costs as a percent of total assets | |
| 1.40 | % | |
| 0.93 | % | |
| 1.33 | % | |
| 1.38 | % | |
| 1.39 | % | |
| 1.53 | % |
| Net unrealized appreciation (depreciation), end of period | |
| 15,511 | | |
| 14,867 | | |
| 19,804 | | |
| 26,623 | | |
| 34,568 | | |
| 51,026 | |
| Net assets, end of period | |
| 98,570 | | |
| 95,724 | | |
| 99,386 | | |
| 104,532 | | |
| 100,434 | | |
| 125,389 | |
| Average net assets during period(4) | |
| 97,132 | | |
| 96,174 | | |
| 96,459 | | |
| 103,258 | | |
| 107,244 | | |
| 114,433 | |
| Net asset value per common share | |
| 15.90 | | |
| 16.25 | | |
| 16.87 | | |
| 17.75 | | |
| 18.75 | | |
| 21.29 | |
| Market value per common share | |
| 13.76 | | |
| 13.57 | | |
| 14.56 | | |
| 15.45 | | |
| 18.35 | | |
| 20.82 | |
| Shares outstanding (000's) | |
| 6,200 | | |
| 5,890 | | |
| 5,890 | | |
| 5,890 | | |
| 5,890 | | |
| 5,890 | |
| (1) |
Q1 is the period from December through February. Q2 is the period from March through May. Q3 is the period from June through August. Q4 is the period from September through November. |
| (2) |
Computed by averaging month-end values within each period. |
| (3) |
Leverage consists of outstanding borrowings under the margin loan facility. |
| (4) |
Computed by averaging daily net assets within each period. |
Tortoise
Sustainable and Social Impact Term
Fund (TEAF)
Fund description
The
Tortoise Sustainable and Social Impact Term Fund (TEAF) seeks to provide a high level of total return with an emphasis on current distributions.
TEAF provides investors access to a combination of public and direct investments in essential assets that are making an impact on clients
and communities.
Fund Performance
TEAF
generated positive NAV performance in fiscal year 2024.
| ● |
Listed sustainable infrastructure: Performance was mixed, with U.S. utilities
and regulated utilities performing well due to increased demand and declining bond yields, while French-exposed stocks underperformed
due to potential tax increases and geopolitical uncertainty. |
| |
|
| ● |
Listed energy infrastructure: Companies performed well during the period,
driven by increased demand for hydrocarbons, particularly natural gas, robust free cash flow, AI data centers, energy exports, and
resilient oil demand. |
| |
|
| ● |
Private social infrastructure: Investments in charter schools and senior
living facilities performed in line with expectations, with successful realizations and stable outcomes across key projects. |
| |
|
| ● |
Private sustainable infrastructure: Investments have had mixed performance
with some assets suffering from equipment issues. Other assets are progressing as planned with stable cash flows, IPO preparations
and debt repayments. |
Looking
ahead to 2025, we continue to have a constructive outlook for the underlying assets in the TEAF portfolio. We expect that listed sustainable
infrastructure equities, TEAF’s largest allocation, may continue to navigate a difficult environment caused by interest rate policy
as well as global growth uncertainty. Nevertheless, decarbonisation and electrification trends have strong momentum with key drivers
such as increasing renewables, manufacturing re-shoring and energy efficiency driving investment. Corporates and consumers will continue
to replace carbon-emitting energy sources with renewables, ensuring renewables growth at a reasonable rate of return. We maintain a positive
outlook for energy infrastructure equities in 2025 driven by favorable fundamentals and a focus on capital return to equity owners. TEAF’s
social infrastructure assets have performed well, and we expect that performance to continue as new investment opportunities accelerate
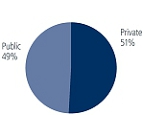
in key segments such as education and healthcare. As of November 30, 2024, TEAF’s total direct investment commitments were approximately
$116 million or approximately 51% of the portfolio. Tortoise Capital is conducting an ongoing strategic review of the investment strategy
for the Tortoise Sustainable and Social Impact Term Fund. This review, first announced in September 2024, includes evaluating the impact
of blending private and public investments within a closed-end fund structure.
Listed sustainable infrastructure
Markets and our sectors
Equity
markets reacted positively to declining inflation and the policy interest rates cuts in many Organization for Economic Cooperation and
Development (OECD) economies in the second half of the financial year. Longer term bond yields fell between April and September, helping
interest rate sensitive stocks. Elections and changing political agendas in the UK, France and the U.S. provided political uncertainty
while continuing geopolitical tensions unsettled investor confidence.
U.S.
utilities were the stand-out outperformers during the year as the reappearance of power demand growth, driven partly by data centers
but also by economic activity, re-shoring and the switch from fossil fuels in power generation gives a pivotal role to the transmission
& distribution utilities that will hook that power up to final users as well as to the generators. Consequently, in the U.S. as well
as in Europe, earnings results and guidance were strong, often nicely ahead of market expectations, helping the appreciation of shares
still trading on low valuations.
Performance summary
The
best contributor in the portfolio over the period was Vistra, which is a diversified U.S. integrated utility operating natural gas, coal,
nuclear and solar generation capacity plus one of the largest battery storage facilities in the world. Compared to peers, it has low
debt ratios and above average free cash flows, and nearly half its
(unaudited)
2024 Annual Report | November
30, 2024
Tortoise
Sustainable
and Social Impact Term Fund (TEAF) (continued)
generation
capacity in Texas where we see structurally higher power prices because baseload capacity is being replaced by intermittent renewables.
Vistra is a direct beneficiary of accelerating demand from energy-intensive businesses (including data centers) for constantly available
decarbonised electricity. Data centers are increasingly connecting directly to nuclear plants and ready to pay a significant premium
over wholesale power prices to secure their need for baseload power.
After
a disappointing stock performance in the previous year, NextEra Energy’s shares outperformed as quarterly earnings results consistently
exceeded market expectations. This reflected strong customer growth, new additions to its renewables and storage portfolio and cost controls.
Regulated wires-focussed utilities such as American Electric Power and Edison International also performed well as bond yields came down,
earnings came through and customer demand growth materialised sooner than expected. Edison International, as an illustration, expects
35% higher 10-year load growth than just two years ago.
National
Grid and SSE represented the majority of the portfolio’s UK exposure. Those stocks are well exposed to the themes of transmission
& distribution and electrification that we are emphasising in the portfolio, and they were strong performers during the second half
of the year. Enel provided a consistently good performance contribution as it continued to deliver strong earnings. Its asset disposal
program is ahead of plan and the stock is trading at attractive valuation multiples; the shares also benefited from the decline in Italian
bond yields.
Stocks
with French exposure (Vinci, Veolia, Engie, Atlas Arteria) were weak toward year-end given the prospect of a rise in the corporate tax
rate as the government struggled to shore up its 2025 budget.
2025 outlook
We
believe that decarbonization and electrification trends have strong momentum with key drivers such as increasing renewables, manufacturing
re-shoring and energy efficiency driving investment. Corporates and consumers will continue to replace carbon-emitting energy sources
with renewables, ensuring renewables growth at a reasonable rate of return. Power purchase agreement (PPA) prices have been increasing
to reflect, and more than offset, higher capital expenditure and financing costs. Additionally, the reappearance of power demand growth
driven by data centers, economic activity and electrification should continue to represent a clear tailwind for the sector. In summary,
we continue to look to identify high quality companies with sound growth prospects and to keep a balance in the portfolio in terms of
risk profiles. We remain positive about the underlying drivers for the space moving into 2025.
Listed energy infrastructure
Performance
Listed
energy infrastructure companies performed exceptionally well during the period, driven by an increased demand outlook for hydrocarbons,
in particular natural gas. Additionally, c-corps significantly outperformed companies structured as MLPs due to a broader investor base.
This robust performance stemmed from several factors. Company management teams demonstrated disciplined capital allocation by maintaining
healthy balance sheets, increasing dividends, opportunistically repurchasing shares, and focusing capital investments exclusively on
high-return projects.
Commentary
Listed
energy infrastructure equities were strong drivers of performance in the TEAF portfolio in fiscal year 2024. Throughout the year, project
opportunities expanded significantly for pipeline companies as expected power demand surged to support the development of data centers
driven by the growing pace of advancements in artificial intelligence. In response, new natural gas pipeline projects were approved to
accommodate the substantial growth in power demand, with natural gas-fired power generation expected to play a critical role. Concerns
over terminal value risks for fossil fuel assets diminished as demand for U.S. liquefied natural gas (LNG) remained strong and the adoption
of electric vehicles slowed. Producers also benefitted from this dynamic along with improved drilling efficiencies that offset lower
energy commodity prices. Energy credit markets strengthened following continued balance sheet improvement and a constructive commodity
supply and demand backdrop. In sum, for energy companies, cash flow growth accelerated with expectations for prolonged durability. Finally,
growing demand for plastics is supportive of resilient demand for oil products. We expect this environment to continue to be supportive
of returns into 2025.
(unaudited)
Tortoise
Sustainable
and Social Impact Term Fund (TEAF) (continued)
Social infrastructure
TEAF
completed eight direct investments in the social impact portfolio during the period.
| ● |
Dublin Classical Academy (“Dublin”)
is a new, public charter school in Dublin, Ohio, just outside of Columbus, that opened in fall of 2024. The school utilizes the Hillsdale
Classical Curriculum. It was expected to serve 462 students in grades K-6 in its inaugural year, with a plan to grow by one grade
each year until it reaches grades K-12. Only grades K-8 are contemplated in this phase of the project, with the building’s
capacity at 700 students. The school’s charter is authorized by St. Aloysius, with an initial charter term of five years. Dublin’s
chosen school site is in the northwest suburbs of Columbus, where there is only one school of choice within five miles, and it does
not offer a classical curriculum. Dublin is the first no-cost classical school in the area. The school board and leader/ principal
are highly experienced with deep ties to the community. The senior bond investment was used to acquire, renovate, and equip an existing
building, while also providing operating capital for the startup of the school. |
| |
|
| ● |
Celebration Senior Living of Denison
(“Celebration” or “Denison”), a not-for-profit corporation, acquired a stabilized senior living facility
in Denison, Texas (north of Dallas). The facility has 82 units consisting of 66 assisted living units and 16 memory care units. The
building was constructed in 2019 and is well-appointed and modern in design and finishes. Denison has been managed by Restoration
Senior Living, LLC since opening in late 2019, which will continue to manage the community following the acquisition. The Manager
also operates numerous other senior living communities in Texas, Louisiana, South Carolina, Georgia, and Florida, and has over 25
years of management experience. The investment was used for subordinated secured bond financing which, combined with senior debt
and deeply subordinated junior debt, allowed for the acquisition of the operating facility and funding of multiple reserve funds,
including a working capital reserve, liquidity support fund, and a debt service reserve fund specific to these subordinated bonds.
The liquidity support fund is further enhanced by personal guarantees. |
| |
|
| ● |
Northeast Ohio Classical Academy (“NEOCA”)
is a new, public charter school in Akron, Ohio that opened in fall of 2024. The school utilizes the Hillsdale Classical Curriculum.
It was expected to serve 350 students in grades K-5 in its inaugural year, with a plan to grow by one grade each year until it reaches
grades K-12. Only grades K-7 are contemplated in this phase of the project, with the building’s capacity at 500 students. The
school’s charter is authorized by St. Aloysius, with an initial charter term of five years. NEOCA’s chosen school site
is in the very northwest corner of Akron, where there are no schools of choice within five miles. NEOCA is the first no-cost classical
school in the area. The school board and leader/principal are highly experienced with deep ties to the community. The senior secured
bond investment was used to acquire, renovate, and equip an existing building. |
| |
|
| ● |
Jacaranda Trace Senior Living (“Jac
Trace”), a not-for-profit corporation, is an existing Continuing Care Retirement Community (CCRC) located in Venice, Florida
with a total of 491 living units. There are 436 independent living, 19 assisted living, and 36 memory care units. Prior to this financing,
141 of the IL units were owned independently by the residents of those units. Since the current ownership acquired the property in
2022 (for which management provided subordinated bond financing), it has planned to acquire those independently owned units as they
become available. The company used existing cash on hand to acquire 6 villas for renovation and redeployment as part of its standard
offering. Since acquisition, the property has continued to perform reasonably well, with occupancy near 90% and on track to meet
all debt covenants. The investment was used for subordinated secured bond financing which will allow for the acquisition of the six
villas and the funding of a reserve fund specific to these subordinated bonds. |
| |
|
| ● |
Belton Preparatory Academy is an existing
charter school located in Belton, South Carolina that has been operating since 2018 in a temporary location while it seeks its permanent
home. Belton Prep offers a classical education curriculum to an underserved population, with great success--as it was recognized
as the top academic Title 1 school in the state of South Carolina. The school previously served approximately 250 students in grades
K-6 and expanded to serve K-8 while increasing enrollment over the next 4 years to reach nearly 700 students enrolled. The investment
was used to finish construction and equipping of the building, which allowed the school to move in this past Fall. |
(unaudited)
2024 Annual
Report | November 30, 2024
Tortoise
Sustainable
and Social Impact Term Fund (TEAF) (continued)
| ● |
City View Charter School is an existing charter school located in in Hillsboro, Oregon (outside of
Portland), which was looking to consolidate its operations from two leased facilities into a singular, permanent school campus by the
end of 2023. The school has been in operation since 2004, and previously served approximately 315 students in grades K-8. The school
is the authorizer’s first and only charter school program. CVCS uses the Expeditionary Learning (“EL”) Education
instructional learning model, a unique approach to hands-on, project-based education which has helped the school outperform its local
school district as well as the state in ELL, Math, and Science. The demand for the program is evident, as the school has maintained
an average waitlist of 280 students for the past 13 years. The senior secured bond investment was used to acquire, renovate, and equip
an existing building. The school began using a portion of the building immediately for its middle school, with the remaining students
moving in once renovations are complete later in the school year. |
| |
|
| ● |
Pioneer Technology and Arts Academy of Arizona (“PTAAA”), a not-for-profit corporation,
acquired an existing, operational K-8 charter school in Phoenix, Arizona. The management company took over operation of the school
during the 2022-2023 school year and has shown improved educational outcomes and increased enrollment during that time. The management
company operates multiple schools in three states using the PTAA model, two of which were previously financed by Tortoise, with all
of the other schools demonstrating academic, financial, and operational success. The investment was used for senior secured bond financing
which allowed for the acquisition of the operating facilities, minor upgrades to equipment, furniture, and HVAC, and to cover the financing
costs and some past operational expenses. The management company provided a $500,000 reserve as collateral, in addition to the first
lien secured interest in the facility and capitalized interest fund. |
| |
|
| ● |
Ivy Classical Academy (“Ivy”) is a new, public charter school in Prattville, Alabama that
opened in late August 2024. In its first year, it is serving approximately 640 students in grades K-5 and will grow by one grade each
year until it becomes a K-12 program. Only grades K-8 are contemplated in the initial financing, as the capacity of the two buildings
will be capped at around 950 students. An additional building(s) will be needed to add grades 9-12, and the school already has an option
to purchase adjacent buildings. The school’s charter is authorized by Elmore County School District, with an initial charter
term of 5 years. The property is about a 15-minute drive northwest of Montgomery and located directly west of Interstate 65 and north
of Highway 82, making it easily accessible – especially for families traveling outside of Prattville. There are no schools of
choice within five miles of the school. Ivy Classical is the first no-cost classical school in the area. Prior to opening, the school
had 899 enrollment applicants, which is approximately 260 students in excess of its first-year enrollment cap. The school is managed
by American Classical Education Foundation, which has close ties with Hillsdale College, one of the strongest sources of resources
for classical education. The senior secured bond financing was used to acquire and renovate two existing buildings, equip classrooms,
and provide capitalized interest during ramp-up. ACE Foundation also contributed a $300,000 debt service reserve fund as additional
security. |
Finally,
the fund had four realizations in fiscal year 2024.
| ● |
The first realization was in November
from a senior living project that raised additional equity to pay off a tranche of subordinated debt. The original investment was
made in September 2020 to acquire an existing senior living facility as part of a capital stack that included senior bank debt and
two tranches of subordinated bonds. The sponsor determined that the property would be better served with additional equity rather
than the Series B subordinated debt which had a 16% coupon. In return for allowing the Series B debt to be paid off, the fund received
all accrued and capitalized interest as well as a price of $103. The fund still holds Series A subordinated debt and received a consent
fee for allowing the Series B payoff. The facility continues to perform as expected. |
| |
|
| ● |
The second was in April from a waste-to-energy
facility in North Carolina that was able to successfully complete construction and achieve commercial operations. To improve its
cash flow and obtain additional capital for further expansion, the project obtained take-out and expansion financing. The investment
was allowed to be called early at a price of $108. |
| |
|
| ● |
The third in April, was a charter school
that had management and operations problems, ultimately resulting in the school having to sell the property to partially repay the
investment. |
| |
|
| ● |
The last realization, in July, was a
water treatment company that was able to grow sufficiently to achieve a sale, which allowed for the full payoff of the debt investment
at a price of $103. |
(unaudited)
Tortoise
Sustainable
and Social Impact Term Fund (TEAF) (continued)
Private energy infrastructure
No
deals were completed in the Private Energy Infrastructure portfolio during the period. The fund remains invested in MPL, a 15 million
metric tonnes per annum (mmtpa) LNG development project focused on bringing Permian sourced gas to the west coast of Mexico for export
to Asian markets. Additionally, the fund has a preferred equity investment in renewable electricity provider, One Energy, providing behind
the meter solutions for industrial customers.
Private sustainable infrastructure
One
Energy filed a S-1 filing under the name One Power Company on November 12, 2024, with Stifel Nicolaus as the lead underwriter. The company
hopes to complete an initial public offering in the first half of 2025.
TEAF’s
investment in EF WWW Holdings, LLC, the debt funding of World Water Works Holdings, Inc., was paid in full on July 5, 2024.
Energy
production at various operating distributed generation (“DG”) solar assets in the Renewable Holdco I, LLC portfolio have
underperformed expectations, primarily caused by inverter issues, certain communications equipment failures (inherent in the age of the
assets) and have required corrective maintenance attention.
Five
small rooftop projects in Puerto Rico within this portfolio are expected to be reenergized in Q1 2025 after experiencing downtime related
to required corrective maintenance. Management has engaged a new O&M provider for these assets and complete several repairs in the
last half of 2024.
Energy
production at the operating DG solar assets in the Renewable Holdco II, LLC portfolio continue to generate stable cash flow as expected.
The final solar project under construction, held in Renewable Holdco, LLC, experienced delays due to interconnection redesign, additional
permitting and road construction caused by the utility. We have completed the necessary road construction and hope to have the power
lines installed weather permitting in early 2025.
For
TEAFs solar asset, Saturn Solar Bermuda 1, Ltd., the construction note continues to pay its annualized interest rate of 10.0% on time
and was extended to December 31, 2025, after a paydown of $1.01 million in December of 2024. The note has remained in place as the owner
of the solar facility is seeking to sell the solar project to a new long-term owner/operator.
2024 fiscal year summary
| Monthly distributions paid per share |
$0.0900 |
| Quarterly distributions paid per share |
$0.2700 |
| Distribution rate (as of 11/30/2024) |
8.5% |
| Year-over-year distribution increase (decrease) |
0.0% |
| Cumulative distributions paid per share to stockholders since inception
in March 2019 |
$5.9705 |
| Market-based total return |
15.28% |
| NAV-based total return |
8.22% |
| Premium (discount) to NAV (as of 11/30/2024) |
(13.8)% |
Performance
data quoted represent past performance; past performance does not guarantee future results. Like any other stock, total return and market
value will fluctuate so that an investment, when sold, may be worth more or less than its original cost. Portfolio composition is subject
to change due to ongoing management of the fund. References to specific securities or sectors should not be construed as a recommendation
by the fund or its adviser. See Schedule of Investments for portfolio weighting at the end of the fiscal quarter.
2024 Annual
Report | November 30, 2024
Tortoise
Sustainable
and Social Impact Term Fund (TEAF) (continued)
Value
of $10,000 vs. Tortoise Sustainable and Social Impact Term Fund – Market (unaudited)
Since inception on March 29, 2019
through November 30, 2024
The
chart assumes an initial investment of $10,000. Performance reflects waivers of fee and operating expenses in effect. In the absence
of such waivers, total return would be reduced. Performance data quoted represents past performance and does not guarantee future results.
Investment returns and principal value will fluctuate, and when sold, may be worth more or less than their original cost. Performance
current to the most recent month-end may be lower or higher than the performance quoted and can be obtained by calling 866-362-9331.
Performance assumes the reinvestment of capital gains and income distributions. The performance does not reflect the deduction of taxes
that a shareholder would pay on Fund distributions or the redemption of Fund shares.
Annualized Rates of Return as of November
30, 2024
| | |
1-Year | |
3-Year | |
5-Year | |
Since
Inception(1) |
| Tortoise Sustainable and Social Impact Term Fund – NAV | |
| 8.22 | % | |
| 3.68 | % | |
| 4.90 | % | |
| 2.78% |
| Tortoise Sustainable and Social Impact Term Fund – Market | |
| 15.28 | % | |
| 3.50 | % | |
| 3.89 | % | |
| -0.23% |
| S&P Global Infrastructure Index | |
| 25.61 | % | |
| 11.05 | % | |
| 7.16 | % | |
| 7.50% |
| (1) |
Inception date of the Fund was March 29, 2019. |
Fund structure and distribution
policy
The
fund is structured to qualify as a Regulated Investment Company (RIC) allowing it to pass-through to shareholders income and capital
gains earned, thus avoiding double-taxation. To qualify as a RIC, the fund must meet specific income, diversification and distribution
requirements. Regarding income, at least 90 percent of the fund gross income must be from dividends, interest and capital gains. The
fund must meet quarterly diversification requirements including the requirement that at least 50 percent of the assets be in cash, cash
equivalents or other securities with each single issuer of other securities not greater than 5 percent of total assets. No more than
25 percent of total assets can be invested in any one issuer other than government securities or other RIC’s. The fund must also
distribute at least 90 percent of its investment company income. RIC’s are also subject to excise tax rules which require RIC’s
to distribute approximately 98 percent of net income and net capital gains to avoid a 4 percent excise tax.
The
fund has adopted a distribution policy which is included on the inside front cover of this report. To summarize, the fund has adopted
a managed distribution policy (“MDP”). Annual distribution amounts are expected to fall in the range of 6% to 8% of the average
week-ending net asset value (“NAV”) per share for the prior fiscal semi-annual period. Distribution amounts will be reset
both up and down to provide a consistent return on trailing NAV. Under the MDP, distribution amounts will normally be reset in February
and August, with no changes in distribution amounts in May and November. The fund may designate a portion of its distributions as capital
gains and may also distribute additional capital gains in the last quarter of the year to meet annual excise distribution requirements.
Distribution amounts are subject to change from time to time at the discretion of the Board.
Leverage
The
fund’s leverage utilization increased $10.6 million during the six months ended Q4 2024, as compared to six months ended Q2 2024.
The fund utilizes all floating rate leverage that had a weighted-average annual rate of 5.62% and represented 13.7% of total assets at
year-end. During the period, the fund maintained compliance with its applicable coverage ratios. The interest rate on the fund’s
leverage will vary in the future along with changing floating rates.
Please
see the Financial Statements and Notes to Financial Statements for additional detail regarding critical accounting policies, results
of operations, leverage and other important fund information.
For
further information regarding the fund’s leverage and distributions to stockholders, as well as a discussion of the tax impact
on distributions, please visit www.tortoiseadvisors.com.
(unaudited)
TEAF Key Financial
Data (supplemental unaudited information)
(dollar amounts in thousands unless otherwise indicated)
The information presented
below is supplemental non-GAAP financial information, is not inclusive of required financial disclosures (e.g. Total Expense Ratio),
and should be read in conjunction with the full financial statements.
| | |
2023 | | |
2024 | |
| | |
Q3(1) | | |
Q4(1) | | |
Q1(1) | | |
Q2(1) | | |
Q3(1) | | |
Q4(1) | |
| Selected Financial Information | |
| | | |
| | | |
| | | |
| | | |
| | | |
| | |
| Distributions paid on common stock | |
$ | 3,643 | | |
$ | 3,643 | | |
$ | 3,643 | | |
$ | 3,643 | | |
$ | 3,643 | | |
$ | 3,643 | |
| Distributions paid on common stock per share. | |
| 0.2700 | | |
| 0.2700 | | |
| 0.2700 | | |
| 0.2700 | | |
| 0.2700 | | |
| 0.2700 | |
| Total assets, end of period | |
| 239,671 | | |
| 225,072 | | |
| 220,254 | | |
| 221,820 | | |
| 227,164 | | |
| 230,350 | |
| Average total assets during period(2) | |
| 241,187 | | |
| 231,121 | | |
| 225,597 | | |
| 218,275 | | |
| 224,160 | | |
| 229,325 | |
| Leverage(3) | |
| 30,600 | | |
| 24,000 | | |
| 23,200 | | |
| 20,900 | | |
| 25,400 | | |
| 31,500 | |
| Leverage as a percent of total assets | |
| 12.8 | % | |
| 10.7 | % | |
| 10.5 | % | |
| 9.4 | % | |
| 11.2 | % | |
| 13.7 | % |
| Operating expenses before leverage costs as a percent of total assets | |
| 1.60 | % | |
| 1.58 | % | |
| 1.64 | % | |
| 1.69 | % | |
| 1.72 | % | |
| 1.99 | % |
| Net unrealized appreciation (depreciation), end of period | |
| (1,168 | ) | |
| (6,150 | ) | |
| (10,314 | ) | |
| (5,042 | ) | |
| (2,235 | ) | |
| (3,155 | ) |
| Net assets, end of period | |
| 208,057 | | |
| 200,258 | | |
| 196,303 | | |
| 200,265 | | |
| 201,021 | | |
| 198,077 | |
| Average net assets during period(4) | |
| 210,656 | | |
| 201,953 | | |
| 199,309 | | |
| 197,990 | | |
| 199,873 | | |
| 200,155 | |
| Net asset value per common share | |
| 15.42 | | |
| 14.84 | | |
| 14.55 | | |
| 14.84 | | |
| 14.90 | | |
| 14.68 | |
| Market value per common share | |
| 12.62 | | |
| 12.01 | | |
| 11.32 | | |
| 11.70 | | |
| 12.31 | | |
| 12.66 | |
| Shares outstanding (000's) | |
| 13,491 | | |
| 13,491 | | |
| 13,491 | | |
| 13,491 | | |
| 13,491 | | |
| 13,491 | |
| (1) |
Q1 represents the period from December
through February. Q2 represents the period from March through May. Q3 represents the period from June through August. Q4 represents
the period from September through November. |
| (2) |
Computed by averaging month-end values
within each period. |
| (3) |
Leverage consists of outstanding borrowings
under the margin loan facility. |
| (4) |
Computed by averaging daily net assets
within each period. |
2024 Annual Report |
November 30, 2024
TYG
Consolidated Schedule of Investments
November
30, 2024
| | |
Shares | |
Fair
Value |
| |
| Common Stocks — 98.7% | |
| | | |
| | |
| Canada Crude Oil Pipelines — 1.1% | |
| | | |
| | |
| Enbridge, Inc. | |
| 118,064 | | |
$ | 5,121,616 | |
| South Bow Corp.(a) | |
| 37,855 | | |
| 986,123 | |
| | |
| | | |
| 6,107,739 | |
| |
| Canada Natural Gas/Natural Gas Liquids Pipelines — 1.7% |
| TC Energy Corp. | |
| 189,277 | | |
| 9,261,323 | |
| |
| United States Crude Oil Pipelines — 3.3% | |
| | | |
| | |
| Plains GP Holdings LP | |
| 923,483 | | |
| 18,488,130 | |
| |
| United States Natural Gas Gathering/Processing — 9.5% |
| Antero Midstream Corp. | |
| 488,403 | | |
| 7,799,796 | |
| EnLink Midstream LLC | |
| 520,687 | | |
| 8,336,199 | |
| Hess Midstream Partners LP | |
| 892,026 | | |
| 33,807,785 | |
| Kinetik Holdings, Inc. | |
| 54,924 | | |
| 3,241,615 | |
| | |
| | | |
| 53,185,395 | |
| |
| United States Natural Gas/Natural Gas Liquids Pipelines — 46.0% |
| Cheniere Energy, Inc. | |
| 127,233 | | |
| 28,501,464 | |
| DT Midstream, Inc. | |
| 114,114 | | |
| 12,109,778 | |
| Excelerate Energy, Inc. | |
| 57,737 | | |
| 1,788,115 | |
| Kinder Morgan, Inc. | |
| 897,060 | | |
| 25,359,886 | |
| New Fortress Energy, Inc. | |
| 176,000 | | |
| 1,877,920 | |
| NextDecade Corp.(a) | |
| 443,864 | | |
| 3,213,576 | |
| ONEOK, Inc. | |
| 511,748 | | |
| 58,134,573 | |
| Targa Resources Corp. | |
| 320,501 | | |
| 65,478,354 | |
| The Williams Companies, Inc. | |
| 1,039,854 | | |
| 60,852,256 | |
| | |
| | | |
| 257,315,922 | |
| |
| United States Renewables and Power Infrastructure — 37.1% |
| AES Corp. | |
| 708,155 | | |
| 9,234,341 | |
| Ameren Corp. | |
| 123,016 | | |
| 11,611,480 | |
| Clearway Energy, Inc. | |
| 865,758 | | |
| 25,531,204 | |
| CMS Energy Corp. | |
| 250,513 | | |
| 17,463,261 | |
| Constellation Energy Corp. | |
| 128,494 | | |
| 32,966,421 | |
| DTE Energy Co. | |
| 73,030 | | |
| 9,185,713 | |
| NextEra Energy, Inc. | |
| 254,977 | | |
| 20,059,041 | |
| Sempra Energy | |
| 516,045 | | |
| 48,337,935 | |
| Vistra Corp. | |
| 207,700 | | |
| 33,198,768 | |
| | |
| | | |
| 207,588,164 | |
Total Common Stocks
(Cost $559,804,563) | |
| | | |
| 551,946,673 | |
| | |
Shares/Units | |
Fair
Value |
| |
| Master Limited Partnerships — 23.9% | |
|
| United States Natural Gas Gathering/Processing — 4.9% |
| Western Midstream Partners LP | |
| 672,334 | | |
$ | 27,370,717 | |
| |
| United States Natural Gas/Natural Gas Liquids Pipelines — 10.2% |
| Energy Transfer LP | |
| 1,779,085 | | |
| 35,332,628 | |
| Enterprise Products Partners LP | |
| 634,513 | | |
| 21,846,283 | |
| | |
| | | |
| 57,178,911 | |
| |
| United States Refined Product Pipelines — 8.8% | |
| | | |
| | |
| MPLX LP | |
| 947,355 | | |
| 48,940,359 | |
Total Master Limited Partnerships
(Cost $60,060,188) |
|
|
|
|
|
|
133,489,987 |
|
| |
| Private Investments — 0.4% | |
| | | |
| | |
| United States Renewables — 0.4% | |
| | | |
| | |
| TK NYS Solar Holdco LLC(b)(c)(d) | |
| N/A | | |
| 2,444,516 | |
Total Private Investments
(Cost $51,041,470) | |
| | | |
| 2,444,516 | |
| |
| Short-Term Investments — 0.1% | |
| | | |
| | |
| Money Market Funds — 0.1% | |
| | | |
| | |
| Invesco Government & Agency Portfolio — Class Institutional | |
| 288,521 | | |
| 288,521 | |
Total Short-Term Investments
(Cost $288,521) | |
| | | |
| 288,521 | |
| |
Total Investments — 123.1%
(Cost $671,194,742) | |
| | | |
| 688,169,697 | |
| Liabilities in Excess of Other Assets — (0.3)% | |
| | | |
| (1,637,011 | ) |
| Credit Facility Borrowings — (7.4)% | |
| | | |
| (41,200,000 | ) |
| Senior Notes — (9.0)% | |
| | | |
| (50,333,333 | ) |
| Mandatory Redeemable Preferred Stock at Liquidation Value — (6.4)% | |
| | | |
| (35,660,610 | ) |
| Total Net Assets — 100.0% | |
| | | |
$ | 559,338,743 | |
Percentages are stated as a percent of net assets.
| (a) | Non-income producing security. |
| (b) | Fair value determined using significant unobservable
inputs in accordance with procedures established by and under the supervision of the Adviser,
acting as Valuation Designee.
These securities represented $2,444,516 or 0.4% of net assets as of November 30, 2024. |
| (c) | Deemed
to be an affiliate of the fund. |
| (d) | Restricted
securities have a total fair value of $2,444,516 which represents 0.4% of net assets |
See accompanying
Notes to Financial Statements.
NTG
Schedule of Investments
November
30, 2024
| | |
Shares | |
Fair
Value |
| |
| Common Stocks — 93.2% | |
| | | |
| | |
| Canada Crude Oil Pipelines — 9.2% | |
| | | |
| | |
| Enbridge, Inc. | |
| 402,939 | | |
$ | 17,479,494 | |
| Pembina Pipeline Corp. | |
| 278,903 | | |
| 11,538,217 | |
| South Bow Corp.(a) | |
| 84,111 | | |
| 2,191,092 | |
| | |
| | | |
| 31,208,803 | |
| |
| Canada Natural Gas/Natural Gas Liquids Pipelines — 5.0% |
| TC Energy Corp. | |
| 349,179 | | |
| 17,085,328 | |
| |
| United States Crude Oil Pipelines — 7.8% | |
| | | |
| | |
| Plains GP Holdings LP | |
| 1,315,066 | | |
| 26,327,621 | |
| |
| United States Natural Gas Gathering/Processing — 8.7% |
| EnLink Midstream LLC | |
| 438,604 | | |
| 7,022,050 | |
| Hess Midstream Partners LP — Class A | |
| 517,111 | | |
| 19,598,507 | |
| Kinetik Holdings, Inc. | |
| 46,011 | | |
| 2,715,569 | |
| | |
| | | |
| 29,336,126 | |
| |
| United States Natural Gas/Natural Gas Liquids Pipelines — 50.8% |
| Cheniere Energy, Inc. | |
| 71,192 | | |
| 15,947,720 | |
| DT Midstream, Inc. | |
| 179,118 | | |
| 19,008,002 | |
| Excelerate Energy, Inc. — Class A | |
| 70,562 | | |
| 2,185,305 | |
| Kinder Morgan, Inc. | |
| 641,386 | | |
| 18,131,982 | |
| New Fortress Energy, Inc. | |
| 109,719 | | |
| 1,170,702 | |
| NextDecade Corp.(a) | |
| 228,576 | | |
| 1,654,890 | |
| ONEOK, Inc. | |
| 327,155 | | |
| 37,164,808 | |
| Targa Resources Corp. | |
| 186,125 | | |
| 38,025,338 | |
| The Williams Companies, Inc. | |
| 659,531 | | |
| 38,595,754 | |
| | |
| | | |
| 171,884,501 | |
| |
| United States Renewables and Power Infrastructure — 11.7% |
| Clearway Energy, Inc. — Class C | |
| 466,911 | | |
| 13,769,205 | |
| CMS Energy Corp. | |
| 29,808 | | |
| 2,077,916 | |
| NextEra Energy, Inc. | |
| 53,798 | | |
| 4,232,289 | |
| Vistra Corp. | |
| 121,120 | | |
| 19,359,821 | |
| | |
| | | |
| 39,439,231 | |
Total Common Stocks
(Cost $310,758,367) | |
| | | |
| 315,281,610 | |
| | |
| | | |
| | |
| |
|
|
Shares/Units | |
Fair
Value |
| Master Limited Partnerships — 25.7% | |
|
| United States Natural Gas Gathering/Processing — 4.9% |
| Western Midstream Partners LP | |
| 404,307 | | |
$ | 16,459,338 | |
| |
| United States Natural Gas/Natural Gas Liquids Pipelines — 11.2% |
| Energy Transfer LP | |
| 962,003 | | |
| 19,105,380 | |
| Enterprise Products Partners LP | |
| 550,647 | | |
| 18,958,776 | |
| | |
| | | |
| 38,064,156 | |
| |
| United States Refined Product Pipelines — 9.6% | |
| | | |
| | |
| MPLX LP | |
| 630,996 | | |
| 32,597,253 | |
Total Master
Limited Partnerships
(Cost $41,874,157) | |
| | | |
| 87,120,747 | |
| |
| Short-Term Investments — 0.1% | |
| | | |
| | |
| Money Market Funds — 0.1% | |
| | | |
| | |
| First
American Government Obligations Fund — Class X, 4.56%(b) | |
| 349,588 | | |
| 349,588 | |
Total Short-Term
Investments
(Cost $349,588) | |
| | | |
| 349,588 | |
| |
Total
Investments — 119.0%
(Cost $352,982,112) | |
| | | |
| 402,751,945 | |
| Liabilities in Excess of Other Assets — (0.0)% | |
| | | |
| (91,757 | ) |
| Credit Facility Borrowings — (6.3)% | |
| | | |
| (21,200,000 | ) |
| Senior Notes — (8.6)% | |
| | | |
| (29,170,678 | ) |
| Mandatory Redeemable Preferred Stock at Liquidation Value — (4.1)% | |
| | | |
| (13,753,775 | ) |
| Total
Net Assets — 100.0% | |
| | | |
$ | 338,535,735 | |
Percentages
are stated as a percent of net assets.
| (a) | Non-income
producing security. |
| (b) | The rate
shown represents the 7-day annualized effective yield as of November 30, 2024. |
See accompanying
Notes to Financial Statements.
2024 Annual Report |
November 30, 2024
TTP
Schedule of Investments
November
30, 2024
| | |
Shares | |
Fair
Value |
| |
| Common Stocks — 89.8% | |
| | | |
| | |
| Canada Crude Oil Pipelines — 11.7% | |
| | | |
| | |
| Enbridge, Inc. | |
| 133,598 | | |
$ | 5,795,481 | |
| Gibson Energy, Inc. | |
| 50,815 | | |
| 856,928 | |
| Pembina Pipeline Corp. | |
| 124,957 | | |
| 5,148,044 | |
| South Bow Corp.(a) | |
| 22,594 | | |
| 588,574 | |
| | |
| | | |
| 12,389,027 | |
| | |
| | | |
| | |
| Canada Natural Gas/Natural Gas Liquids Pipelines — 7.6% | |
| | | |
| | |
| Keyera Corp. | |
| 78,735 | | |
| 2,596,475 | |
| TC Energy Corp. | |
| 111,259 | | |
| 5,443,903 | |
| | |
| | | |
| 8,040,378 | |
| | |
| | | |
| | |
| United States Crude Oil Pipelines — 9.6% | |
| | | |
| | |
| Plains GP Holdings LP | |
| 508,250 | | |
| 10,175,165 | |
| | |
| | | |
| | |
| United States Natural Gas Gathering/Processing — 7.1% | |
| | | |
| | |
| Antero Midstream Corp. | |
| 172,434 | | |
| 2,753,771 | |
| Hess Midstream Partners LP — Class A | |
| 112,695 | | |
| 4,271,140 | |
| Kinetik Holdings, Inc. | |
| 8,934 | | |
| 527,285 | |
| | |
| | | |
| 7,552,196 | |
| | |
| | | |
| | |
| United States Natural Gas/Natural Gas Liquids Pipelines — 49.6% | |
| | | |
| | |
| Cheniere Energy, Inc. | |
| 25,693 | | |
| 5,755,489 | |
| DT Midstream, Inc. | |
| 27,432 | | |
| 2,911,084 | |
| Excelerate Energy, Inc. — Class A | |
| 8,917 | | |
| 276,159 | |
| Kinder Morgan, Inc. | |
| 344,042 | | |
| 9,726,067 | |
| NextDecade Corp.(a) | |
| 70,953 | | |
| 513,700 | |
| ONEOK, Inc. | |
| 105,725 | | |
| 12,010,360 | |
| Targa Resources Corp. | |
| 45,005 | | |
| 9,194,522 | |
| The Williams Companies, Inc. | |
| 208,329 | | |
| 12,191,413 | |
| | |
| | | |
| 52,578,794 | |
| | |
| | | |
| | |
| United States Renewables and Power Infrastructure — 4.2% | |
| | | |
| | |
| Clearway Energy, Inc. — Class C | |
| 22,000 | | |
| 648,780 | |
| Sempra Energy | |
| 40,198 | | |
| 3,765,347 | |
| | |
| | | |
| 4,414,127 | |
Total Common Stocks
(Cost $52,053,250) | |
| | | |
| 95,149,687 | |
| | |
Units | |
Fair
Value |
| |
| Master Limited Partnerships — 20.6% | |
| | | |
| | |
| United States Natural Gas Gathering/Processing — 3.2% |
| Western Midstream Partners LP | |
| 84,289 | | |
$ | 3,431,405 | |
| |
| United States Natural Gas/Natural Gas Liquids Pipelines — 10.7% |
| Energy Transfer LP | |
| 292,468 | | |
| 5,808,415 | |
| Enterprise Products Partners LP | |
| 161,766 | | |
| 5,569,603 | |
| | |
| | | |
| 11,378,018 | |
| |
| United States Other — 0.1% | |
| | | |
| | |
| Westlake Chemical Partners LP | |
| 4,940 | | |
| 117,424 | |
| |
| United States Refined Product Pipelines — 6.6% | |
| | | |
| | |
| MPLX LP | |
| 113,530 | | |
| 5,864,960 | |
| Sunoco LP | |
| 19,354 | | |
| 1,092,727 | |
| | |
| | | |
| 6,957,687 | |
Total Master Limited Partnerships
(Cost $7,310,991) |
|
|
|
|
|
|
21,884,534 |
|
| |
Total Investments — 110.4%
(Cost $59,364,241) |
|
|
|
|
|
|
117,034,221 |
|
| Other Assets in Excess of Liabilities — 1.6%% | |
| | | |
| 1,670,280 | |
| Credit Facility Borrowings — (2.5)% | |
| | | |
| (2,700,000 | ) |
| Senior Notes — (3.7)% | |
| | | |
| (3,942,858 | ) |
| Mandatory
Redeemable Preferred Stock at Liquidation Value — (5.8)% |
|
|
|
|
|
|
(6,100,000 |
) |
| Total Net Assets — 100.0% | |
| | | |
$ | 105,961,643 | |
Percentages
are stated as a percent of net assets.
| (a) | Non-income
producing security. |
See accompanying
Notes to Financial Statements.
NDP
Schedule of Investments
November
30, 2024
| | |
Shares | |
Fair
Value |
| |
| Common Stocks — 96.5% | |
| | | |
| | |
| Canada Crude Oil Pipelines — 1.5% | |
| | | |
| | |
| Enbridge, Inc.(b) | |
| 23,865 | | |
$ | 1,035,264 | |
| South Bow Corp.(a) | |
| 3,949 | | |
| 102,871 | |
| | |
| | | |
| 1,138,135 | |
| | |
| | | |
| | |
| Canada Natural Gas/Natural Gas Liquids Pipelines — 1.3% | |
| | | |
| | |
| TC Energy Corp. | |
| 19,745 | | |
| 966,123 | |
| | |
| | | |
| | |
| Canada Oil and Gas Production — 2.1% | |
| | | |
| | |
| Suncor Energy, Inc. | |
| 40,528 | | |
| 1,600,045 | |
| | |
| | | |
| | |
| United States Natural Gas Gathering/Processing — 4.7% | |
| | | |
| | |
| Kinetik Holdings, Inc.(b) | |
| 5,678 | | |
| 335,115 | |
| Kodiak Gas Services, Inc.(b) | |
| 79,293 | | |
| 3,206,609 | |
| | |
| | | |
| 3,541,724 | |
| | |
| | | |
| | |
| United States Natural Gas/Natural Gas Liquids Pipelines — 30.2% | |
| | | |
| | |
| Cheniere Energy, Inc.(b) | |
| 37,456 | | |
| 8,390,519 | |
| Excelerate Energy, Inc. — Class A(b) | |
| 6,209 | | |
| 192,293 | |
| Kinder Morgan, Inc.(b) | |
| 56,165 | | |
| 1,587,784 | |
| NextDecade Corp.(a) | |
| 55,204 | | |
| 399,677 | |
| ONEOK, Inc. | |
| 19,585 | | |
| 2,224,856 | |
| Targa Resources Corp. | |
| 37,880 | | |
| 7,738,884 | |
| The Williams Companies, Inc. | |
| 36,175 | | |
| 2,116,961 | |
| | |
| | | |
| 22,650,974 | |
| | |
| | | |
| | |
| United States Oil and Gas Production — 51.2% | |
| | | |
| | |
| Chevron Corp.(b) | |
| 18,828 | | |
| 3,048,818 | |
| ConocoPhillips(b) | |
| 36,281 | | |
| 3,930,680 | |
| Coterra Energy, Inc.(b) | |
| 91,147 | | |
| 2,435,448 | |
| Devon Energy Corp.(b) | |
| 82,861 | | |
| 3,144,575 | |
| Diamondback Energy, Inc. | |
| 37,179 | | |
| 6,602,619 | |
| EOG Resources, Inc.(b) | |
| 29,520 | | |
| 3,933,835 | |
| EQT Corp.(b) | |
| 117,402 | | |
| 5,334,747 | |
| Exxon Mobil Corp.(b) | |
| 58,830 | | |
| 6,939,587 | |
| Occidental Petroleum Corp. | |
| 60,421 | | |
| 3,056,094 | |
| | |
| | | |
| 38,426,403 | |
| | |
| | | |
| | |
| United States Other — 2.4% | |
| | | |
| | |
| Baker Hughes Co.(b) | |
| 38,763 | | |
| 1,703,634 | |
| Darling Ingredients, Inc.(a)(b) | |
| 1,957 | | |
| 79,317 | |
| | |
| | | |
| 1,782,951 | |
| | |
| | | |
| | |
| United States Renewables and Power Infrastructure — 3.1% | |
| | | |
| | |
| American Electric Power Co., Inc.(b) | |
| 2,921 | | |
| 291,691 | |
| Constellation Energy Corp.(b) | |
| 8,071 | | |
| 2,070,696 | |
| | |
| | | |
| 2,362,387 | |
Total Common Stocks
(Cost $36,538,592) | |
| | | |
| 72,468,742 | |
| | |
Units | |
Fair Value |
| |
| Master Limited Partnerships — 18.4% | |
| | | |
| | |
| United States Natural Gas Gathering/Processing — 3.9% | |
| | | |
| | |
| Western Midstream Partners LP | |
| 72,535 | | |
$ | 2,952,900 | |
| | |
| | | |
| | |
| United States Natural Gas/Natural Gas Liquids Pipelines — 8.2% | |
| | | |
| | |
| Energy Transfer LP(b) | |
| 293,256 | | |
| 5,824,064 | |
| Enterprise Products Partners LP(b) | |
| 9,664 | | |
| 332,732 | |
| | |
| | | |
| 6,156,796 | |
| | |
| | | |
| | |
| United States Oil and Gas Production — 1.7% | |
| | | |
| | |
| Mach Natural Resources LP(b) | |
| 26,315 | | |
| 409,988 | |
| TXO Partners LP | |
| 50,000 | | |
| 887,000 | |
| | |
| | | |
| 1,296,988 | |
| | |
| | | |
| | |
| United States Refined Product Pipelines — 4.6% | |
| | | |
| | |
| MPLX LP(b) | |
| 66,440 | | |
| 3,432,290 | |
Total Master Limited Partnerships
(Cost $6,911,400) | |
| | | |
| 13,838,974 | |
| | |
| | | |
| | |
Total Investments — 114.9%
(Cost $43,449,992) | |
| | | |
| 86,307,716 | |
| Other Assets in Excess of Liabilities — 0.5% | |
| | | |
| 400,707 | |
| Credit Facility Borrowings — (15.4)% | |
| | | |
| (11,600,000 | ) |
| Total Net Assets — 100.0% | |
| | | |
$ | 75,108,423 | |
Percentages are stated as a percent of net assets.
| (a) | Non-income producing security. |
| (b) | All or a portion of the security is segregated as collateral for the margin borrowing facility. |
See accompanying Notes to Financial Statements.
2024 Annual Report | November 30, 2024
TPZ
Schedule of Investments
November
30, 2024
| | |
Principal Amount | |
Fair
Value |
| |
| Corporate Bonds — 47.9% | |
| | | |
| | |
| Canada Crude Oil Pipelines — 5.4% | |
| | | |
| | |
| Enbridge, Inc., | |
| | | |
| | |
| 5.50% to 07/15/2027 then | |
| | | |
| | |
| 3 mo. Term SOFR + 3.68%, 07/15/2077(d) | |
$ | 7,042,000 | | |
$ | 6,816,200 | |
| | |
| | | |
| | |
| United States Natural Gas Gathering/Processing — 16.2% | |
| | | |
| | |
Antero Midstream Partners LP,
5.75%, 03/01/2027(a) | |
| 3,800,000 | | |
| 3,792,181 | |
Blue Racer Midstream LLC,
6.63%, 07/15/2026(a) | |
| 2,950,000 | | |
| 2,948,971 | |
EnLink Midstream LLC,
6.50%, 09/01/2030(a) | |
| 4,900,000 | | |
| 5,208,408 | |
Hess Corp.,
5.63%, 02/15/2026(a) | |
| 4,160,000 | | |
| 4,154,789 | |
Kodiak Gas Services LLC,
7.25%, 02/15/2029(a) | |
| 4,000,000 | | |
| 4,134,852 | |
| | |
| | | |
| 20,239,201 | |
| | |
| | | |
| | |
| United States Natural Gas/Natural Gas Liquids Pipelines — 16.3% | |
| | | |
| | |
Cheniere Energy, Inc.,
4.63%, 10/15/2028(d) | |
| 3,100,000 | | |
| 3,063,962 | |
NGPL PipeCo LLC,
3.25%, 07/15/2031(a) | |
| 3,500,000 | | |
| 3,067,279 | |
ONEOK, Inc.,
6.35%, 01/15/2031(d) | |
| 3,000,000 | | |
| 3,212,364 | |
Tallgrass Energy LP,
5.50%, 01/15/2028(a) | |
| 3,250,000 | | |
| 3,160,722 | |
Targa Resources Corp.,
5.20%, 07/01/2027(d) | |
| 4,000,000 | | |
| 4,050,399 | |
Venture Global LNG, Inc.,
9.88%, 02/01/2032(a) | |
| 3,500,000 | | |
| 3,892,084 | |
| | |
| | | |
| 20,446,810 | |
| | |
| | | |
| | |
| United States Other — 3.7% | |
| | | |
| | |
New Fortress Energy, Inc.,
6.50%, 09/30/2026(a) | |
| 5,000,000 | | |
| 4,664,967 | |
| | |
| | | |
| | |
| United States Refined Product Pipelines — 1.4% | |
| | | |
| | |
Buckeye Partners LP,
5.85%, 11/15/2043(d) | |
| 2,000,000 | | |
| 1,765,978 | |
| | |
| | | |
| | |
| United States Renewables and Power Infrastructure — 4.9% | |
| | | |
| | |
| NextEra Energy, Inc., | |
| | | |
| | |
| 4.80% to 12/01/2027 then | |
| | | |
| | |
| 3 mo. LIBOR US + 2.41%, 12/01/2077(b)(d) | |
| 4,500,000 | | |
| 4,335,422 | |
Vistra Corp.,
7.75%, 10/15/2031(a) | |
| 1,700,000 | | |
| 1,805,566 | |
| | |
| | | |
| 6,140,988 | |
Total Corporate Bonds
(Cost $60,032,320) | |
| | | |
| 60,074,144 | |
| | |
Shares | |
Fair
Value |
| |
| Common Stocks — 46.7% | |
| | | |
| | |
| Canada Crude Oil Pipelines — 1.6% | |
| | | |
| | |
| Enbridge, Inc.(d) | |
| 39,056 | | |
$ | 1,694,249 | |
| South Bow Corp.(c) | |
| 9,733 | | |
| 253,545 | |
| | |
| | | |
| 1,947,794 | |
| |
| Canada Natural Gas/Natural Gas Liquids Pipelines — 1.9% |
| TC Energy Corp. | |
| 48,667 | | |
| 2,381,276 | |
| |
| United States Crude Oil Pipelines — 5.7% | |
| | | |
| | |
| Plains GP Holdings LP(d) | |
| 358,745 | | |
| 7,182,075 | |
| |
| United States Natural Gas Gathering/Processing — 3.8% |
| EnLink Midstream LLC(d) | |
| 90,965 | | |
| 1,456,350 | |
| Hess Midstream Partners LP — Class A | |
| 66,901 | | |
| 2,535,548 | |
| Kinetik Holdings, Inc.(d) | |
| 11,954 | | |
| 705,525 | |
| | |
| | | |
| 4,697,423 | |
| |
| United States Natural Gas/Natural Gas Liquids Pipelines — 30.7% |
| DT Midstream, Inc.(d) | |
| 24,885 | | |
| 2,640,796 | |
| Excelerate Energy, Inc. — Class A | |
| 11,787 | | |
| 365,043 | |
| Kinder Morgan, Inc.(d) | |
| 160,775 | | |
| 4,545,109 | |
| NextDecade Corp.(c)(d) | |
| 98,612 | | |
| 713,951 | |
| ONEOK, Inc.(d) | |
| 73,551 | | |
| 8,355,394 | |
| Targa Resources Corp.(d) | |
| 63,653 | | |
| 13,004,308 | |
| The Williams Companies, Inc.(d) | |
| 152,520 | | |
| 8,925,470 | |
| | |
| | | |
| 38,550,071 | |
| |
| United States Refining — 0.2% | |
| | | |
| | |
| PBF Energy, Inc. — Class A | |
| 8,275 | | |
| 260,580 | |
| |
| United States Renewables and Power Infrastructure — 2.8% |
| Clearway Energy, Inc. — Class C | |
| 13,342 | | |
| 393,456 | |
| Sempra Energy | |
| 33,854 | | |
| 3,171,104 | |
| | |
| | | |
| 3,564,560 | |
Total Common Stocks
(Cost $27,720,674) |
|
|
|
|
|
|
58,583,779 |
|
See accompanying Notes to Financial Statements.
TPZ
Schedule of Investments (continued)
November
30, 2024
| | |
Units | |
Fair
Value |
| Master Limited Partnerships — 24.9% | |
| | | |
| | |
| United States Natural Gas Gathering/Processing — 4.4% |
| Western Midstream Partners LP | |
| 135,715 | | |
$ | 5,524,958 | |
| | |
| | | |
| | |
| United States Natural Gas/Natural Gas Liquids Pipelines — 11.8% |
| Energy Transfer LP(d) | |
| 425,604 | | |
| 8,452,495 | |
| Enterprise Products Partners LP | |
| 184,023 | | |
| 6,335,912 | |
| | |
| | | |
| 14,788,407 | |
| United States Refined Product Pipelines — 8.7% | |
| | | |
| | |
| MPLX LP(d) | |
| 170,962 | | |
| 8,831,897 | |
| Sunoco LP(d) | |
| 36,274 | | |
| 2,048,030 | |
| | |
| | | |
| 10,879,927 | |
Total Master Limited Partnerships
(Cost $11,075,824) |
|
|
|
|
|
|
31,193,292 |
|
Total Investments — 119.5%
(Cost $98,828,818) |
|
$ |
149,851,215 |
|
| Other Assets in Excess of Liabilities — 0.8% | |
| 1,037,401 | |
| Credit Facility Borrowing — (20.3)% | |
| (25,500,000 | ) |
| Total Net Assets — 100.0% | |
$ | 125,388,616 | |
Percentages are stated as a percent of net assets.
LIBOR – London Interbank Offered Rate
SOFR – Secured Overnight Financing Rate
| (a) | Security is exempt from registration pursuant to Rule 144A under the Securities Act of 1933, as amended. These securities may only
be resold in transactions exempt from registration to qualified institutional investors. As of November 30, 2024, the value of these securities
total $36,829,819 or 29.4% of the Fund’s net assets. |
| (b) | Securities referencing LIBOR are expected to transition to an alternative reference rate by the security’s next scheduled coupon
reset date. |
| (c) | Non-income producing security. |
| (d) | All or a portion of the security is segregated as collateral for the margin borrowing facility. |
See accompanying Notes to Financial Statements.
2024 Annual Report |
November 30, 2024
TEAF
Consolidated Schedule of Investments
November
30, 2024
| | |
Shares | |
Fair
Value |
| |
| Common Stocks — 49.5% | |
| | | |
| | |
| Australia Other — 1.6% | |
| | | |
| | |
| Atlas Arteria Ltd. | |
| 992,726 | | |
$ | 3,108,036 | |
| |
| Canada Renewables — 0.9% | |
| | | |
| | |
| Innergex Renewable Energy, Inc.(a) | |
| 294,405 | | |
| 1,835,760 | |
| |
| France Other — 1.0% | |
| | | |
| | |
| Vinci SA(a) | |
| 18,830 | | |
| 1,987,069 | |
| |
| France Power — 0.6% | |
| | | |
| | |
| Engie SA(a) | |
| 70,301 | | |
| 1,120,671 | |
| |
| France Water Infrastructure — 0.8% | |
| | | |
| | |
| Veolia Environnement SA | |
| 52,591 | | |
| 1,532,214 | |
| |
| Germany Power — 2.9% | |
| | | |
| | |
| E.ON SE | |
| 226,946 | | |
| 2,922,263 | |
| RWE AG(a) | |
| 85,251 | | |
| 2,871,129 | |
| | |
| | | |
| 5,793,392 | |
| |
| Hong Kong Solar — 0.3% | |
| | | |
| | |
| Xinyi Energy Holdings Ltd. | |
| 4,755,664 | | |
| 489,014 | |
| |
| Hong Kong Transportation/Storage — 0.8% | |
| | | |
| | |
China Suntien Green Energy
Corp. Ltd. — Class H |
|
|
3,704,242 |
|
|
|
1,614,059 |
|
| |
| Italy Power — 6.6% | |
| | | |
| | |
| ENAV SpA(a) | |
| 862,491 | | |
| 3,718,655 | |
| Enel SpA | |
| 512,946 | | |
| 3,691,390 | |
| Iren SpA | |
| 1,215,003 | | |
| 2,538,372 | |
| Terna SpA | |
| 377,556 | | |
| 3,195,042 | |
| | |
| | | |
| 13,143,459 | |
| |
| Portugal Power — 1.6% | |
| | | |
| | |
| EDP — Energias de Portugal SA(a) | |
| 902,432 | | |
| 3,263,365 | |
| |
| Spain Other — 2.0% | |
| | | |
| | |
| Ferrovial SE(a) | |
| 93,777 | | |
| 3,866,827 | |
| |
| Spain Power — 1.4% | |
| | | |
| | |
| Iberdrola SA(a) | |
| 200,921 | | |
| 2,864,234 | |
| Switzerland Infrastructure, Utilities, and Renewables — 1.2% |
| BKW AG | |
| 13,987 | | |
| 2,403,805 | |
| |
| United Kingdom Power — 4.7% | |
| | | |
| | |
| National Grid Plc(a) | |
| 300,253 | | |
| 3,792,275 | |
| SSE Plc(a) | |
| 245,414 | | |
| 5,531,956 | |
| | |
| | | |
| 9,324,231 | |
| |
| United Kingdom Renewable Infrastructure — 0.6% | |
| | | |
| | |
| Greencoat UK Wind Plc(a) | |
| 703,747 | | |
| 1,130,988 | |
| |
| United States Natural Gas/Natural Gas Liquids Pipelines — 7.6% |
| Cheniere Energy, Inc.(a) | |
| 15,047 | | |
| 3,370,678 | |
| NextDecade Corp.(b) | |
| 75,000 | | |
| 543,000 | |
| Targa Resources Corp.(a) | |
| 29,709 | | |
| 6,069,549 | |
| The Williams Companies, Inc.(a) | |
| 85,577 | | |
| 5,007,966 | |
| | |
| | | |
| 14,991,193 | |
| |
| United States Other — 0.7% | |
| | | |
| | |
| Waste Management, Inc. | |
| 6,418 | | |
| 1,464,716 | |
| |
| United States Power — 9.1% | |
| | | |
| | |
| Ameren Corp.(a) | |
| 20,040 | | |
| 1,891,576 | |
| American Electric Power Co., Inc.(a) | |
| 34,023 | | |
| 3,397,537 | |
| Atlantica Sustainable Infrastructure Plc(a) | |
| 111,711 | | |
| 2,450,939 | |
| Edison International(a) | |
| 22,360 | | |
| 1,962,090 | |
| Exelon Corp.(a) | |
| 56,926 | | |
| 2,251,992 | |
| Vistra Corp. | |
| 38,265 | | |
| 6,116,278 | |
| | |
| | | |
| 18,070,412 | |
| |
| United States Renewables — 3.9% | |
| | | |
| | |
| Dominion Energy, Inc.(a) | |
| 33,653 | | |
| 1,977,114 | |
| Montana Technologies Corp.(b) | |
| 118,434 | | |
| 903,651 | |
| NextEra Energy Partners LP(a) | |
| 80,874 | | |
| 1,412,869 | |
| NextEra Energy, Inc.(a) | |
| 43,338 | | |
| 3,409,400 | |
| | |
| | | |
| 7,703,034 | |
| |
| United States Utilities — 1.2% | |
| | | |
| | |
| Essential Utilities, Inc.(a) | |
| 58,349 | | |
| 2,335,710 | |
Total Common Stocks
(Cost $93,451,103) | |
| | | |
| 98,042,189 | |
See accompanying Notes to Financial Statements.
Tortoise
TEAF
Consolidated Schedule of Investments (continued)
November
30, 2024
| | |
Principal Amount | |
Fair
Value |
| |
| Municipal Bonds — 27.1% | |
| | | |
| | |
| Arizona — 4.2% | |
| | | |
| | |
| Maricopa County Industrial Development Authority | |
| | | |
| | |
| 11.00%, 07/01/2033 | |
$ | 138,000 | | |
$ | 134,533 | |
| 8.10%, 06/15/2034(c) | |
| 8,200,000 | | |
| 7,909,973 | |
| 12.00%, 06/15/2034(c) | |
| 250,000 | | |
| 253,894 | |
| | |
| | | |
| 8,298,400 | |
| |
| Florida — 1.9% | |
| | | |
| | |
| Florida Development Finance Corp. | |
| | | |
| | |
| 10.00%, 07/01/2025(c) | |
| 445,000 | | |
| 422,750 | |
| 11.00%, 08/01/2032(c) | |
| 320,000 | | |
| 317,772 | |
| 10.25%, 11/01/2057 | |
| 3,110,000 | | |
| 3,043,443 | |
| | |
| | | |
| 3,783,965 | |
| |
| Ohio — 3.4% | |
| | | |
| | |
| Public Finance Authority | |
| | | |
| | |
| 12.00%, 03/15/2034(c) | |
| 1,560,000 | | |
| 1,591,640 | |
| 8.35%, 06/15/2034(c) | |
| 5,355,000 | | |
| 5,248,854 | |
| | |
| | | |
| 6,840,494 | |
| |
| Oregon — 2.1% | |
| | | |
| | |
| Oregon State Facilities Authority | |
| | | |
| | |
| 8.00%, 12/15/2053(d) | |
| 3,100,000 | | |
| 3,167,401 | |
| 12.00%, 12/15/2053(e) | |
| 950,000 | | |
| 971,039 | |
| | |
| | | |
| 4,138,440 | |
| |
| Pennsylvania — 0.2% | |
| | | |
| | |
| Pennsylvania Economic Development | |
| | | |
| | |
| Financing Authority, | |
| | | |
| | |
| 14.00%, 12/01/2027(c) | |
| 375,000 | | |
| 377,692 | |
| |
| South Carolina — 4.4% | |
| | | |
| | |
| South Carolina Jobs-Economic Development Authority | |
| | | |
| | |
| 7.50%, 03/15/2030(c)(d) | |
| 3,850,000 | | |
| 3,803,624 | |
| 11.00%, 03/15/2030(c)(e) | |
| 575,000 | | |
| 582,710 | |
| 7.60%, 03/15/2033(c) | |
| 4,080,000 | | |
| 4,020,970 | |
| 11.00%, 03/15/2033(c) | |
| 375,000 | | |
| 368,873 | |
| | |
| | | |
| 8,776,177 | |
| | |
Principal
Amount/
Shares | |
Fair
Value |
| |
| Wisconsin — 10.9% | |
| | | |
| | |
| Public Finance Authority | |
| | | |
| | |
| 7.50%, 06/01/2029(c) | |
$ | 8,925,000 | | |
$ | 8,778,210 | |
| 10.00%, 09/01/2031 | |
| 525,000 | | |
| 501,248 | |
| 10.00%, 09/01/2031(c) | |
| 145,000 | | |
| 138,339 | |
| 11.00%, 01/15/2033(c)(e) | |
| 405,000 | | |
| 413,528 | |
| 11.00%, 02/01/2033 | |
| 936,000 | | |
| 962,777 | |
| 8.35%, 12/15/2033(c) | |
| 2,355,000 | | |
| 2,323,049 | |
| 12.00%, 12/15/2033(c) | |
| 530,000 | | |
| 532,706 | |
| 11.00%, 06/30/2034(c) | |
| 330,000 | | |
| 331,485 | |
| 8.10%, 07/01/2034(c) | |
| 6,350,000 | | |
| 6,077,997 | |
| 12.00%, 07/01/2034(c) | |
| 660,000 | | |
| 656,359 | |
| 9.75%, 04/01/2054(d) | |
| 825,000 | | |
| 800,620 | |
| | |
| | | |
| 21,516,318 | |
Total Municipal Bonds
(Cost $52,923,302) | |
| | | |
| 53,731,486 | |
| |
| Private Investments — 20.9% | |
| | | |
| | |
| United States Natural Gas/Natural Gas Liquids Pipelines — 1.5% |
| Mexico Pacific Limited LLC (MPL) Series
A(f)(g) | |
| 135,180 | | |
| 2,966,390 | |
| |
| United States Power — 5.5% | |
| | | |
| | |
| One Power Company(f)(g) | |
| 21,957 | | |
| 10,820,849 | |
| |
| United States Renewables — 13.9% | |
| | | |
| | |
| Renewable Holdco , LLC(f)(g)(h) | |
| N/A | | |
| 7,117,178 | |
| Renewable Holdco I, LLC(f)(g)(h) | |
| N/A | | |
| 12,192,839 | |
| Renewable Holdco II, LLC(f)(g)(h) | |
| N/A | | |
| 8,333,719 | |
| | |
| | | |
| 27,643,736 | |
Total Private Investments
(Cost $53,395,220) | |
| | | |
| 41,430,975 | |
See accompanying Notes to Financial Statements.
2024 Annual Report |
November 30, 2024
TEAF
Consolidated Schedule of Investments (continued)
November
30, 2024
| | |
Principal
Amount/ | |
|
| | |
Units | |
Fair
Value |
| |
| Corporate Bonds — 8.2% | |
| | | |
| | |
| United States Healthcare — 1.9% | |
| | | |
| | |
| 315/333 West Dawson Associates SUB 144A NT, |
|
|
|
|
|
|
|
|
| 11.00%, 01/31/2026(c)(g) | |
$ | 3,770,000 | | |
$ | 3,697,639 | |
| |
| United States Senior Living — 6.3% | |
| | | |
| | |
| Ativo Albuquerque LLC, | |
| | | |
| | |
| 12.00%, 01/01/2028(c)(g) | |
| 2,032,000 | | |
| 2,166,297 | |
| Contour Propco 1735 S MISSION SUB 144A NT, |
|
|
|
|
|
|
|
|
| 11.00%, 10/01/2025(c)(f)(g)(i) | |
| 5,715,000 | | |
| 306,931 | |
| Dove Mountain Residences LLC | |
| | | |
| | |
| 11.00%, 02/01/2026(c)(g) | |
| 1,050,000 | | |
| 1,014,914 | |
| 16.00%, 02/01/2026(c)(g) | |
| 1,116,447 | | |
| 1,076,354 | |
| Drumlin Reserve Property LLC, | |
| | | |
| | |
| 10.00%, 10/02/2025(c)(g) | |
| 1,705,311 | | |
| 1,691,693 | |
| JW Living Smithville Urban Ren Sub Global 144A 27, |
|
|
|
|
|
|
|
|
| 11.75%, 06/01/2027(c)(g) | |
| 3,890,000 | | |
| 4,003,066 | |
| Realco Perry Hall MD LLC/OPCO Sub 144A NT, |
|
|
|
|
|
|
|
|
| 10.00%, 12/02/2024(c)(g) | |
| 2,198,000 | | |
| 2,198,107 | |
| | |
| | | |
| 12,457,362 | |
Total Corporate Bonds
(Cost $21,423,537) | |
| | | |
| 16,155,001 | |
| |
| Master Limited Partnerships — 7.3% | |
| | | |
| | |
| United States Natural Gas/Natural Gas Liquids Pipelines — 4.3% |
| Energy Transfer LP(a) | |
| 296,445 | | |
| 5,887,398 | |
| Enterprise Products Partners LP(a) | |
| 76,409 | | |
| 2,630,762 | |
| | |
| | | |
| 8,518,160 | |
| |
| United States Refined Product Pipelines — 3.0% | |
| | | |
| | |
| MPLX LP(a) | |
| 116,925 | | |
| 6,040,345 | |
Total Master Limited Partnerships
(Cost $6,069,405) | |
| | | |
| 14,558,505 | |
| | |
Principal
Amount/
Shares | |
Fair
Value |
| |
| Private Notes — 1.8% | |
| | | |
| | |
| Bermuda Renewables — 1.8% | |
| | | |
| | |
| Saturn Solar Bermuda 1 Ltd., |
|
|
|
|
|
|
|
|
| 10.00%, 12/31/2024(f)(g) |
|
$ |
3,510,000 |
|
|
$ |
3,653,559 |
|
| Total Private Notes | |
| | | |
| | |
| (Cost $3,778,904) | |
| | | |
| 3,653,559 | |
| |
| Short-Term Investments — 0.3% | |
| | | |
| | |
| Money Market Funds — 0.3% | |
| | | |
| | |
| First American Government Obligations
Fund — Class X, 4.56%(j) |
|
|
503,646 |
|
|
|
503,646 |
|
Total Short-Term Investments
(Cost $503,646) | |
| | | |
| 503,646 | |
| |
Total Investments — 115.1%
(Cost
$231,545,116) |
|
|
|
|
|
|
228,075,361 |
|
| Other Assets in Excess of Liabilities — 0.8% | |
| | | |
| 1,501,154 | |
| Credit Facility Borrowings — (15.9)% | |
| | | |
| (31,500,000 | ) |
| Total Net Assets — 100.0% | |
| | | |
$ | 198,076,515 | |
Percentages are stated as a percent of net assets.
PLC – Public Limited Company
SA – Sociedad Anónima
| (a) | All or a portion of the security is segregated as collateral for the margin borrowing facility. |
| (b) | Non-income producing security. |
| (c) | Security is exempt from registration pursuant to Rule 144A under the Securities Act of 1933, as amended. These securities may only
be resold in transactions exempt from registration to qualified institutional investors. As of November 30, 2024, the value of these securities
total $60,305,426 or 30.4% of the Fund’s net assets. |
| (d) | Step coupon bond. The rate disclosed is as of November 30, 2024. |
| (e) | Coupon rate is variable or floats based on components including but not limited to reference rate and spread. These securities may
not indicate a reference rate and/or spread in their description. The rate disclosed is as of November 30, 2024. |
| (f) | Fair value determined using significant unobservable inputs in accordance with procedures established by and under the supervision
of the Adviser, acting as Valuation Designee. These securities represented $45,391,465 or 22.9% of net assets as of November 30, 2024. |
| (g) | Restricted securities have a total fair value of $61,239,535 which represents 30.9% of net assets as of November 30, 2024. |
| (h) | Deemed to be an affiliate of the fund. |
| (i) | Issuer is currently in default. |
| (j) | The rate shown represents the 7-day annualized effective yield as of November 30, 2024. |
See accompanying Notes to Financial Statements.
Tortoise
Statements
of Assets & Liabilitiess
November
30, 2024
| | |
Tortoise
Energy | |
Tortoise |
| | |
Infrastructure | |
Midstream
Energy |
| | |
Corp.(1) | |
Fund,
Inc. |
| Assets | |
| | | |
| | |
| Investments in unaffiliated securities at fair value(2) | |
$ | 685,725,181 | | |
$ | 402,751,945 | |
| Investments in affiliated securities at fair value(3) | |
| 2,444,516 | | |
| — | |
| Cash at broker | |
| — | | |
| — | |
| Cash(6) | |
| — | | |
| — | |
| Receivable for investments sold | |
| 608,153 | | |
| — | |
| Receivable for insurance claim | |
| — | | |
| 27,365 | |
| Dividends, distributions and interest receivable from investments | |
| 294,468 | | |
| 439,027 | |
| Current tax asset | |
| — | | |
| 394,368 | |
| Expense Reimbursement Receivable | |
| — | | |
| — | |
| Prepaid expenses and other assets | |
| 436,667 | | |
| 239,373 | |
| Total assets | |
| 689,508,985 | | |
| 403,852,078 | |
| Liabilities | |
| | | |
| | |
| Payable to Adviser | |
| 999,888 | | |
| 571,845 | |
| Accrued expenses and other liabilities | |
| 1,470,239 | | |
| 667,839 | |
| Current tax liability | |
| 561,365 | | |
| — | |
| Credit facility borrowings | |
| 41,200,000 | | |
| 21,200,000 | |
| Senior notes, net(4) | |
| 50,298,847 | | |
| 29,137,411 | |
| Mandatory redeemable preferred stock, net(5) | |
| 35,639,903 | | |
| 13,739,248 | |
| Total liabilities | |
| 130,170,242 | | |
| 65,316,343 | |
| Net assets applicable to common stockholders | |
$ | 559,338,743 | | |
$ | 338,535,735 | |
| | |
| | | |
| | |
| Net Assets Applicable to Common Stockholders Consist of: | |
| | | |
| | |
| Capital stock, $0.001 par value per share | |
$ | 10,765 | | |
$ | 5,093 | |
| Additional paid-in capital | |
| 574,414,344 | | |
| 640,033,619 | |
| Total distributable accumulated losses | |
| (15,086,366 | ) | |
| (301,502,977 | ) |
| Net assets applicable to common stockholders | |
$ | 559,338,743 | | |
$ | 338,535,735 | |
| | |
| | | |
| | |
| Capital shares: | |
| | | |
| | |
| Authorized | |
| 100,000,000 | | |
| 100,000,000 | |
| | |
| | | |
| | |
| Outstanding | |
| 10,764,933 | | |
| 5,092,810 | |
| | |
| | | |
| | |
| Net Asset Value per common share outstanding
(net assets applicable to common stock, divided by common shares outstanding) |
|
$ |
51.96 |
|
|
$ |
66.47 |
|
| | |
| | | |
| | |
| (1) Consolidated Statement of Assets and Liabilities (See Note 13 to the financial statements for further disclosure) | |
| | | |
| | |
| (2) Investments in unaffiliated securities at cost | |
$ | 620,153,272 | | |
$ | 352,982,112 | |
| (3) Investments in affiliated securities at cost | |
$ | 51,041,470 | | |
$ | — | |
| (4) Deferred debt issuance and offering costs | |
$ | 34,486 | | |
$ | 33,267 | |
| (5) Deferred offering costs | |
$ | 20,707 | | |
$ | 14,527 | |
| (6) TEAF cash balance of $40,208 reflects cash held at TEAF Solar Holdco, LLC at the
end of the period. See Note 13 to the financial statements for additional information |
|
|
|
|
|
|
|
|
See accompanying Notes to Financial Statements.
2024 Annual Report |
November 30, 2024
| | |
| |
Tortoise
Power | |
Tortoise |
| Tortoise
Pipeline | |
Tortoise
Energy | |
and
Energy | |
Sustainable |
| &
Energy | |
Independence | |
Infrastructure | |
and
Social Impact |
| Fund,
Inc. | |
Fund,
Inc. | |
Fund,
Inc. | |
Term
Fund(1) |
| |
| $ | 117,034,221 | | |
$ | 86,307,716 | | |
$ | 149,851,215 | | |
$ | 200,431,625 | |
| | — | | |
| — | | |
| — | | |
| 27,643,736 | |
| | — | | |
| — | | |
| — | | |
| 115,875 | |
| | 296,824 | | |
| 235,487 | | |
| 283,515 | | |
| 40,208 | |
| | 1,512,524 | | |
| — | | |
| — | | |
| 10,345 | |
| | — | | |
| — | | |
| — | | |
| — | |
| | 98,132 | | |
| 169,413 | | |
| 1,132,426 | | |
| 2,074,354 | |
| | — | | |
| — | | |
| — | | |
| — | |
| | 156,400 | | |
| 217,304 | | |
| — | | |
| — | |
| | 85,633 | | |
| 30,972 | | |
| 7,405 | | |
| 33,607 | |
| | 119,183,734 | | |
| 86,960,892 | | |
| 151,274,561 | | |
| 230,349,750 | |
| |
| | 206,459 | | |
| 149,242 | | |
| 224,354 | | |
| 516,130 | |
| | 273,145 | | |
| 103,227 | | |
| 161,591 | | |
| 257,105 | |
| | — | | |
| — | | |
| — | | |
| — | |
| | 2,700,000 | | |
| 11,600,000 | | |
| 25,500,000 | | |
| 31,500,000 | |
| | 3,942,680 | | |
| — | | |
| — | | |
| — | |
| | 6,099,807 | | |
| — | | |
| — | | |
| — | |
| | 13,222,091 | | |
| 11,852,469 | | |
| 25,885,945 | | |
| 32,273,235 | |
| $ | 105,961,643 | | |
$ | 75,108,423 | | |
$ | 125,388,616 | | |
$ | 198,076,515 | |
| |
| |
| $ | 2,011 | | |
$ | 1,666 | | |
$ | 5,890 | | |
$ | 13,491 | |
| | 161,638,831 | | |
| 206,372,880 | | |
| 94,316,017 | | |
| 226,885,731 | |
| | (55,679,199 | ) | |
| (131,266,123 | ) | |
| 31,066,709 | | |
| (28,822,707 | ) |
| $ | 105,961,643 | | |
$ | 75,108,423 | | |
$ | 125,388,616 | | |
$ | 198,076,515 | |
| |
| |
| | 100,000,000 | | |
| 100,000,000 | | |
| 100,000,000 | | |
| 100,000,000 | |
| |
| | 2,010,566 | | |
| 1,666,014 | | |
| 5,890,167 | | |
| 13,491,127 | |
| |
|
| $ | 52.70 | | |
$ | 45.08 | | |
$ | 21.29 | | |
$ | 14.68 | |
| |
| |
| |
| $ | 59,364,241 | | |
$ | 43,449,992 | | |
$ | 98,828,818 | | |
$ | 189,231,581 | |
| $ | — | | |
$ | — | | |
$ | — | | |
$ | 42,313,535 | |
| $ | 178 | | |
$ | — | | |
$ | — | | |
$ | — | |
| $ | 193 | | |
$ | — | | |
$ | — | | |
$ | — | |
See accompanying Notes to Financial Statements.
Tortoise
Statements of Operations
For the year ended November 30, 2024
| | |
Tortoise
Energy | |
Tortoise |
| | |
Infrastructure | |
Midst ream
Energy |
| | |
Corp.(1) | |
Fund,
Inc. |
| Investment Income | |
| | | |
| | |
| Distributions from master limited partnerships | |
$ | 11,441,737 | | |
$ | 5,347,148 | |
| Dividends and distributions from common stock | |
| 14,577,776 | | |
| 11,633,572 | |
| Dividends and distributions from preferred stock | |
| — | | |
| — | |
| Less return of capital on distributions(2) | |
| (12,780,720 | ) | |
| (9,566,553 | ) |
| Less foreign taxes withheld | |
| (31,203 | ) | |
| (282,390 | ) |
| Net dividends and distributions from investments | |
| 13,207,590 | | |
| 7,131,777 | |
| Interest income | |
| 463,658 | | |
| 318,623 | |
| Other income | |
| 4,212 | | |
| — | |
| Total Investment Income | |
| 13,675,460 | | |
| 7,450,400 | |
| Operating Expenses | |
| | | |
| | |
| Advisory fees | |
| 5,190,191 | | |
| 2,911,927 | |
| Administrator fees | |
| 227,974 | | |
| 133,759 | |
| Professional fees | |
| 1,221,895 | | |
| 1,056,065 | |
| Directors fees | |
| 103,235 | | |
| 102,338 | |
| Stockholder communication expenses | |
| 119,526 | | |
| 58,227 | |
| Custodian fees and expenses | |
| 24,413 | | |
| 15,331 | |
| Fund accounting fees | |
| 63,550 | | |
| 49,347 | |
| Registration fees | |
| 23,750 | | |
| 23,750 | |
| Stock transfer agent fees | |
| 112,872 | | |
| 95,559 | |
| Other operating expenses | |
| 229,267 | | |
| 69,280 | |
| Total Operating Expenses | |
| 7,316,673 | | |
| 4,515,583 | |
| Leverage Expenses | |
| | | |
| | |
| Interest expense | |
| 3,490,564 | | |
| 1,709,939 | |
| Distributions to mandatory redeemable preferred stockholders | |
| 1,223,068 | | |
| 460,868 | |
| Amortization of debt issuance costs | |
| 53,731 | | |
| 14,812 | |
| Other leverage expenses | |
| 101,500 | | |
| 101,500 | |
| Total Leverage Expenses | |
| 4,868,863 | | |
| 2,287,119 | |
| Total Expenses | |
| 12,185,536 | | |
| 6,802,702 | |
| Less expense reimbursement by Adviser (Note 4) | |
| — | | |
| — | |
| Net Expenses | |
| 12,185,536 | | |
| 6,802,702 | |
| Net Investment Income (Loss), before Income Taxes | |
| 1,489,924 | | |
| 647,698 | |
| Deferred tax benefit (expense) | |
| — | | |
| — | |
| Net Investment Income (Loss) | |
$ | 1,489,924 | | |
$ | 647,698 | |
| (1) | Consolidated Statement of Operations (See Note 13 to the financial statements for further disclosure). |
| (2) | Return of Capital may be in excess of current year distributions due to prior year adjustments. See Note 2 to the financial statements
for further disclosure. |
See accompanying Notes to Financial Statements.
2024 Annual Report |
November 30, 2024
| | |
| |
Tortoise
Power | |
Tortoise |
| Tortoise Pipeline | |
Tortoise Energy | |
and Energy | |
Sustainable |
| & Energy | |
Independence | |
Infrastructure | |
and Social Impact |
| Fund,
Inc. | |
Fund,
Inc. | |
Fund,
Inc. | |
Term
Fund(1) |
| |
| $ | 1,445,851 | | |
$ | 1,024,675 | | |
$ | 2,099,424 | | |
$ | 946,896 | |
| | 4,077,177 | | |
| 2,128,621 | | |
| 2,081,150 | | |
| 4,080,057 | |
| | — | | |
| — | | |
| — | | |
| 268,636 | |
| | (2,327,956 | ) | |
| (1,231,609 | ) | |
| (2,560,814 | ) | |
| (1,339,680 | ) |
| | (176,161 | ) | |
| (25,238 | ) | |
| (35,991 | ) | |
| (349,188 | ) |
| | 3,018,911 | | |
| 1,896,449 | | |
| 1,583,769 | | |
| 3,606,721 | |
| | 17,134 | | |
| 18,027 | | |
| 3,440,363 | | |
| 7,330,507 | |
| | — | | |
| — | | |
| — | | |
| — | |
| | 3,036,045 | | |
| 1,914,476 | | |
| 5,024,132 | | |
| 10,937,228 | |
| |
| | 1,066,081 | | |
| 815,388 | | |
| 1,232,501 | | |
| 3,010,947 | |
| | 51,562 | | |
| 44,256 | | |
| 67,247 | | |
| 106,532 | |
| | 235,433 | | |
| 343,443 | | |
| 220,245 | | |
| 469,093 | |
| | 67,914 | | |
| 67,914 | | |
| 87,338 | | |
| 88,338 | |
| | 43,900 | | |
| 37,335 | | |
| 74,598 | | |
| 28,830 | |
| | 7,550 | | |
| 6,359 | | |
| 7,160 | | |
| 24,451 | |
| | 28,760 | | |
| 26,832 | | |
| 27,638 | | |
| 30,098 | |
| | 23,750 | | |
| 25,000 | | |
| 23,750 | | |
| 24,058 | |
| | 66,665 | | |
| 58,850 | | |
| 80,696 | | |
| 33,028 | |
| | 48,516 | | |
| 35,374 | | |
| 20,570 | | |
| 132,212 | |
| | 1,640,131 | | |
| 1,460,751 | | |
| 1,841,743 | | |
| 3,947,587 | |
| |
| | 605,914 | | |
| 624,906 | | |
| 1,511,243 | | |
| 1,530,003 | |
| | 278,770 | | |
| — | | |
| — | | |
| — | |
| | 11,404 | | |
| — | | |
| — | | |
| — | |
| | 30,000 | | |
| — | | |
| — | | |
| — | |
| | 926,088 | | |
| 624,906 | | |
| 1,511,243 | | |
| 1,530,003 | |
| | 2,566,219 | | |
| 2,085,657 | | |
| 3,352,986 | | |
| 5,477,590 | |
| | (331,759 | ) | |
| (460,047 | ) | |
| — | | |
| — | |
| | 2,234,460 | | |
| 1,625,610 | | |
| 3,352,986 | | |
| 5,477,590 | |
| | 801,585 | | |
| 288,866 | | |
| 1,671,146 | | |
| 5,459,638 | |
| | — | | |
| — | | |
| — | | |
| — | |
| $ | 801,585 | | |
$ | 288,866 | | |
$ | 1,671,146 | | |
$ | 5,459,638 | |
See accompanying Notes to Financial Statements.
Statements
of Operations (continued)
For
the year ended November 30, 2024
| | |
Tortoise
Energy | |
Tortoise |
| | |
Infrastructure | |
Midstream
Energy |
| | |
Corp.(1) | |
Fund,
Inc. |
| Realized and Unrealized Gain (Loss) on Investments and Foreign Currency | |
| | | |
| | |
| Net realized gain (loss) on investments in unaffiliated securities | |
$ | 134,292,234 | | |
$ | 92,033,031 | |
| Net realized gain on written options | |
| — | | |
| — | |
| Net realized gain on termination of interest rate swap contracts | |
| — | | |
| — | |
| Net realized gain (loss) on foreign currency and translation of
other assets and liabilities denominated in foreign currency |
|
|
657 |
|
|
|
— |
|
| Net realized gain (loss), before income taxes | |
| 134,292,891 | | |
| 92,033,031 | |
| Current tax benefit (expense) | |
| (344,744 | ) | |
| 129,997 | |
| Net realized gain (loss) | |
| 133,948,147 | | |
| 92,163,028 | |
| Net change in unrealized appreciation (depreciation) of investments in unaffiliated securities | |
| 88,490,408 | | |
| 44,757,439 | |
| Net change in unrealized appreciation (depreciation) of investments in affiliated securities | |
| (13,006,099 | ) | |
| — | |
| Net change in unrealized appreciation of written options | |
| — | | |
| — | |
| Net change in unrealized appreciation (depreciation) of other
assets and liabilities due to foreign currency translation |
|
|
(649 |
) |
|
|
(5,482 |
) |
| Net unrealized appreciation (depreciation), before income taxes | |
| 75,483,660 | | |
| 44,751,957 | |
| Net unrealized appreciation (depreciation) | |
| 75,483,660 | | |
| 44,751,957 | |
| Net Realized and Unrealized Gain (Loss) | |
| 209,431,807 | | |
| 136,914,985 | |
| Net Increase (Decrease) in Net Assets Applicable to Common
Stockholders Resulting from Operations |
|
$ |
210,921,731 |
|
|
$ |
137,562,683 |
|
| (1) | Consolidated
Statement of Operations (See Note 13 to the financial statements for further disclosure). |
| (2) | Return
of Capital may be in excess of current year distributions due to prior year adjustments.
See Note 2 to the financial statements for further disclosure. |
See accompanying
Notes to Financial Statements.
2024 Annual Report |
November 30, 2024
| | |
| |
Tortoise
Power | |
Tortoise |
| Tortoise
Pipeline | |
Tortoise
Energy | |
and
Energy | |
Sustainable |
| &
Energy | |
Independence | |
Infrastructure | |
and
Social Impact |
| Fund,
Inc. | |
Fund,
Inc. | |
Fund,
Inc. | |
Term
Fund(1) |
| | |
| |
| |
|
| $ | 489,195 | | |
$ | 1,718,271 | | |
$ | (969,653 | ) | |
$ | 3,939,004 | |
| | — | | |
| — | | |
| — | | |
| 17,983 | |
| | — | | |
| — | | |
| 225,000 | | |
| — | |
| | | | |
| | | |
| | | |
| | |
| | 218 | | |
| — | | |
| — | | |
| (21,944 | ) |
| | 489,413 | | |
| 1,718,271 | | |
| (744,653 | ) | |
| 3,935,043 | |
| | — | | |
| — | | |
| — | | |
| — | |
| | 489,413 | | |
| 1,718,271 | | |
| (744,653 | ) | |
| 3,935,043 | |
| | 39,890,705 | | |
| 18,246,532 | | |
| 36,159,331 | | |
| 14,396,460 | |
| | — | | |
| — | | |
| — | | |
| (11,408,533 | ) |
| | — | | |
| — | | |
| — | | |
| 12,781 | |
| | | | |
| | | |
| | | |
| | |
| | 176 | | |
| — | | |
| — | | |
| (6,070 | ) |
| | 39,890,881 | | |
| 18,246,532 | | |
| 36,159,331 | | |
| 2,994,638 | |
| | 39,890,881 | | |
| 18,246,532 | | |
| 36,159,331 | | |
| 2,994,638 | |
| | 40,380,294 | | |
| 19,964,803 | | |
| 35,414,678 | | |
| 6,929,681 | |
| | | | |
| | | |
| | | |
| | |
| $ | 41,181,879 | | |
$ | 20,253,669 | | |
$ | 37,085,824 | | |
$ | 12,389,319 | |
See accompanying Notes to Financial Statements.
Statements
of Changes in Net Assets
| | |
Tortoise
Energy Infrastructure Corp.(1) |
| | |
Year
Ended | |
Year
Ended |
| | |
November
30, | |
November
30, |
| | |
2024 | |
2023 |
| Operations | |
| | | |
| | |
| Net investment income (loss) | |
$ | 1,489,924 | | |
$ | 3,332,720 | |
| Net realized gain (loss) | |
| 133,948,147 | | |
| 48,885,487 | |
| Net unrealized appreciation (depreciation) | |
| 75,483,660 | | |
| (67,840,820 | ) |
| Net increase (decrease) in net assets applicable to common stockholders resulting from operations |
|
|
210,921,731 |
|
|
|
(15,622,613 |
) |
| Distributions to Common Stockholders | |
| | | |
| | |
| From distributable earnings | |
| (4,875,004 | ) | |
| (18,410,881 | ) |
| From return of capital | |
| (27,204,496 | ) | |
| (13,368,334 | ) |
| Total distributions to common stockholders | |
| (32,079,500 | ) | |
| (31,779,215 | ) |
| Capital Stock Transactions | |
| | | |
| | |
| Cost of shares repurchased and retired through tender offer | |
| — | | |
| (18,719,638 | ) |
| Net increase (decrease) in net assets applicable to common stockholders from capital stock transactions |
|
|
— |
|
|
|
(18,719,638 |
) |
| Total increase (decrease) in net assets applicable to common stockholders | |
| 178,842,231 | | |
| (66,121,466 | ) |
| Net Assets | |
| | | |
| | |
| Beginning of year | |
| 380,496,512 | | |
| 446,617,978 | |
| End of year | |
$ | 559,338,743 | | |
$ | 380,496,512 | |
| Transactions in common shares | |
| | | |
| | |
| Shares outstanding at beginning of year | |
| 10,764,933 | | |
| 11,331,508 | |
| Shares repurchased | |
| — | | |
| (566,575 | ) |
| Shares outstanding at end of year | |
| 10,764,933 | | |
| 10,764,933 | |
| (1) | Consolidated Statement of Changes in Net Assets (See Note 13 to the financial statements for further disclosure). |
See accompanying Notes to Financial Statements.
2024 Annual Report |
November 30, 2024
| Tortoise
Midstream Energy Fund, Inc. | |
Tortoise
Pipeline & Energy Fund, Inc. |
| Year
Ended | |
Year
Ended | |
Year
Ended | |
Year
Ended |
| November
30, | |
November
30, | |
November
30, | |
November
30, |
| 2024 | |
2023 | |
2024 | |
2023 |
| | | | |
| | | |
| | | |
| | |
| $ | 647,698 | | |
$ | 1,547,631 | | |
$ | 801,585 | | |
$ | 327,453 | |
| | 92,163,028 | | |
| 28,010,841 | | |
| 489,413 | | |
| 5,349,200 | |
| | 44,751,957 | | |
| (22,608,088 | ) | |
| 39,890,881 | | |
| (1,338,009 | ) |
| | | | |
| | | |
| | | |
| | |
| | 137,562,683 | | |
| 6,950,384 | | |
| 41,181,879 | | |
| 4,338,644 | |
| | | | |
| | | |
| | | |
| | |
| | (1,694,296 | ) | |
| (8,701,938 | ) | |
| (675,318 | ) | |
| (1,109,052 | ) |
| | (14,398,984 | ) | |
| (7,603,071 | ) | |
| (4,069,618 | ) | |
| (3,823,183 | ) |
| | (16,093,280 | ) | |
| (16,305,009 | ) | |
| (4,744,936 | ) | |
| (4,932,235 | ) |
| | | | |
| | | |
| | | |
| | |
| | — | | |
| (10,600,666 | ) | |
| — | | |
| (3,390,441 | ) |
| | | | |
| | | |
| | | |
| | |
| | — | | |
| (10,600,666 | ) | |
| — | | |
| (3,390,441 | ) |
| | 121,469,403 | | |
| (19,955,291 | ) | |
| 36,436,943 | | |
| (3,984,032 | ) |
| | | | |
| | | |
| | | |
| | |
| | 217,066,332 | | |
| 237,021,623 | | |
| 69,524,700 | | |
| 73,508,732 | |
| $ | 338,535,735 | | |
$ | 217,066,332 | | |
$ | 105,961,643 | | |
$ | 69,524,700 | |
| |
| | 5,092,810 | | |
| 5,360,842 | | |
| 2,010,566 | | |
| 2,116,385 | |
| | — | | |
| (268,032 | ) | |
| — | | |
| (105,819 | ) |
| | 5,092,810 | | |
| 5,092,810 | | |
| 2,010,566 | | |
| 2,010,566 | |
See accompanying Notes to Financial Statements.
Statements
of Changes in Net Assets (continued)
| | |
Tortoise
Energy Independence Fund, Inc. |
| | |
Year
Ended | |
Year
Ended |
| | |
November
30, | |
November
30, |
| | |
2024 | |
2023 |
| |
| Operations | |
| | | |
| | |
| Net investment income (loss) | |
$ | 288,866 | | |
$ | 769,819 | |
| Net realized gain (loss) | |
| 1,718,271 | | |
| 4,831,148 | |
| Net unrealized appreciation (depreciation) | |
| 18,246,532 | | |
| (6,194,820 | ) |
| Net increase (decrease) in net assets applicable to common stockholders resulting from operations |
|
|
20,253,669 |
|
|
|
(593,853 |
) |
| Distributions to Common Stockholders | |
| | | |
| | |
| From distributable earnings | |
| (711,025 | ) | |
| (1,293,398 | ) |
| From return of capital | |
| (3,487,330 | ) | |
| (3,070,680 | ) |
| Total distributions to common stockholders | |
| (4,198,355 | ) | |
| (4,364,078 | ) |
| Capital Stock Transactions | |
| | | |
| | |
| Cost of shares repurchased and retired through tender offer | |
| — | | |
| (3,055,787 | ) |
| Net increase (decrease) in net assets applicable to common stockholders from capital stock transactions |
|
|
— |
|
|
|
(3,055,787 |
) |
| Total increase (decrease) in net assets applicable to common stockholders | |
| 16,055,314 | | |
| (8,013,718 | ) |
| Net Assets | |
| | | |
| | |
| Beginning of year | |
| 59,053,109 | | |
| 67,066,827 | |
| End of year | |
$ | 75,108,423 | | |
$ | 59,053,109 | |
| Transactions in common shares | |
| | | |
| | |
| Shares outstanding at beginning of year | |
| 1,666,014 | | |
| 1,753,698 | |
| Shares repurchased | |
| — | | |
| (87,684 | ) |
| Shares outstanding at end of year | |
| 1,666,014 | | |
| 1,666,014 | |
| | (1) | Consolidated
Statement of Changes in Net Assets (See Note 13 to the financial statements for further disclosure). |
See accompanying Notes to Financial Statements.
2024 Annual Report |
November 30, 2024
| Tortoise
Power and Energy | |
Tortoise
Sustainable and Social |
| Infrastructure
Fund, Inc. | |
Impact
Term Fund(1) |
| Year
Ended | |
Year
Ended | |
Year
Ended | |
Year
Ended |
| November
30, | |
November
30, | |
November
30, | |
November
30, |
| 2024 | |
2023 | |
2024 | |
2023 |
| |
| $ | 1,671,146 | | |
$ | 1,980,315 | | |
$ | 5,459,638 | | |
$ | 5,146,824 | |
| | (744,653 | ) | |
| 5,973,783 | | |
| 3,935,043 | | |
| (4,142,366 | ) |
| | 36,159,331 | | |
| 1,989,386 | | |
| 2,994,638 | | |
| (6,974,383 | ) |
| | | | |
| | | |
| | | |
| | |
| | 37,085,824 | | |
| 9,943,484 | | |
| 12,389,319 | | |
| (5,969,925 | ) |
| |
| | (1,982,573 | ) | |
| (3,812,109 | ) | |
| (7,070,533 | ) | |
| (4,770,361 | ) |
| | (5,439,038 | ) | |
| (3,967,561 | ) | |
| (7,499,884 | ) | |
| (9,800,056 | ) |
| | (7,421,611 | ) | |
| (7,779,670 | ) | |
| (14,570,417 | ) | |
| (14,570,417 | ) |
| |
| | — | | |
| (4,684,221 | ) | |
| — | | |
| — | |
| | | | |
| | | |
| | | |
| | |
| | — | | |
| (4,684,221 | ) | |
| — | | |
| — | |
| | 29,664,213 | | |
| (2,520,407 | ) | |
| (2,181,098 | ) | |
| (20,540,342 | ) |
| |
| | 95,724,403 | | |
| 98,244,810 | | |
| 200,257,613 | | |
| 220,797,955 | |
| $ | 125,388,616 | | |
$ | 95,724,403 | | |
$ | 198,076,515 | | |
$ | 200,257,613 | |
| |
| | 5,890,167 | | |
| 6,200,175 | | |
| 13,491,127 | | |
| 13,491,127 | |
| | — | | |
| (310,008 | ) | |
| — | | |
| — | |
| | 5,890,167 | | |
| 5,890,167 | | |
| 13,491,127 | | |
| 13,491,127 | |
See accompanying Notes to Financial Statements.
Statements
of Cash Flows
For
year ended November 30, 2024
| | |
Tortoise
Energy | |
|
| | |
Infrastructure | |
Tortoise
Midstream |
| | |
Corp.(1) | |
Energy
Fund, Inc. |
| Cash Flows From Operating Activities | |
| | | |
| | |
| Dividends, distributions and interest received from investments | |
$ | 27,105,335 | | |
$ | 17,240,900 | |
| Purchases of long-term investments | |
| (1,209,155,183 | ) | |
| (648,427,105 | ) |
| Proceeds from sales of long-term investments | |
| 1,208,610,524 | | |
| 641,285,298 | |
| Sales (purchases) of short-term investments, net | |
| 119,579 | | |
| 3,549,218 | |
| Call options written, net | |
| — | | |
| — | |
| Proceeds from interest rate swap contracts, net | |
| — | | |
| — | |
| Interest received on securities sold, net | |
| 42,218 | | |
| 28,145 | |
| Interest expense paid | |
| (3,584,563 | ) | |
| (1,696,496 | ) |
| Distributions to mandatory redeemable preferred stockholders | |
| (1,223,068 | ) | |
| (460,868 | ) |
| Other leverage expenses paid | |
| (100,000 | ) | |
| (100,000 | ) |
| Net income taxes paid | |
| (1,913,059 | ) | |
| (1,523,813 | ) |
| Operating expenses paid | |
| (7,202,283 | ) | |
| (4,401,999 | ) |
| Net cash provided by (used in) operating activities | |
| 12,699,500 | | |
| 5,493,280 | |
| Cash Flows From Financing Activities | |
| | | |
| | |
| Advances (payments) on credit or margin facilities, net | |
| 33,900,000 | | |
| 10,600,000 | |
| Repayment of senior notes | |
| (14,520,000 | ) | |
| — | |
| Distributions paid to common stockholders | |
| (32,079,500 | ) | |
| (16,093,280 | ) |
| Net cash provided by (used in) financing activities | |
| (12,699,500 | ) | |
| (5,493,280 | ) |
| Net change in cash | |
| — | | |
| — | |
| Cash — beginning of year | |
| — | | |
| — | |
| Cash — end of year | |
$ | — | | |
$ | — | |
| | (1) | Consolidated Statement of Cash Flows (See Note 13 to the financial statements for further disclosure). |
See accompanying Notes to Financial Statements.
2024 Annual Report |
November 30, 2024
| | |
| |
Tortoise
Power | |
Tortoise |
| Tortoise
Pipeline | |
Tortoise
Energy | |
and Energy | |
Sustainable |
| &
Energy | |
Independence | |
Infrastructure | |
and Social
Impact |
| Fund,
Inc. | |
Fund,
Inc. | |
Fund,
Inc. | |
Term
Fund(1) |
| |
| $ | 5,373,262 | | |
$ | 3,149,654 | | |
$ | 7,396,213 | | |
$ | 10,929,215 | |
| | (4,968,376 | ) | |
| (4,108,750 | ) | |
| (17,191,477 | ) | |
| (55,474,309 | ) |
| | 9,667,207 | | |
| 4,123,672 | | |
| 19,070,778 | | |
| 56,389,866 | |
| | 457,549 | | |
| 336,952 | | |
| 340,564 | | |
| (69,850 | ) |
| | — | | |
| — | | |
| — | | |
| (16,042 | ) |
| | — | | |
| — | | |
| 225,000 | | |
| — | |
| | — | | |
| — | | |
| 399,392 | | |
| 827,223 | |
| | (604,979 | ) | |
| (673,192 | ) | |
| (1,592,288 | ) | |
| (1,515,170 | ) |
| | (278,770 | ) | |
| — | | |
| — | | |
| — | |
| | (30,000 | ) | |
| — | | |
| — | | |
| — | |
| | — | | |
| — | | |
| — | | |
| — | |
| | (1,374,133 | ) | |
| (1,194,494 | ) | |
| (1,843,056 | ) | |
| (3,994,651 | ) |
| | 8,241,760 | | |
| 1,633,842 | | |
| 6,805,126 | | |
| 7,076,282 | |
| |
| | (3,200,000 | ) | |
| 2,800,000 | | |
| 900,000 | | |
| 7,500,000 | |
| | — | | |
| — | | |
| — | | |
| — | |
| | (4,744,936 | ) | |
| (4,198,355 | ) | |
| (7,421,611 | ) | |
| (14,570,417 | ) |
| | (7,944,936 | ) | |
| (1,398,355 | ) | |
| (6,521,611 | ) | |
| (7,070,417 | ) |
| | 296,824 | | |
| 235,487 | | |
| 283,515 | | |
| 5,865 | |
| | — | | |
| — | | |
| — | | |
| 150,218 | |
| $ | 296,824 | | |
$ | 235,487 | | |
$ | 283,515 | | |
$ | 156,083 | |
See accompanying Notes to Financial Statements.
Statements
of Cash Flows (continued)
For
year ended November 30, 2024
| | |
Tortoise
Energy | |
Tortoise |
| | |
Infrastructure | |
Midstream
Energy |
| | |
Corp.(1) | |
Fund,
Inc. |
| Reconciliation
of net increase in net assets applicable to common stockholders resulting from operations to net cash provided by (used in) operating
activities |
|
|
|
|
|
|
|
|
| Net increase in net assets applicable to common stockholders resulting from operations | |
$ | 210,921,731 | | |
$ | 137,562,683 | |
| Adjustments to reconcile net increase in net assets applicable to common stockholders resulting from operations to net cash provided by (used in) operating activities: |
|
|
|
|
|
|
|
|
| Purchases of long-term investments | |
| (1,209,155,183 | ) | |
| (648,427,105 | ) |
| Proceeds from sales of long-term investments | |
| 1,209,218,677 | | |
| 641,285,298 | |
| Sales (purchases) of short-term investments, net | |
| 119,579 | | |
| 3,549,218 | |
| Proceeds from interest rate swap contracts, net | |
| — | | |
| — | |
| Call options written, net | |
| — | | |
| — | |
| Return of capital on distributions received | |
| 12,780,720 | | |
| 9,566,553 | |
| Net unrealized (appreciation) depreciation | |
| (75,483,660 | ) | |
| (44,751,957 | ) |
| Amortization (accretion) of market premium (discount), net | |
| — | | |
| — | |
| Net realized (gain) loss | |
| (134,292,891 | ) | |
| (92,033,031 | ) |
| Amortization of debt issuance costs | |
| 53,731 | | |
| 14,812 | |
| Changes in operating assets and liabilities: | |
| | | |
| | |
| (Increase) decrease in dividends, distributions and interest receivable from investments | |
| 691,373 | | |
| 252,092 | |
| (Increase) decrease in current tax asset | |
| — | | |
| (394,368 | ) |
| (Increase) decrease in receivable for investments sold | |
| (608,153 | ) | |
| — | |
| (Increase) decrease in prepaid expenses and other assets | |
| (128,343 | ) | |
| (80,347 | ) |
| Increase (decrease) in payable for investments purchased | |
| — | | |
| — | |
| Increase (decrease) in payable to Adviser, net of fees waived | |
| 225,385 | | |
| 143,765 | |
| Increase (decrease) in current tax liability | |
| (1,568,315 | ) | |
| (1,259,442 | ) |
| Increase (decrease) in accrued expenses and other liabilities | |
| (75,151 | ) | |
| 65,109 | |
| Total adjustments | |
| (198,222,231 | ) | |
| (132,069,403 | ) |
| Net cash provided by (used in) operating activities | |
$ | 12,699,500 | | |
$ | 5,493,280 | |
| | (1) | Consolidated Statement of Cash Flows (See Note 13 to the financial statements for further disclosure). |
See accompanying Notes to Financial Statements.
2024 Annual Report |
November 30, 2024
| | |
| |
Tortoise
Power | |
Tortoise |
| Tortoise
Pipeline | |
Tortoise
Energy | |
and
Energy | |
Sustainable |
| &
Energy | |
Independence | |
Infrastructure | |
and
Social Impact |
| Fund,
Inc. | |
Fund,
Inc. | |
Fund,
Inc. | |
Term
Fund(1) |
| |
| $ | 41,181,879 | | |
$ | 20,253,669 | | |
$ | 37,085,824 | | |
$ | 12,389,319 | |
| | | | |
| | | |
| | | |
| | |
|
|
| | (4,688,796 | ) | |
| (4,108,750 | ) | |
| (17,191,477 | ) | |
| (55,474,309 | ) |
| | 10,898,198 | | |
| 4,123,672 | | |
| 19,070,778 | | |
| 56,400,211 | |
| | 457,549 | | |
| 336,952 | | |
| 340,564 | | |
| (69,850 | ) |
| | — | | |
| — | | |
| 225,000 | | |
| — | |
| | — | | |
| — | | |
| — | | |
| (16,042 | ) |
| | 2,327,956 | | |
| 1,231,609 | | |
| 2,560,814 | | |
| 1,339,680 | |
| | (39,890,881 | ) | |
| (18,246,532 | ) | |
| (36,159,331 | ) | |
| (2,994,638 | ) |
| | — | | |
| — | | |
| 113,626 | | |
| (113,149 | ) |
| | (489,413 | ) | |
| (1,718,271 | ) | |
| 744,653 | | |
| (3,935,043 | ) |
| | 11,404 | | |
| — | | |
| — | | |
| — | |
| | | | |
| | | |
| | | |
| | |
|
| | 9,261 | | |
| 3,569 | | |
| 97,033 | | |
| (407,321 | ) |
| | — | | |
| — | | |
| — | | |
| — | |
| | (1,230,991 | ) | |
| — | | |
| — | | |
| (10,345 | ) |
| | (6,655 | ) | |
| (24,474 | ) | |
| 9,661 | | |
| (29,520 | ) |
| | (279,580 | ) | |
| — | | |
| — | | |
| — | |
| | (54,225 | ) | |
| (147,114 | ) | |
| 34,458 | | |
| 6,005 | |
| | — | | |
| — | | |
| — | | |
| — | |
| | (3,946 | ) | |
| (70,488 | ) | |
| (126,477 | ) | |
| (8,716 | ) |
| | (32,940,119 | ) | |
| (18,619,827 | ) | |
| (30,280,698 | ) | |
| (5,313,037 | ) |
| $ | 8,241,760 | | |
$ | 1,633,842 | | |
$ | 6,805,126 | | |
$ | 7,076,282 | |
See accompanying Notes to Financial Statements.
TYG
Financial Highlights
| | |
Year
Ended | |
Year
Ended | |
Year
Ended | |
Year
Ended | |
Year
Ended |
| | |
November
30, | |
November
30, | |
November
30, | |
November
30, | |
November
30, |
| | |
2024 | |
2023 | |
2022 | |
2021 | |
2020 |
| |
| Per Common Share Data(1)(2) | |
| | | |
| | | |
| | | |
| | | |
| | |
| Net Asset Value, beginning of the year | |
$ | 35.35 | | |
$ | 39.41 | | |
$ | 33.54 | | |
$ | 25.42 | | |
$ | 69.24 | |
| Income (Loss) from Investment Operations | |
| | | |
| | | |
| | | |
| | | |
| | |
| Net investment income (loss)(3) | |
| 0.14 | | |
| 0.30 | | |
| 0.12 | | |
| (0.45 | ) | |
| (0.44 | ) |
| Net realized and unrealized gain (loss)(3) | |
| 19.45 | | |
| (1.52 | ) | |
| 8.59 | | |
| 10.04 | | |
| (41.20 | ) |
| Total income (loss) from investment operations | |
| 19.59 | | |
| (1.22 | ) | |
| 8.71 | | |
| 9.59 | | |
| (41.64 | ) |
| Distributions to Common Stockholders | |
| | | |
| | | |
| | | |
| | | |
| | |
| Net investment income | |
| (0.45 | ) | |
| (1.65 | ) | |
| — | | |
| — | | |
| — | |
| From return of capital | |
| (2.53 | ) | |
| (1.19 | ) | |
| (2.84 | ) | |
| (1.47 | ) | |
| (2.18 | ) |
| Total distributions to common stockholders | |
| (2.98 | ) | |
| (2.84 | ) | |
| (2.84 | ) | |
| (1.47 | ) | |
| (2.18 | ) |
| Capital Stock Transactions | |
| | | |
| | | |
| | | |
| | | |
| | |
| Net Asset Value, end of year | |
$ | 51.96 | | |
$ | 35.35 | | |
$ | 39.41 | | |
$ | 33.54 | | |
$ | 25.42 | |
| Per common share market value, end of year | |
$ | 46.00 | | |
$ | 28.11 | | |
$ | 33.54 | | |
$ | 27.27 | | |
$ | 19.16 | |
| Total investment return based on market value(4) | |
| 77.89 | % | |
| (7.77 | )% | |
| 33.82 | % | |
| 50.27 | % | |
| (69.69 | )% |
| |
| Supplemental Data and Ratios | |
| | | |
| | | |
| | | |
| | | |
| | |
| Net assets applicable to common stockholders, end of year (000's) |
|
$ |
559,339 |
|
|
$ |
380,497 |
|
|
$ |
446,618 |
|
|
$ |
400,044 |
|
|
$ |
311,398 |
|
| Average net assets (000's) | |
$ | 432,104 | | |
$ | 407,705 | | |
$ | 438,035 | | |
$ | 403,236 | | |
$ | 473,041 | |
| Ratio of Expenses to Average Net Assets | |
| | | |
| | | |
| | | |
| | | |
| | |
| Advisory fees | |
| 1.20 | % | |
| 1.24 | % | |
| 1.25 | % | |
| 1.18 | % | |
| 1.54 | % |
| Other operating expenses | |
| 0.49 | | |
| 0.51 | | |
| 0.25 | | |
| 0.29 | | |
| 0.27 | |
| Total operating expenses | |
| 1.69 | | |
| 1.75 | | |
| 1.50 | | |
| 1.47 | | |
| 1.81 | |
| Leverage expenses | |
| 1.13 | | |
| 1.29 | | |
| 1.18 | | |
| 1.32 | | |
| 3.48 | |
| Income tax expense (benefit)(5) | |
| 0.08 | | |
| (3.30 | ) | |
| 2.02 | | |
| 9.06 | | |
| (22.97 | ) |
| Total expenses | |
| 2.90 | % | |
| (0.26 | )% | |
| 4.70 | % | |
| 11.85 | % | |
| (17.68 | )% |
See accompanying Notes to Financial Statements.
2024 Annual Report |
November 30, 2024
| | |
Year
Ended | |
Year
Ended | |
Year
Ended | |
Year
Ended | |
Year
Ended |
| | |
November
30, | |
November
30, | |
November
30, | |
November
30, | |
November
30, |
| | |
2024 | |
2023 | |
2022 | |
2021 | |
2020 |
| |
| Ratio of net investment loss to average net assets | |
| 0.34 | % | |
| 0.82 | % | |
| 0.32 | % | |
| (1.35 | )% | |
| (2.80 | )% |
| Portfolio turnover rate | |
| 219.29 | % | |
| 41.98 | % | |
| 73.84 | % | |
| 65.30 | % | |
| 36.79 | % |
| Credit facility borrowings, end of year (000's) | |
$ | 41,200 | | |
$ | 7,300 | | |
$ | 30,700 | | |
$ | 19,200 | | |
$ | 13,200 | |
| Senior notes, end of year (000's) | |
$ | 50,333 | | |
$ | 64,853 | | |
$ | 81,632 | | |
$ | 83,893 | | |
$ | 87,927 | |
| Preferred stock, end of year (000's) | |
$ | 35,661 | | |
$ | 35,661 | | |
$ | 35,661 | | |
$ | 32,300 | | |
$ | 32,300 | |
| Per common share amount of senior notes
outstanding, end of year | |
$ | 4.68 | | |
$ | 6.02 | | |
$ | 7.20 | | |
$ | 7.03 | | |
$ | 7.18 | |
| Per common share amount of net assets, excluding senior notes, end of year |
|
$ |
56.64 |
|
|
$ |
41.37 |
|
|
$ |
46.61 |
|
|
$ |
40.57 |
|
|
$ |
32.60 |
|
| Asset coverage, per $1,000 of principal amount of senior year and credit facility borrowings(6) |
|
$ |
7,500 |
|
|
$ |
6,768 |
|
|
$ |
5,293 |
|
|
$ |
5,194 |
|
|
$ |
4,399 |
|
| Asset coverage ratio of senior notes and credit
facility borrowings(6) |
|
|
750 |
% |
|
|
677 |
% |
|
|
529 |
% |
|
|
519 |
% |
|
|
440 |
% |
| Asset coverage, per $10 liquidation value per share of mandatory redeemable preferred stock(7) |
|
$ |
54 |
|
|
$ |
45 |
|
|
$ |
40 |
|
|
$ |
40 |
|
|
$ |
33 |
|
| Asset coverage ratio of preferred stock(7) | |
| 540 | % | |
| 453 | % | |
| 402 | % | |
| 395 | % | |
| 333 | % |
| (1) | Information presented relates to a share of common stock outstanding for the entire year. |
| (2) | During the year ended November 30, 2020, the Fund effected the following reverse stock split: May 1, 2020, 1 for 4. All historical
per share information has been retroactively adjusted to reflect this reverse stock split. |
| (3) | The per common share data for the years ended November 30, 2023, 2022, 2021, and 2020 do not reflect the change in estimate of investment
income and return of capital, for the respective year. See Note 2C to the financial statements for further disclosure. |
| (4) | Total investment return is calculated assuming a purchase of common stock at the beginning of the year and a sale at the closing price
on the last day of the year reported (excluding brokerage commissions). The calculation also assumes reinvestment of distributions at
actual prices pursuant to TYG’s dividend reinvestment plan. |
| (5) | For the year ended November 30, 2024, TYG accrued $344,744 for current income tax expense. For the year ended November 30, 2023, TYG
accrued $13,467,645 for current tax benefit. For the year ended November 30, 2022, TYG accrued $8,864,115 for current tax expense. For
the year ended November 30, 2021, TYG accrued $36,546,777 for current income tax expense. For the year ended November 30, 2020, TYG accrued
$116,472,157 for net deferred income tax benefit and $7,747,729 for current income tax expense. |
| (6) | Represents value of total assets less all liabilities and indebtedness not represented by senior notes, credit facility borrowings
and preferred stock at the end of the period divided by senior notes and credit facility borrowings outstanding at the end of the year. |
| (7) | Represents value of total assets less all liabilities and indebtedness not represented by senior notes, credit facility borrowings
and preferred stock at the end of the period divided by senior notes, credit facility borrowings and preferred stock outstanding at the
end of the year. |
See accompanying Notes to Financial Statements.
NTG
Financial Highlights
| | |
Year
Ended | |
Year
Ended | |
Year
Ended | |
Year
Ended | |
Year
Ended |
| | |
November
30, | |
November
30, | |
November
30, | |
November
30, | |
November
30, |
| | |
2024 | |
2023 | |
2022 | |
2021 | |
2020 |
| |
| Per Common Share Data(1)(2) | |
| | | |
| | | |
| | | |
| | | |
| | |
| Net Asset Value, beginning of year | |
$ | 42.62 | | |
$ | 44.21 | | |
$ | 35.59 | | |
$ | 25.56 | | |
$ | 105.60 | |
| Income (Loss) from Investment Operations | |
| | | |
| | | |
| | | |
| | | |
| | |
| Net investment income (loss)(3) | |
| 0.13 | | |
| 0.29 | | |
| 0.18 | | |
| (0.41 | ) | |
| (0.30 | ) |
| Net realized and unrealized gain (loss)(3) | |
| 26.88 | | |
| 1.20 | | |
| 11.52 | | |
| 12.09 | | |
| (76.77 | ) |
| Total income (loss) from investment operations | |
| 27.01 | | |
| 1.49 | | |
| 11.70 | | |
| 11.68 | | |
| (77.07 | ) |
| Distributions to Common Stockholders | |
| | | |
| | | |
| | | |
| | | |
| | |
| Net investment income | |
| (0.33 | ) | |
| (1.64 | ) | |
| — | | |
| — | | |
| — | |
| From return of capital | |
| (2.83 | ) | |
| (1.44 | ) | |
| (3.08 | ) | |
| (1.65 | ) | |
| (2.97 | ) |
| Total distributions to common stockholders | |
| (3.16 | ) | |
| (3.08 | ) | |
| (3.08 | ) | |
| (1.65 | ) | |
| (2.97 | ) |
| Net Asset Value, end of year | |
$ | 66.47 | | |
$ | 42.62 | | |
$ | 44.21 | | |
$ | 35.59 | | |
$ | 25.56 | |
| Per common share market value, end of year | |
$ | 58.59 | | |
$ | 34.22 | | |
$ | 37.69 | | |
$ | 30.31 | | |
$ | 19.46 | |
| Total investment return based on market value(4) | |
| 83.92 | % | |
| (0.83 | )% | |
| 34.99 | % | |
| 64.86 | % | |
| (78.77 | )% |
| |
| Supplemental Data and Ratios | |
| | | |
| | | |
| | | |
| | | |
| | |
| Net assets applicable to common stockholders, end of year (000's) |
|
$ |
338,536 |
|
|
$ |
217,066 |
|
|
$ |
237,022 |
|
|
$ |
200,841 |
|
|
$ |
149,407 |
|
| Average net assets (000's) | |
$ | 250,602 | | |
$ | 219,839 | | |
$ | 229,874 | | |
$ | 200,484 | | |
$ | 289,147 | |
| Ratio of Expenses to Average Net Assets | |
| | | |
| | | |
| | | |
| | | |
| | |
| Advisory fees | |
| 1.16 | % | |
| 1.21 | % | |
| 1.21 | % | |
| 1.28 | % | |
| 1.61 | % |
| Other operating expenses | |
| 0.64 | | |
| 0.77 | | |
| 0.33 | | |
| 0.37 | | |
| 0.33 | |
| Total operating expenses | |
| 1.80 | | |
| 1.98 | | |
| 1.54 | | |
| 1.65 | | |
| 1.94 | |
| Leverage expenses | |
| 0.91 | | |
| 1.16 | | |
| 0.98 | | |
| 0.84 | | |
| 4.43 | |
| Income tax expense (benefit)(5) | |
| (0.05 | ) | |
| (2.29 | ) | |
| 2.04 | | |
| 8.82 | | |
| 2.19 | |
| Total expenses | |
| 2.66 | % | |
| 0.85 | % | |
| 4.56 | % | |
| 11.31 | % | |
| 8.56 | % |
See accompanying Notes to Financial Statements.
2024 Annual Report | November 30, 2024
| | |
Year
Ended
November 30,
2024 | |
Year
Ended
November 30,
2023 | |
Year
Ended
November 30,
2022 | |
Year
Ended
November 30,
2021 | |
Year
Ended
November 30,
2020 |
| Ratio of net investment loss to average net assets | |
| 0.26 | % | |
| 0.70 | % | |
| 0.44 | % | |
| (1.17 | )% | |
| (3.11 | )% |
| Portfolio turnover rate | |
| 207.65 | % | |
| 56.07 | % | |
| 72.67 | % | |
| 58.40 | % | |
| 38.08 | % |
| Credit facility borrowings, end of year (000's) | |
$ | 21,200 | | |
$ | 10,600 | | |
$ | 10,500 | | |
$ | 40,900 | | |
$ | 40,000 | |
| Senior notes, end of year (000's) | |
$ | 29,171 | | |
$ | 29,171 | | |
$ | 32,150 | | |
$ | 7,150 | | |
$ | 15,321 | |
| Preferred stock, end of year (000's) | |
$ | 13,754 | | |
$ | 13,754 | | |
$ | 19,719 | | |
$ | 12,219 | | |
$ | 12,700 | |
| Per common share amount of senior notes outstanding, end of year | |
$ | 5.73 | | |
$ | 5.73 | | |
$ | 6.00 | | |
$ | 1.27 | | |
$ | 2.62 | |
| Per common share amount of net assets, excluding senior notes, end of year | |
$ | 72.20 | | |
$ | 48.35 | | |
$ | 50.21 | | |
$ | 36.86 | | |
$ | 28.18 | |
| Asset coverage, per $1,000 of principal amount of senior notes and credit facility borrowings(6) | |
$ | 7,994 | | |
$ | 6,804 | | |
$ | 7,020 | | |
$ | 5,434 | | |
$ | 3,930 | |
| Asset coverage ratio of senior notes and credit facility borrowings(6) | |
| 799 | % | |
| 680 | % | |
| 702 | % | |
| 543 | % | |
| 393 | % |
| Asset coverage, per $25 liquidation value per share of mandatory redeemable preferred stock(7) | |
$ | 157 | | |
$ | 126 | | |
$ | 120 | | |
$ | 108 | | |
$ | 80 | |
| Asset coverage ratio of preferred stock(7) | |
| 628 | % | |
| 506 | % | |
| 480 | % | |
| 433 | % | |
| 320 | % |
| (1) |
Information presented relates to a share of common stock outstanding for the
entire year. |
| (2) |
During the year ended November 30, 2020, the Fund effected the following reverse
stock split: May 1, 2020, 1 for 10. All historical per share information has been retroactively adjusted to reflect this reverse
stock split. |
| (3) |
The per common share data for the years ended November 30, 2023, 2022, 2021,
and 2020 do not reflect the change in estimate of investment income and return of capital, for the respective year. See Note 2C to
the financial statements for further disclosure. |
| (4) |
Total investment return is calculated assuming a purchase of common stock at
the beginning of the year and a sale at the closing price on the last day of the year reported (excluding brokerage commissions).
This calculation also assumes reinvestment of distributions at actual prices pursuant to NTG’s dividend reinvestment plan. |
| (5) |
For the year ending November 30, 2024, NTG accrued $129,997 for current income
tax benefit. For the year ended November 30, 2023, NTG accrued $5,026,388 for current tax benefit. For the year ended November 30,
2022, NTG accrued $4,679,689 for current tax expense. For the year ended November 30, 2021, NTG accrued $17,691,276 for current income
tax expense. For the year ended November 30, 2020, NTG accrued $27,892,485 for net deferred income tax benefit and $34,222,098 for
current tax expense. |
| (6) |
Represents value of total assets less all liabilities and indebtedness not represented by senior
notes, credit facility borrowings and preferred stock at the end of the year divided by senior notes and credit facility borrowings
outstanding at the end of the year. |
| (7) |
Represents value of total assets less all liabilities and indebtedness not represented by senior
notes, credit facility borrowings and preferred stock at the end of the year divided by senior notes, credit facility borrowings
and preferred stock outstanding at the end of the year. |
See accompanying Notes to Financial Statements.
TTP Financial Highlights
| | |
Year
Ended
November 30,
2024 | |
Year
Ended
November 30,
2023 | |
Year
Ended
November 30,
2022 | |
Year
Ended
November 30,
2021 | |
Year
Ended
November 30,
2020 |
| Per Common Share Data(1)(2) | |
| | | |
| | | |
| | | |
| | | |
| | |
| Net Asset Value, beginning of year | |
$ | 34.58 | | |
$ | 34.73 | | |
$ | 27.96 | | |
$ | 19.97 | | |
$ | 51.88 | |
| Income (Loss) from Investment Operations | |
| | | |
| | | |
| | | |
| | | |
| | |
| Net investment income (loss)(3) | |
| 0.40 | | |
| 0.16 | | |
| 0.08 | | |
| (0.23 | ) | |
| (0.12 | ) |
| Net realized and unrealized gain (loss)(3) | |
| 20.08 | | |
| 2.05 | | |
| 9.05 | | |
| 9.28 | | |
| (30.17 | ) |
| Total income (loss) from investment operations | |
| 20.48 | | |
| 2.21 | | |
| 9.13 | | |
| 9.05 | | |
| (30.29 | ) |
| Distributions to Common Stockholders | |
| | | |
| | | |
| | | |
| | | |
| | |
| From net investment income | |
| (0.34 | ) | |
| (0.53 | ) | |
| (0.49 | ) | |
| — | | |
| — | |
| From return of capital | |
| (2.02 | ) | |
| (1.83 | ) | |
| (1.87 | ) | |
| (1.06 | ) | |
| (1.62 | ) |
| Total distributions to common stockholders | |
| (2.36 | ) | |
| (2.36 | ) | |
| (2.36 | ) | |
| (1.06 | ) | |
| (1.62 | ) |
| Net Asset Value, end of year | |
$ | 52.70 | | |
$ | 34.58 | | |
$ | 34.73 | | |
$ | 27.96 | | |
$ | 19.97 | |
| Per common share market value, end of year | |
$ | 52.34 | | |
$ | 28.02 | | |
$ | 28.58 | | |
$ | 23.16 | | |
$ | 15.15 | |
| Total investment return based on market value(4) | |
| 98.77 | % | |
| 6.72 | % | |
| 33.85 | % | |
| 60.09 | % | |
| (64.69 | )% |
| | |
| | | |
| | | |
| | | |
| | | |
| | |
| Supplemental Data and Ratios | |
| | | |
| | | |
| | | |
| | | |
| | |
| Net assets applicable to common stockholders, end of year (000's) | |
$ | 105,962 | | |
$ | 69,525 | | |
$ | 73,509 | | |
$ | 62,289 | | |
$ | 48,108 | |
| Average net assets (000's) | |
$ | 80,572 | | |
$ | 68,797 | | |
$ | 72,122 | | |
$ | 61,943 | | |
$ | 70,052 | |
| Ratio of Expenses to Average Net Assets | |
| | | |
| | | |
| | | |
| | | |
| | |
| Advisory fees | |
| 1.32 | % | |
| 1.39 | % | |
| 1.41 | % | |
| 1.46 | % | |
| 1.67 | % |
| Other operating expenses | |
| 0.71 | | |
| 0.61 | | |
| 0.60 | | |
| 0.74 | | |
| 0.75 | |
| Total operating expenses, before fee waiver | |
| 2.03 | | |
| 2.00 | | |
| 2.01 | | |
| 2.20 | | |
| 2.42 | |
| Fee waiver | |
| (0.41 | ) | |
| (0.29 | ) | |
| (0.28 | ) | |
| (0.21 | ) | |
| — | |
| Total operating expenses. | |
| 1.62 | | |
| 1.71 | | |
| 1.73 | | |
| 1.99 | | |
| 2.42 | |
| Leverage expenses. | |
| 1.15 | | |
| 1.53 | | |
| 1.19 | | |
| 1.67 | | |
| 2.66 | |
| Total expenses | |
| 2.77 | % | |
| 3.24 | % | |
| 2.92 | % | |
| 3.66 | % | |
| 5.08 | % |
See accompanying Notes to Financial Statements.
2024 Annual Report | November 30, 2024
| | |
Year
Ended
November 30,
2024 | |
Year
Ended
November 30,
2023 | |
Year
Ended
November 30,
2022 | |
Year
Ended
November 30,
2021 | |
Year
Ended
November 30,
2020 |
| Ratio of net investment income (loss) to average net assets before fee waiver | |
| 0.58 | % | |
| 0.18 | % | |
| (0.05 | )% | |
| (1.04 | )% | |
| (0.97 | )% |
| Ratio of net investment income (loss) to average net assets after fee waiver | |
| 0.99 | % | |
| 0.48 | % | |
| 0.24 | % | |
| (0.83 | )% | |
| (0.97 | )% |
| Portfolio turnover rate | |
| 4.82 | % | |
| 7.66 | % | |
| 8.20 | % | |
| 14.77 | % | |
| 35.61 | % |
| Credit facility borrowings, end of year (000's) | |
$ | 2,700 | | |
$ | 5,900 | | |
$ | 9,800 | | |
$ | 8,100 | | |
$ | — | |
| Senior notes, end of year (000's) | |
$ | 3,943 | | |
$ | 3,943 | | |
$ | 3,943 | | |
$ | 3,943 | | |
$ | 14,457 | |
| Preferred stock, end of year (000's) | |
$ | 6,100 | | |
$ | 6,100 | | |
$ | 6,100 | | |
$ | 6,100 | | |
$ | 6,100 | |
| Per common share amount of senior notes outstanding, end of year | |
$ | 1.96 | | |
$ | 1.96 | | |
$ | 1.86 | | |
$ | 1.77 | | |
$ | 6.00 | |
| Per common share amount of net assets, excluding senior notes, end of year | |
$ | 54.66 | | |
$ | 36.54 | | |
$ | 36.59 | | |
$ | 29.73 | | |
$ | 25.97 | |
| Asset coverage, per $1,000 of principal amount of senior notes and credit facility borrowings(5) | |
$ | 17,869 | | |
$ | 8,683 | | |
$ | 6,793 | | |
$ | 6,679 | | |
$ | 4,750 | |
| Asset coverage ratio of senior notes and credit facility borrowings(5) | |
| 1,787 | % | |
| 868 | % | |
| 679 | % | |
| 668 | % | |
| 475 | % |
| Asset coverage, per $25 liquidation value per share of mandatory redeemable preferred stock(6) | |
$ | 233 | | |
$ | 134 | | |
$ | 118 | | |
$ | 111 | | |
$ | 84 | |
| Asset coverage ratio of preferred stock(6) | |
| 932 | % | |
| 536 | % | |
| 470 | % | |
| 443 | % | |
| 334 | % |
| (1) |
Information presented relates to a share of common stock outstanding for the
entire year. |
| (2) |
During the year ended November 30, 2020, the Fund effected the following reverse
stock split: May 1, 2020, 1 for 4. All historical per share information has been retroactively adjusted to reflect this reverse stock
split. |
| (3) |
The per common share data for the years ended November 30, 2023, 2022, 2021,
and 2020 do not reflect the change in estimate of investment income and return of capital, for the respective year. See Note 2C to
the financial statements for further disclosure. |
| (4) |
Total investment return is calculated assuming a purchase of common stock at
the beginning of the year and a sale at the closing price on the last day of the year reported (excluding brokerage commissions).
The calculation also assumes reinvestment of distributions at actual prices pursuant to TTP’s dividend reinvestment plan. |
| (5) |
Represents value of total assets less all liabilities and indebtedness not represented
by senior notes, credit facility borrowings and preferred stock at the end of the year divided by senior notes and credit facility
borrowings outstanding at the end of the year. |
| (6) |
Represents value of total assets less all liabilities and indebtedness not represented
by senior notes, credit facility borrowings and preferred stock at the end of the year divided by senior notes, credit facility borrowings
and preferred stock outstanding at the end of the year. |
See accompanying Notes to Financial Statements.
NDP Financial Highlights
| | |
Year
Ended
November 30,
2024 | |
Year
Ended
November 30,
2023 | |
Year
Ended
November 30,
2022 | |
Year
Ended
November 30,
2021 | |
Year
Ended
November 30,
2020 |
| Per Common Share Data(1)(2) | |
| | | |
| | | |
| | | |
| | | |
| | |
| Net Asset Value, beginning of year | |
$ | 35.45 | | |
$ | 38.24 | | |
$ | 25.13 | | |
$ | 16.42 | | |
$ | 33.36 | |
| Income (Loss) from Investment Operations | |
| | | |
| | | |
| | | |
| | | |
| | |
| Net investment income (loss)(3) | |
| 0.17 | | |
| 0.44 | | |
| 0.80 | | |
| 0.13 | | |
| — | |
| Net realized and unrealized gain (loss)(3) | |
| 11.98 | | |
| (0.71 | ) | |
| 14.39 | | |
| 9.20 | | |
| (16.14 | ) |
| Total income (loss) from investment operations | |
| 12.15 | | |
| (0.27 | ) | |
| 15.19 | | |
| 9.33 | | |
| (16.14 | ) |
| Distributions to Common Stockholders | |
| | | |
| | | |
| | | |
| | | |
| | |
| From net investment income | |
| (0.43 | ) | |
| (0.75 | ) | |
| (0.82 | ) | |
| (0.05 | ) | |
| — | |
| From return of capital | |
| (2.09 | ) | |
| (1.77 | ) | |
| (1.26 | ) | |
| (0.57 | ) | |
| (0.80 | ) |
| Total distributions to common stockholders | |
| (2.52 | ) | |
| (2.52 | ) | |
| (2.08 | ) | |
| (0.62 | ) | |
| (0.80 | ) |
| Net Asset Value, end of year | |
$ | 45.08 | | |
$ | 35.45 | | |
$ | 38.24 | | |
$ | 25.13 | | |
$ | 16.42 | |
| Per common share market value, end of year | |
$ | 44.10 | | |
$ | 28.95 | | |
$ | 32.41 | | |
$ | 22.24 | | |
$ | 12.63 | |
| Total investment return based on market value(4) | |
| 63.28 | % | |
| (2.80 | )% | |
| 55.70 | % | |
| 81.36 | % | |
| (54.88 | )% |
| | |
| | | |
| | | |
| | | |
| | | |
| | |
| Supplemental Data and Ratios | |
| | | |
| | | |
| | | |
| | | |
| | |
| Net assets applicable to common stockholders, end of year (000's) | |
$ | 75,108 | | |
$ | 59,053 | | |
$ | 67,067 | | |
$ | 46,398 | | |
$ | 30,307 | |
| Average net assets (000's) | |
$ | 64,270 | | |
$ | 61,082 | | |
$ | 61,932 | | |
$ | 41,323 | | |
$ | 37,057 | |
| Ratio of Expenses to Average Net Assets | |
| | | |
| | | |
| | | |
| | | |
| | |
| Advisory fees | |
| 1.27 | % | |
| 1.23 | % | |
| 1.16 | % | |
| 1.20 | % | |
| 1.40 | % |
| Other operating expenses | |
| 1.00 | | |
| 0.70 | | |
| 0.54 | | |
| 1.04 | | |
| 1.18 | |
| Total operating expenses, before fee waiver | |
| 2.27 | | |
| 1.93 | | |
| 1.70 | | |
| 2.24 | | |
| 2.58 | |
| Fee waiver | |
| (0.71 | ) | |
| (0.42 | ) | |
| (0.28 | ) | |
| (0.22 | ) | |
| — | |
| Total operating expenses | |
| 1.56 | | |
| 1.51 | | |
| 1.42 | | |
| 2.02 | | |
| 2.58 | |
| Leverage expenses | |
| 0.97 | | |
| 0.79 | | |
| 0.18 | | |
| 0.16 | | |
| 0.66 | |
| Total expenses | |
| 2.53 | % | |
| 2.30 | % | |
| 1.60 | % | |
| 2.18 | % | |
| 3.24 | % |
See accompanying Notes to Financial Statements.
2024 Annual Report | November 30, 2024
| | |
Year
Ended
November 30,
2024 | |
Year
Ended
November 30,
2023 | |
Year
Ended
November 30,
2022 | |
Year
Ended
November 30,
2021 | |
Year
Ended
November 30,
2020 |
| Ratio of net investment income (loss) to average net assets before fee waiver | |
| (0.27 | )% | |
| 0.84 | % | |
| 2.09 | % | |
| 0.36 | % | |
| 0.03 | % |
| Ratio of net investment income (loss) to average net assets after fee waiver | |
| 0.45 | % | |
| 1.26 | % | |
| 2.37 | % | |
| 0.58 | % | |
| 0.03 | % |
| Portfolio turnover rate. | |
| 5.53 | % | |
| 14.33 | % | |
| 13.67 | % | |
| 53.15 | % | |
| 72.19 | % |
| Margin facility borrowings, end of period (000's) | |
$ | 11,600 | | |
$ | 8,800 | | |
$ | 3,700 | | |
$ | 2,700 | | |
$ | 5,000 | |
| Asset coverage, per $1,000 of principal amount of margin facility borrowings(5) | |
$ | 7,475 | | |
$ | 7,711 | | |
$ | 19,126 | | |
$ | 18,185 | | |
$ | 7,061 | |
| Asset coverage ratio of margin facility borrowings(5) | |
| 747 | % | |
| 771 | % | |
| 1,913 | % | |
| 1,818 | % | |
| 706 | % |
| (1) |
Information presented relates to a
share of common stock outstanding for the entire year. |
| (2) |
During the year ended November 30,
2020, the Fund effected the following reverse stock split: May 1, 2020, 1 for 8. All historical per share information has been retroactively
adjusted to reflect this reverse stock split. |
| (3) |
The per common share data for the
years ended November 30, 2023, 2022, 2021, and 2020 do not reflect the change in estimate of investment income and return of capital,
for the respective year. See Note 2C to the financial statements for further disclosure. |
| (4) |
Total investment return is calculated
assuming a purchase of common stock at the beginning of the year and a sale at the closing price on the last day of the year reported
(excluding brokerage commissions). The calculation also assumes reinvestment of distributions at actual prices pursuant to NDP’s
dividend reinvestment plan. |
| (5) |
Represents value of total assets less
all liabilities and indebtedness not represented by margin facility borrowings at the end of the year divided by margin facility
borrowings outstanding at the end of the year. |
See accompanying Notes to Financial Statements.
TPZ Financial Highlights
| | |
Year
Ended
November 30,
2024 | |
Year
Ended
November 30,
2023 | |
Year
Ended
November 30,
2022 | |
Year
Ended
November 30,
2021 | |
Year
Ended
November 30,
2020 |
| Per Common Share Data(1) | |
| | | |
| | | |
| | | |
| | | |
| | |
| Net Asset Value, beginning of year | |
$ | 16.25 | | |
$ | 15.85 | | |
$ | 15.09 | | |
$ | 13.01 | | |
$ | 17.70 | |
| Income (loss) from Investment Operations | |
| | | |
| | | |
| | | |
| | | |
| | |
| Net investment income(2) | |
| 0.28 | | |
| 0.32 | | |
| 0.24 | | |
| 0.23 | | |
| 0.35 | |
| Net realized and unrealized gain (loss)(2) | |
| 6.02 | | |
| 1.34 | | |
| 1.69 | | |
| 2.49 | | |
| (3.99 | ) |
| Total income (loss) from investment operations | |
| 6.30 | | |
| 1.66 | | |
| 1.93 | | |
| 2.72 | | |
| (3.64 | ) |
| Distributions to Common Stockholders | |
| | | |
| | | |
| | | |
| | | |
| | |
| From net investment income | |
| (0.34 | ) | |
| (0.62 | ) | |
| (0.29 | ) | |
| (0.28 | ) | |
| (0.60 | ) |
| From return of capital | |
| (0.92 | ) | |
| (0.64 | ) | |
| (0.88 | ) | |
| (0.36 | ) | |
| (0.45 | ) |
| Total distributions to common stockholders | |
| (1.26 | ) | |
| (1.26 | ) | |
| (1.17 | ) | |
| (0.64 | ) | |
| (1.05 | ) |
| Net Asset Value, end of year | |
$ | 21.29 | | |
$ | 16.25 | | |
$ | 15.85 | | |
$ | 15.09 | | |
$ | 13.01 | |
| Per common share market value, end of year | |
$ | 20.82 | | |
$ | 13.57 | | |
$ | 13.63 | | |
$ | 12.92 | | |
$ | 9.99 | |
| Total investment return based on market value(3) | |
| 65.78 | % | |
| 9.43 | % | |
| 14.87 | % | |
| 35.99 | % | |
| (29.23 | )% |
| | |
| | | |
| | | |
| | | |
| | | |
| | |
| Supplemental Data and Ratios | |
| | | |
| | | |
| | | |
| | | |
| | |
| Net assets applicable to common stockholders, end of year (000's) | |
$ | 125,389 | | |
$ | 95,724 | | |
$ | 98,245 | | |
$ | 98,462 | | |
$ | 89,426 | |
| Average net assets (000's) | |
$ | 105,348 | | |
$ | 96,134 | | |
$ | 101,421 | | |
$ | 100,853 | | |
$ | 93,027 | |
| Ratio of Expenses to Average Net Assets | |
| | | |
| | | |
| | | |
| | | |
| | |
| Advisory fees | |
| 1.17 | % | |
| 1.20 | % | |
| 1.18 | % | |
| 1.18 | % | |
| 1.28 | % |
| Other operating expenses | |
| 0.58 | | |
| 0.45 | | |
| 0.56 | | |
| 0.47 | | |
| 0.94 | |
| Total operating expenses, before fee waiver | |
| 1.75 | | |
| 1.65 | | |
| 1.74 | | |
| 1.65 | | |
| 2.22 | |
| Fee waiver | |
| — | | |
| — | | |
| — | | |
| — | | |
| — | |
| Total expenses | |
| 3.18 | % | |
| 2.70 | % | |
| 2.59 | % | |
| 2.47 | % | |
| 3.26 | % |
See accompanying Notes to Financial Statements.
2024 Annual Report | November 30, 2024
| | |
Year
Ended
November 30,
2024 | |
Year
Ended
November 30,
2023 | |
Year
Ended
November 30,
2022 | |
Year
Ended
November 30,
2021 | |
Year
Ended
November 30,
2020 |
| Ratio of net investment income to average net assets | |
| 1.59 | % | |
| 2.06 | % | |
| 1.53 | % | |
| 1.48 | % | |
| 2.61 | % |
| Portfolio turnover rate | |
| 13.32 | % | |
| 9.72 | % | |
| 4.85 | % | |
| 26.70 | % | |
| 29.95 | % |
| Margin facility borrowings, end of period (000's) | |
$ | 25,500 | | |
$ | 24,600 | | |
$ | 25,900 | | |
$ | 24,000 | | |
$ | 26,200 | |
| Asset coverage, per $1,000 of principal amount of senior notes and margin facility borrowings(4) | |
$ | 5,917 | | |
$ | 4,891 | | |
$ | 4,793 | | |
$ | 5,103 | | |
$ | 4,413 | |
| Asset coverage ratio of senior notes and margin facility borrowings(4) | |
| 592 | % | |
| 489 | % | |
| 479 | % | |
| 510 | % | |
| 441 | % |
| (1) |
Information presented relates to a
share of common stock outstanding for the entire year. |
| (2) |
The per common share data for the
years ended November 30, 2023, 2022, 2021, and 2020 do not reflect the change in estimate of investment income and return of capital,
for the respective year. See Note 2C to the financial statements for further disclosure. |
| (3) |
Total investment return is calculated
assuming a purchase of common stock at the beginning of the year and a sale at the closing price on the last day of the year reported
(excluding brokerage commissions). The calculation also assumes reinvestment of distributions at actual prices pursuant to TPZ’s
dividend reinvestment plan. |
| (4) |
Represents value of total assets less
all liabilities and indebtedness not represented by margin facility borrowings at the end of the year divided by margin facility
borrowings outstanding at the end of the year. |
See accompanying Notes to Financial Statements.
TEAF Financial Highlights
| | |
Year
Ended
November 30,
2024 | |
Year
Ended
November 30,
2023 | |
Year
Ended
November 30,
2022 | |
Year
Ended
November 30,
2021 | |
Year
Ended
November 30,
2020 |
| Per Common Share Data(1) | |
| | | |
| | | |
| | | |
| | | |
| | |
| Net Asset Value, beginning of year | |
$ | 14.84 | | |
$ | 16.37 | | |
$ | 17.15 | | |
$ | 15.85 | | |
$ | 17.60 | |
| Income (loss) from Investment Operations | |
| | | |
| | | |
| | | |
| | | |
| | |
| Net investment income | |
| 0.40 | | |
| 0.38 | | |
| 0.44 | | |
| 0.54 | | |
| 0.51 | |
| Net realized and unrealized gain (loss) | |
| 0.52 | | |
| (0.83 | ) | |
| (0.17 | ) | |
| 1.66 | | |
| (1.16 | ) |
| Total income (loss) from investment operations | |
| 0.92 | | |
| (0.45 | ) | |
| 0.27 | | |
| 2.20 | | |
| (0.65 | ) |
| Distributions to Common Stockholders | |
| | | |
| | | |
| | | |
| | | |
| | |
| From net investment income | |
| (0.52 | ) | |
| (0.35 | ) | |
| (0.46 | ) | |
| (0.64 | ) | |
| (0.46 | ) |
| From return of capital | |
| (0.56 | ) | |
| (0.73 | ) | |
| (0.59 | ) | |
| (0.26 | ) | |
| (0.64 | ) |
| Total distributions to common stockholders | |
| (1.08 | ) | |
| (1.08 | ) | |
| (1.05 | ) | |
| (0.90 | ) | |
| (1.10 | ) |
| Net Asset Value, end of year | |
$ | 14.68 | | |
$ | 14.84 | | |
$ | 16.37 | | |
$ | 17.15 | | |
$ | 15.85 | |
| Per common share market value, end of year | |
$ | 12.66 | | |
$ | 12.01 | | |
$ | 13.85 | | |
$ | 14.64 | | |
$ | 13.04 | |
| Total investment return based on market value(2) | |
| 15.28 | % | |
| (5.48 | )% | |
| 1.74 | % | |
| 19.50 | % | |
| (8.66 | )% |
| | |
| | | |
| | | |
| | | |
| | | |
| | |
| Supplemental Data and Ratios | |
| | | |
| | | |
| | | |
| | | |
| | |
| Net assets applicable to common stockholders, end of year (000's) | |
$ | 198,077 | | |
$ | 200,258 | | |
$ | 220,798 | | |
$ | 231,382 | | |
$ | 213,825 | |
| Average net assets (000's) | |
$ | 199,330 | | |
$ | 211,331 | | |
$ | 225,912 | | |
$ | 228,533 | | |
$ | 210,055 | |
| Ratio of Expenses to Average Net Assets | |
| | | |
| | | |
| | | |
| | | |
| | |
| Advisory fees | |
| 1.51 | % | |
| 1.54 | % | |
| 1.51 | % | |
| 1.53 | % | |
| 1.55 | % |
| Other operating expenses | |
| 0.47 | | |
| 0.29 | | |
| 0.38 | | |
| 0.33 | | |
| 0.37 | |
| Total operating expenses, before fee waiver | |
| 1.98 | | |
| 1.83 | | |
| 1.89 | | |
| 1.86 | | |
| 1.92 | |
| Fee waiver | |
| — | | |
| — | | |
| — | | |
| — | | |
| (0.10 | ) |
| Total operating expenses | |
| 1.98 | | |
| 1.83 | | |
| 1.89 | | |
| 1.86 | | |
| 1.82 | |
| Leverage expenses | |
| 0.77 | | |
| 0.84 | | |
| 0.31 | | |
| 0.13 | | |
| 0.23 | |
| Income tax expense (benefit)(3) | |
| — | | |
| (0.02 | ) | |
| (0.03 | ) | |
| (0.03 | ) | |
| 0.28 | |
| Total expenses | |
| 2.75 | % | |
| 2.65 | % | |
| 2.17 | % | |
| 1.96 | % | |
| 2.33 | % |
See accompanying Notes to Financial Statements.
2024 Annual Report | November 30, 2024
| | |
Year
Ended
November 30,
2024 | |
Year
Ended
November 30,
2023 | |
Year
Ended
November 30,
2022 | |
Year
Ended
November 30,
2021 | |
Year
Ended
November 30,
2020 |
| Ratio of net investment income to average net assets before fee waiver | |
| 2.74 | % | |
| 2.44 | % | |
| 2.62 | % | |
| 3.20 | % | |
| 3.16 | % |
| Ratio of net investment income to average net assets after fee waiver | |
| 2.74 | % | |
| 2.44 | % | |
| 2.62 | % | |
| 3.20 | % | |
| 3.26 | % |
| Portfolio turnover rate | |
| 24.36 | % | |
| 23.23 | % | |
| 18.08 | % | |
| 68.31 | % | |
| 73.22 | % |
| Margin facility borrowings, end of year (000's) | |
$ | 31,500 | | |
$ | 24,000 | | |
$ | 29,500 | | |
$ | 21,600 | | |
$ | 31,100 | |
| Asset coverage, per $1,000 of principal amount of senior notes and margin facility borrowings(4) | |
$ | 7,288 | | |
$ | 9,344 | | |
$ | 8,490 | | |
$ | 11,712 | | |
$ | 7,875 | |
| Asset coverage ratio of senior notes and margin facility borrowings(4) | |
| 729 | % | |
| 934 | % | |
| 849 | % | |
| 1,171 | % | |
| 788 | % |
| (1) |
Information presented relates to a
share of common stock outstanding for the entire year. |
| (2) |
Total investment return is calculated
assuming a purchase of common stock at the beginning of the year and a sale at the closing price on the last day of the year reported
(excluding brokerage commissions). The calculation also assumes reinvestment of distributions at actual prices pursuant to TEAF’s
dividend reinvestment plan. |
| (3) |
For the year ended November 30, 2024
TEAF had no net deferred tax accrual. For the year ended November 30, 2023 TEAF accrued $51,306 for net deferred income tax benefit.
For the year ended November 30, 2022 TEAF accrued $57,377 for net deferred income tax benefit. For the year ended November 31, 2021,
TEAF accrued $67,015 for net deferred income tax expense. For the year ended November 30, 2020, TEAF accrued $594,668 for net deferred
income tax expense. |
| (4) |
Represents value of total assets less
all liabilities and indebtedness not represented by margin facility borrowings at the end of the year divided by margin facility
borrowings outstanding at the end of the year. |
See accompanying Notes to Financial Statements.
Notes to Financial Statements
November 30, 2024
1. General Organization
This report covers the
following companies, each of which is listed on the New York Stock Exchange (“NYSE”): Tortoise Energy Infrastructure Corp.
(“TYG”), Tortoise Midstream Energy Fund, Inc. (“NTG”), Tortoise Pipeline & Energy Fund, Inc. (“TTP”),
Tortoise Energy Independence Fund, Inc. (“NDP”), Tortoise Power and Energy Infrastructure Fund, Inc. (“TPZ”),
and Tortoise Sustainable and Social Impact Term Fund (“TEAF) (formerly, Ecofin Sustainable and Social Impact Term Fund). These
companies are individually referred to as a “Fund” or by their respective NYSE symbols, or collectively as the “Funds”,
and each is a non-diversified, closed-end management investment company under the Investment Company Act of 1940, as amended (the “1940
Act”). Each of TYG, NTG, TTP, NDP and TEAF has a primary investment objective to seek a high level of total return with an emphasis
on current distributions. TPZ has a primary investment objective to provide a high level of current income, with a secondary objective
of capital appreciation.
2. Significant Accounting
Policies
The Funds are investment
companies and follow accounting and reporting guidance under Financial Accounting Standards Board Accounting Standards Codification (“ASC”)
Topic 946, “Financial Services-Investment Companies.” The following is a summary of significant accounting policies followed
by the Fund in the preparation of its financial statements. These policies are in conformity with generally accepted accounting principles
in the United States of America (“GAAP”).
A. Use of Estimates
The preparation of financial
statements in conformity with U.S. generally accepted accounting principles (“GAAP”) requires management to make estimates
and assumptions that affect the reported amount of assets and liabilities and disclosure of contingent assets and liabilities as of the
date of the financial statements, and the amount of income and expenses during the period reported. Actual results could differ from
those estimates.
B. Security Valuation
In general, and where
applicable, the Funds use readily available market quotations based upon the last updated sales price from the principal market to determine
fair value. The Funds primarily own securities that are listed on a securities exchange or are traded in the over-the-counter market.
The Funds value those securities at their last sale price on that exchange or over-the-counter market on the valuation date. If the security
is listed on more than one exchange, the Funds use the price from the exchange that it considers to be the principal exchange on which
the security is traded. If there has been no sale on such exchange or over-the-counter market on such day, the security is valued at
the mean between the last bid price and last ask price on such day. Securities listed on the NASDAQ are valued at the NASDAQ Official
Closing Price, which may not necessarily represent the last sale price. These securities are categorized as Level 1 in the fair value
hierarchy.
Restricted securities
are subject to statutory or contractual restrictions on their public resale, which may make it more difficult to obtain a valuation and
may limit a Fund’s ability to dispose of them. Investments in private placement securities and other securities for which market
quotations are not readily available are valued in good faith by using fair value procedures. Such fair value procedures consider factors
such as discounts to publicly traded issues, time until conversion date, securities with similar yields, quality, type of issue, coupon,
duration and rating. If events occur that affect the value of a Fund’s portfolio securities before the net asset value has been
calculated (a “significant event”), the portfolio securities so affected are generally priced using fair value procedures.
An equity security of
a publicly traded company acquired in a private placement transaction without registration under the Securities Act of 1933, as amended
(the “1933 Act”), is subject to restrictions on resale that can affect the security’s liquidity and fair value. If
such a security is convertible into publicly traded common shares, the security generally will be valued at the common share market price
adjusted by a percentage discount due to the restrictions and categorized as Level 2 in the fair value hierarchy. To the extent that
such securities are convertible or otherwise become freely tradable within a time frame that may be reasonably determined, an amortization
schedule may be used to determine the discount. If the security has characteristics that are dissimilar to the class of security that
trades on the open market, the security will generally be valued and categorized as Level 3 in the fair value hierarchy.
Unobservable inputs are
used to measure fair value to the extent that observable inputs are not available, thereby allowing for situations in which there is
little, if any, market activity. Unobservable inputs reflect the Funds’ own beliefs about the assumptions that market participants
would use in pricing the asset or liability (including assumptions about risk). Unobservable inputs are developed based on the best information
available in the circumstances, which might include the Fund’s own data. The Fund’s own data are adjusted if information
is reasonably available without undue cost and effort that indicates that market participants would use different assumptions. Due to
the inherent uncertainty of valuations of such investments, the fair values may differ significantly from the values that would have
been used had an active market existed.
Options (including options
on futures contracts) and futures contracts are valued using readily available market quotations. Exchange-traded options are valued
at the last reported sale price on any exchange on which they trade. If there are no sales reported on any exchange, exchange-traded
options shall be valued at the mean between the last highest bid and last lowest asked prices obtained as of the closing of the exchanges
on which the option is traded. Exchange-traded domestic futures contracts are valued at the last reported sale price on the Chicago Mercantile
Exchange. Exchange-traded foreign futures contracts are valued at the last reported sale price on the primary foreign exchange on which
they principally trade. The value of Flexible Exchange Options (FLEX Options) are determined (i) by an evaluated price as determined
by a third-party valuation service; or (ii) by using a quotation provided by a broker-dealer.
2024 Annual
Report | November 30, 2024
Notes to Financial Statements (continued)
The Funds generally value
debt securities at evaluated prices obtained from an independent third-party valuation service that utilizes a pricing matrix based upon
yield data for securities with similar characteristics, or based on a direct written broker-dealer quotation from a dealer who has made
a market in the security. Debt securities with 60 days or less to maturity at time of purchase are valued on the basis of amortized cost,
which approximates fair value. The securities are categorized as level 2 in the fair value hierarchy.
Interest rate swap contracts
are valued by using industry-accepted models, which discount the estimated future cash flows based on a forward rate curve and the stated
terms of the interest rate swap agreement by using interest rates currently available in the market, or based on dealer quotations, if
available, and are categorized as Level 2 in the fair value hierarchy.
Various inputs are used
in determining the fair value of the Funds’ investments and financial instruments. These inputs are summarized in the three broad
levels listed below:
Level
1 — quoted prices in active markets for identical investments
Level
2 — other significant observable inputs (including quoted prices for similar investments, market corroborated inputs, etc.)
Level
3 — significant unobservable inputs (including a Fund’s own assumptions in determining the fair value of investments)
The inputs or methodologies
used for valuing securities are not necessarily an indication of the risk associated with investing in those securities.
The following
tables provide the fair value measurements of applicable assets and liabilities by level within the fair value hierarchy as of November 30, 2024.
These assets and liabilities are measured on a recurring basis.
| TYG: | |
| | |
| | |
| | |
| |
| Description | |
Level
1 | | |
Level
2 | | |
Level
3 | | |
Total | |
| Assets | |
| | | |
| | | |
| | | |
| | |
| Investments: | |
| | | |
| | | |
| | | |
| | |
| Common Stock(a) | |
$ | 551,946,673 | | |
$ | — | | |
$ | — | | |
$ | 551,946,673 | |
| Master Limited Partnerships(a) | |
| 133,489,987 | | |
| — | | |
| — | | |
| 133,489,987 | |
| Private Investment(a) | |
| — | | |
| — | | |
| 2,444,516 | | |
| 2,444,516 | |
| Short-Term Investment(b) | |
| 288,521 | | |
| — | | |
| — | | |
| 288,521 | |
| Total Assets | |
$ | 685,725,181 | | |
$ | — | | |
$ | 2,444,516 | | |
$ | 688,169,697 | |
| | |
| | | |
| | | |
| | | |
| | |
| NTG: | |
| | |
| | |
| | |
| |
| Description | |
Level
1 | | |
Level
2 | | |
Level
3 | | |
Total | |
| Assets | |
| | | |
| | | |
| | | |
| | |
| Investments: | |
| | | |
| | | |
| | | |
| | |
| Common Stock(a) | |
$ | 315,281,610 | | |
$ | — | | |
$ | — | | |
$ | 315,281,610 | |
| Master Limited Partnerships(a) | |
| 87,120,747 | | |
| — | | |
| — | | |
| 87,120,747 | |
| Short-Term Investment(b) | |
| 349,588 | | |
| — | | |
| — | | |
| 349,588 | |
| Total Assets | |
$ | 402,751,945 | | |
$ | — | | |
$ | — | | |
$ | 402,751,945 | |
| | |
| | | |
| | | |
| | | |
| | |
| TTP: | |
| | | |
| | | |
| | | |
| | |
| Description | |
Level
1 | | |
Level
2 | | |
Level
3 | | |
Total | |
| Assets | |
| | | |
| | | |
| | | |
| | |
| Investments: | |
| | | |
| | | |
| | | |
| | |
| Common Stock(a) | |
$ | 95,149,687 | | |
$ | — | | |
$ | — | | |
$ | 95,149,687 | |
| Master Limited Partnerships(a) | |
| 21,884,534 | | |
| — | | |
| — | | |
| 21,884,534 | |
| Total Assets | |
$ | 117,034,221 | | |
$ | — | | |
$ | — | | |
$ | 117,034,221 | |
| | |
| | | |
| | | |
| | | |
| | |
| NDP: | |
| | | |
| | | |
| | | |
| | |
| Description | |
Level
1 | | |
Level
2 | | |
Level
3 | | |
Total | |
| Assets | |
| | | |
| | | |
| | | |
| | |
| Investments: | |
| | | |
| | | |
| | | |
| | |
| Common Stock(a) | |
$ | 72,468,742 | | |
$ | — | | |
$ | — | | |
$ | 72,468,742 | |
| Master Limited Partnerships(a) | |
| 13,838,974 | | |
| — | | |
| — | | |
| 13,838,974 | |
| Total Assets | |
$ | 86,307,716 | | |
$ | — | | |
$ | — | | |
$ | 86,307,716 | |
Notes to Financial Statements (continued)
| TPZ: | |
| | |
| | |
| | |
| |
| Description | |
Level
1 | | |
Level
2 | | |
Level
3 | | |
Total | |
| Assets | |
| | | |
| | | |
| | | |
| | |
| Investments: | |
| | | |
| | | |
| | | |
| | |
| Corporate Bonds(a) | |
$ | — | | |
$ | 60,074,144 | | |
$ | — | | |
$ | 60,074,144 | |
| Common Stock(a) | |
| 58,583,779 | | |
| — | | |
| — | | |
| 58,583,779 | |
| Master Limited Partnerships(a) | |
| 31,193,292 | | |
| — | | |
| — | | |
| 31,193,292 | |
| Total Assets | |
$ | 89,777,071 | | |
$ | 60,074,144 | | |
$ | — | | |
$ | 149,851,215 | |
| | |
| | | |
| | | |
| | | |
| | |
| TEAF: | |
| | | |
| | | |
| | | |
| | |
| Description | |
Level 1 | | |
Level 2 | | |
Level 3 | | |
Total | |
| Assets | |
| | | |
| | | |
| | | |
| | |
| Investments: | |
| | | |
| | | |
| | | |
| | |
| Common Stock(a) | |
$ | 98,042,189 | | |
$ | — | | |
$ | — | | |
$ | 98,042,189 | |
| Private Investments(a) | |
| — | | |
| — | | |
| 41,430,975 | | |
| 41,430,975 | |
| Corporate Bonds(a) | |
| — | | |
| 15,848,070 | | |
| 306,931 | | |
| 16,155,001 | |
| Municipal Bonds(a) | |
| — | | |
| 53,731,486 | | |
| — | | |
| 53,731,486 | |
| Master Limited Partnerships(a) | |
| 14,558,505 | | |
| — | | |
| — | | |
| 14,558,505 | |
| Private Notes(a) | |
| — | | |
| — | | |
| 3,653,559 | | |
| 3,653,559 | |
| Short-Term Investment(b) | |
| 503,646 | | |
| — | | |
| — | | |
| 503,646 | |
| Total Assets | |
$ | 113,104,340 | | |
$ | 69,579,556 | | |
$ | 45,391,465 | | |
$ | 228,075,361 | |
| (a) |
All other industry classifications are identified in the Schedule of Investments. |
| (b) |
Short-term investment is a sweep investment for cash balances. |
The following tables present each Fund’s
assets measured at fair value on a recurring basis using significant unobservable inputs (Level 3) for the year ended November 30,
2024:
| Preferred Stock | |
TYG | | |
NTG | | |
TTP | | |
NDP | | |
TPZ | | |
TEAF | |
| Balance — beginning of period | |
$ | — | | |
$ | — | | |
$ | — | | |
$ | — | | |
$ | — | | |
$ | 4,769,400 | |
| Purchases | |
| — | | |
| — | | |
| — | | |
| — | | |
| — | | |
| — | |
| Return of capital | |
| — | | |
| — | | |
| — | | |
| — | | |
| — | | |
| — | |
| Sales | |
| — | | |
| — | | |
| — | | |
| — | | |
| — | | |
| (4,850,000 | ) |
| Total realized gain/loss | |
| — | | |
| — | | |
| — | | |
| — | | |
| — | | |
| (728,732 | ) |
| Change in unrealized gain/loss | |
| — | | |
| — | | |
| — | | |
| — | | |
| — | | |
| 809,332 | |
| Balance — end of period | |
$ | — | | |
$ | — | | |
$ | — | | |
$ | — | | |
$ | — | | |
$ | — | |
| | |
| | | |
| | | |
| | | |
| | | |
| | | |
| | |
| Private
Investments | |
TYG | | |
NTG | | |
TTP | | |
NDP | | |
TPZ | | |
TEAF | |
| Balance — beginning of period | |
$ | 14,550,615 | | |
$ | — | | |
$ | — | | |
$ | — | | |
$ | — | | |
$ | 50,403,458 | |
| Purchases | |
| 900,000 | | |
| — | | |
| — | | |
| — | | |
| — | | |
| 1,553,483 | |
| Return of capital | |
| — | | |
| — | | |
| — | | |
| — | | |
| — | | |
| | |
| Sales | |
| — | | |
| — | | |
| — | | |
| — | | |
| — | | |
| — | |
| Total realized gain/loss | |
| — | | |
| — | | |
| — | | |
| — | | |
| — | | |
| — | |
| Change in unrealized gain/loss | |
| (13,006,099 | ) | |
| — | | |
| — | | |
| — | | |
| — | | |
| (10,525,966 | ) |
| Balance — end of period | |
$ | 2,444,516 | | |
$ | — | | |
$ | — | | |
$ | — | | |
$ | — | | |
$ | 41,430,975 | |
2024 Annual
Report | November 30, 2024
Notes to Financial Statements (continued)
| Bank
Loans | |
TYG | | |
NTG | | |
TTP | | |
NDP | | |
TPZ | | |
TEAF | |
| Balance — beginning of period | |
$ | — | | |
$ | — | | |
$ | — | | |
$ | — | | |
$ | — | | |
$ | 503,725 | |
| Transfers into level 3 | |
| — | | |
| — | | |
| — | | |
| — | | |
| — | | |
| — | |
| Purchases | |
| — | | |
| — | | |
| — | | |
| — | | |
| — | | |
| — | |
| Return of capital | |
| — | | |
| — | | |
| — | | |
| — | | |
| — | | |
| — | |
| Sales | |
| — | | |
| — | | |
| — | | |
| — | | |
| — | | |
| (438,049 | ) |
| Total realized gain/loss | |
| — | | |
| — | | |
| — | | |
| — | | |
| — | | |
| (361,951 | ) |
| Change in unrealized gain/loss | |
| — | | |
| — | | |
| — | | |
| — | | |
| — | | |
| 296,275 | |
| Balance — end of period | |
$ | — | | |
$ | — | | |
$ | — | | |
$ | — | | |
$ | — | | |
$ | — | |
| | |
| | | |
| | | |
| | | |
| | | |
| | | |
| | |
| Corporate
Bonds | |
TYG | | |
NTG | | |
TTP | | |
NDP | | |
TPZ | | |
TEAF | |
| Balance — beginning of period | |
$ | — | | |
$ | — | | |
$ | — | | |
$ | — | | |
$ | — | | |
$ | 3,976,106 | |
| Transfers into level 3 | |
| — | | |
| — | | |
| — | | |
| — | | |
| — | | |
| — | |
| Purchases | |
| — | | |
| — | | |
| — | | |
| — | | |
| — | | |
| — | |
| Return of capital | |
| — | | |
| — | | |
| — | | |
| — | | |
| — | | |
| — | |
| Sales | |
| — | | |
| — | | |
| — | | |
| — | | |
| — | | |
| — | |
| Total realized gain/loss | |
| — | | |
| — | | |
| — | | |
| — | | |
| — | | |
| — | |
| Change in unrealized gain/loss | |
| — | | |
| — | | |
| — | | |
| — | | |
| — | | |
| (3,669,175 | ) |
| Balance — end of period | |
$ | — | | |
$ | — | | |
$ | — | | |
$ | — | | |
$ | — | | |
$ | 306,931 | |
| | |
| | | |
| | | |
| | | |
| | | |
| | | |
| | |
| Private
Notes | |
TYG | | |
NTG | | |
TTP | | |
NDP | | |
TPZ | | |
TEAF | |
| Balance — beginning of period | |
$ | — | | |
$ | — | | |
$ | — | | |
$ | — | | |
$ | — | | |
$ | 13,441,698 | |
| Purchases | |
| — | | |
| — | | |
| — | | |
| — | | |
| — | | |
| — | |
| Return of capital | |
| — | | |
| — | | |
| — | | |
| — | | |
| — | | |
| — | |
| Sales | |
| — | | |
| — | | |
| — | | |
| — | | |
| — | | |
| (9,792,000 | ) |
| Total realized gain/loss | |
| — | | |
| — | | |
| — | | |
| — | | |
| — | | |
| 192,000 | |
| Change in unrealized gain/loss | |
| — | | |
| — | | |
| — | | |
| — | | |
| — | | |
| (188,139 | ) |
| Balance — end of period | |
$ | — | | |
$ | — | | |
$ | — | | |
$ | — | | |
$ | — | | |
$ | 3,653,559 | |
| | |
| | | |
| | | |
| | | |
| | | |
| | | |
| | |
| | |
TYG | | |
NTG | | |
TTP | | |
NDP | | |
TPZ | | |
TEAF | |
| Change in unrealized gain/loss on investments still held at November 30, 2024 | |
$ | (13,006,099 | ) | |
$ | — | | |
$ | — | | |
$ | — | | |
$ | — | | |
$ | (13,277,673 | ) |
| | |
| | | |
| | | |
| | | |
| | | |
| | | |
| | |
TEAF owns units of preferred stock
of One Power Company (“One Power Company Pfd”) that were issued in a private transaction that closed on April 12, 2023. One
Power Company, formerly One Energy Enterprises Inc., is a private company. The preferred stock carries a conversion option into common
stock on and after the earlier to occur of (i) the closing of a DeSPAC, (ii) the consummation of an IPO or (iii) the effectiveness of
a direct listing in which the Common Stock becomes listed on a national securities exchange (such date the “Initial Liquidity Date”).
A discounted cash flow model prepared by an independent third party is being used to determine fair value of the One Energy Pfd security.
Unobservable inputs used to determine the discount rate include a debt discount rate that generally reflects the credit worthiness of
the company. An increase (decrease) in the debt discount rate would lead to a corresponding decrease (increase) in fair value of the preferred
stock.
TEAF owns units of Mexico Pacific
Limited LLC (“MPL”), which was issued in a private transaction that closed on October 23, 2019. As of November 30, 2024, the
investment in MPL was valued at the most recent transaction price, which was a capital raise that closed on September 30, 2021, as the
company is still in development with no day-to-day operations.
TEAF owns a private note in Saturn
Solar Bermuda 1, Ltd (“Saturn”). Under the terms of the note, Saturn pays interest monthly at an annual rate of 10%. A discounted
cash flows model is being utilized to determine fair value of the private note. Unobservable inputs used to determine the discount rate
include a risk spread based on similar projects and an illiquidity spread due to the note being issued in the private market. An increase
(decrease) in the risk spread or illiquidity spread would lead to a corresponding decrease (increase) in fair value of the note.
TYG wholly-owns private investments
in TK NYS Solar Holdco, LLC and TEAF wholly-owns private investments in Renewable Holdco, LLC, Renewable Holdco I, LLC, and Renewable
Holdco II, LLC. Discounted cash flow models are being utilized in conjunction with a market approach based on recent bids on the underlying
assets to determine the fair value of these holdings wherein 75% of the concluded value is weighted towards the market approach and 25%
is weighted towards the income approach discounted cash flow model. Unobservable inputs used within the discounted cash flow models include
weighted average cost of capital and unobservable inputs used in the market approach include bid values. An increase (decrease) in the
weighted average cost of capital would lead to a corresponding decrease (increase) in the fair value of the private investment. An increase
(decrease) in the bid value would lead to a corresponding increase (decrease) in the fair value of the private investment.
Notes to Financial Statements (continued)
TEAF owns a private corporate bond
in Contour Propco. A discounted cash flows model is being utilized to determine fair value of the private bond. Unobservable inputs used
to determine the discount rate include a risk spread based on similar projects and an illiquidity spread due to the bond being issued
in the private market and unobservable inputs used for the final cash flow expected from the bond. An increase (decrease) in the risk
spread or illiquidity spread would lead to a corresponding decrease (increase) in fair value of the bond.
The following tables summarize the
fair value and significant unobservable inputs that each Fund used to value its portfolio investments categorized as Level 3 as of November
30, 2024:
| Assets at Fair Value | |
TYG | | |
NTG | | |
TTP | | |
NDP | | |
TPZ | | |
TEAF | |
| Private Notes | |
$ | — | | |
$ | — | | |
$ | — | | |
$ | — | | |
$ | — | | |
$ | 3,653,559 | |
| Corporate Bonds | |
$ | — | | |
$ | — | | |
$ | — | | |
$ | — | | |
$ | — | | |
$ | 306,931 | |
| Private Investments | |
$ | 2,444,516 | | |
$ | — | | |
$ | — | | |
$ | — | | |
$ | — | | |
$ | 41,430,975 | |
| Assets
at Fair Value | |
Valuation Technique | |
Unobservable Inputs | |
Input | |
| Private Investment (One Power Company Pfd) | |
Lattice model | |
Debt discount rate | |
| 29.2 | % |
| Private Investment (TK NYS Solar Holdco, LLC) | |
Discounted cash flow model | |
Post-contracted weighted average cost of capital | |
| 10.00 | % |
| Private Investment (TK NYS Solar Holdco, LLC) | |
Discounted cash flow model | |
Contracted weighted average cost of capital | |
| 9.00 | % |
| Private Investment (TK NYS Solar Holdco, LLC) | |
Market approach | |
Indicative bids | |
$ | 36.2 - $45.3mm | |
| Private Investment (Mexico Pacific Limited) | |
Recent transaction | |
Purchase price | |
$ | 21.94 | |
| Private Investment (Renewable Holdco, LLC) | |
Recent transaction | |
Purchase price | |
$ | 7,027,351 | |
| Private Investment (Renewable Holdco I, LLC) | |
Discounted cash flow model | |
Contracted weighted average cost of capital | |
| 9.00% - 9.75 | % |
| Private Investment (Renewable Holdco I, LLC) | |
Discounted cash flow model | |
Post-contracted weighted average cost of capital | |
| 10.00% - 11.00 | % |
| Private Investment (Renewable Holdco I, LLC) | |
Market approach | |
Indicative bids | |
$ | 5.6 - $11.9mm | |
| Private Investment (Renewable Holdco II, LLC) | |
Discounted cash flow model | |
Contracted weighted average cost of capital | |
| 9.25 | % |
| Private Investment (Renewable Holdco II, LLC) | |
Discounted cash flow model | |
Post-contracted weighted average cost of capital | |
| 10.00 | % |
| Private Investment (Renewable Holdco II, LLC) | |
Market approach | |
Indicative bids | |
$ | 6.3 - $9.3mm | |
| Saturn Bermuda Note | |
Discounted cash flow model | |
Risk spread | |
| 1.7500 | % |
| Saturn Bermuda Note | |
Discounted cash flow model | |
Illiquidity spread | |
| 1.7255 | % |
| Contour Propco | |
Discounted cash flow model | |
Discount Rate | |
| 17.00 | % |
| Contour Propco | |
Discounted cash flow model | |
Final distribution quote | |
$ | 5.37 | |
C. Securities Transactions and
Investment Income
Securities transactions are accounted
for on the date the securities are purchased or sold (trade date). Realized gains and losses are reported on an identified cost basis.
Interest income is recognized on the accrual basis, including amortization of premiums and accretion of discounts. Discounts and premiums
on fixed income securities are amortized or accreted over the life of the respective securities using the effective interest method. Dividend
income and distributions are recorded on the ex-dividend date. Distributions received from investments generally are comprised of ordinary
income and return of capital. The Funds estimate the allocation of distributions between investment income and return of capital at the
time such distributions are received based on historical information or regulatory filings. These estimates may subsequently be revised
based on actual allocations received from the portfolio companies after their tax reporting periods are concluded, as the actual character
of these distributions is not known until after the fiscal year-end of the Funds.
Subsequent to November 30, 2023,
the Funds reallocated the amount of return of capital recognized for the period from December 1, 2022 through November 30, 2023 based
on the 2023 tax reporting information received. The impact of this reclass is as follows:
| | |
Estimated
Return
of Capital % | |
Revised
Return
of Capital % | |
Increase/(Decrease)
in Return of Capital | |
| TYG | |
48% | |
51% | |
$ | 814,394 | |
| NTG | |
52% | |
57% | |
$ | 855,789 | |
| TTP | |
53% | |
51% | |
$ | (100,821 | ) |
| NDP | |
32% | |
36% | |
$ | 137,444 | |
| TPZ | |
72% | |
69% | |
$ | (115,875 | ) |
| TEAF | |
37% | |
37% | |
$ | (2,281 | ) |
In addition, the Funds may be subject
to withholding taxes on foreign-sourced income. The Funds accrue such taxes when the related income is earned in accordance with the Funds’
understanding of the applicable country’s tax rules and rates.
2024 Annual
Report | November 30, 2024
Notes to Financial Statements (continued)
D. Foreign Currency Translation
For foreign currency, investments
in foreign securities, and other assets and liabilities denominated in a foreign currency, the Funds translate these amounts into U.S.
dollars on the following basis: (i) market value of investment securities, assets and liabilities at the current rate of exchange on the
valuation date, and (ii) purchases and sales of investment securities, income and expenses at the relevant rates of exchange on the respective
dates of such transactions. The Funds do not isolate the portion of gains and losses on investments that is due to changes in the foreign
exchange rates from that which is due to changes in market prices of securities.
E. Federal and State Income Taxation
TYG, NTG, TTP, NDP, TPZ and TEAF
each qualify as a regulated investment company (“RIC”) under the Internal Revenue Code (“IRC”). As a result, TYG,
NTG, TTP, NDP, TPZ and TEAF generally will not be subject to U.S. federal income tax on income and gains that they distribute each taxable
year to stockholders if they meet certain minimum distribution requirements. However, TEAF’s taxable subsidiary, created to hold
certain investments is generally subject to federal and state income taxes on its income. RICs are required to distribute substantially
all of their income, in addition to meeting certain asset diversification requirements, and are subject to a 4% non-deductible U.S. federal
excise tax on certain undistributed income unless the fund makes sufficient distributions to satisfy the excise tax avoidance requirement.
The Funds recognize the tax benefits
of uncertain tax positions only when the position is “more likely than not” to be sustained upon examination by the tax authorities
based on the technical merits of the tax position. The Funds’ policy is to record interest and penalties on uncertain tax positions
as part of tax expense.
As of November 30, 2024, TYG, NTG,
TTP, NDP, TPZ, and TEAF had no uncertain tax positions, and no penalties or interest was accrued. The Funds do not expect any change in
their unrecognized tax positions in the next twelve months. The tax years ended on the following dates remain open to examination by federal
and state tax authorities:
TYG, NTG, TTP, NDP, TPZ and TEAF
– November 30, 2021 through 2024
F. Distributions to Stockholders
Distributions to common stockholders
are recorded on the ex-dividend date. The Funds may not declare or pay distributions to its common stockholders if it does not meet asset
coverage ratios required under the 1940 Act or the rating agency guidelines for its debt and preferred stock following such distribution.
The amount of any distributions will be determined by the Board of Directors. The character of distributions to common stockholders made
during the year may differ from their ultimate characterization for federal income tax purposes.
As RICs, TYG, NTG, TTP, NDP, TPZ
and TEAF each intend to make cash distributions of its investment company taxable income and capital gains to common stockholders. In
addition, on an annual basis, TYG, NTG, TTP, NDP, TPZ and TEAF each may distribute additional capital gains in the last calendar quarter
if necessary to meet minimum distribution requirements and thus avoid being subject to excise taxes. Distributions paid to stockholders
in excess of investment company taxable income and net realized gains will be treated as return of capital to stockholders.
Distributions to mandatory redeemable
preferred (“MRP”) stockholders are accrued daily based on applicable distribution rates for each series and paid periodically
according to the terms of the agreements. The Funds may not declare or pay distributions to its preferred stockholders if it does not
meet a 200% asset coverage ratio for its debt or the rating agency basic maintenance amount for the debt following such distribution.
The character of distributions to preferred stockholders made during the year may differ from their ultimate characterization for federal
income tax purposes.
Distributions to stockholders for
the year ended November 30, 2024 were characterized as follows:
| | |
TYG | | |
NTG | | |
TTP | | |
NDP | | |
TPZ | | |
TEAF | |
| | |
Common | | |
Preferred | | |
Common | | |
Preferred | | |
Common | | |
Preferred | | |
Common | | |
Common | | |
Common | |
| Qualified
dividend income | |
| 15 | % | |
| 100 | % | |
| 11 | % | |
| 100 | % | |
| 14 | % | |
| 100 | % | |
| 17 | % | |
| 18 | % | |
| 18 | % |
| Ordinary dividend
income | |
| — | | |
| — | | |
| — | | |
| — | | |
| — | | |
| — | | |
| — | | |
| 9 | % | |
| 31 | % |
| Return of capital | |
| 85 | % | |
| — | | |
| 89 | % | |
| — | | |
| 86 | % | |
| — | | |
| 83 | % | |
| 73 | % | |
| 51 | % |
| Long-term capital
gain | |
| — | | |
| — | | |
| — | | |
| — | | |
| — | | |
| — | | |
| — | | |
| — | | |
| — | |
| * |
For Federal income tax purposes, distributions
of short-term capital gains are included in qualified dividend income. |
G. Offering and Debt Issuance
Costs
Offering costs related to the issuance
of common stock are charged to additional paid-in capital when the stock is issued. Debt issuance costs related to senior notes and MRP
Stock are deferred and amortized over the period the debt or MRP Stock is outstanding. Offering costs related to the issuance of common
stock in prior years are amortized and included on the statement of operations.
There were no offering or debt issuance
costs recorded during the year December 1, 2023 through November 30, 2024 for TYG, NTG, TTP, NDP, TPZ or TEAF.
Notes to Financial Statements (continued)
H.
Derivative Financial Instruments
The
Funds have established policies and procedures for risk assessment and the approval, reporting and monitoring of derivative financial
instrument activities. The Funds do not hold or issue derivative financial instruments for speculative purposes. All derivative financial
instruments are recorded at fair value with changes in fair value during the reporting period, and amounts accrued under the agreements,
included as unrealized gains or losses in the accompanying Statements of Operations. Derivative instruments that are subject to an enforceable
master netting arrangement allow a Fund and the counterparty to the instrument to offset any exposure to the other party with amounts
owed to the other party. The fair value of derivative financial instruments in a loss position are offset against the fair value of derivative
financial instruments in a gain position, with the net fair value appropriately reflected as an asset or liability within the accompanying
Statements of Assets & Liabilities.
TYG, NTG, TTP, NDP and
TEAF may seek to provide current income from gains earned through an option strategy that normally consists of writing (selling) call
options on selected equity securities held in the portfolio (“covered calls”). The premium received on a written call option
is initially recorded as a liability and subsequently adjusted to the then current fair value of the option written. Premiums received
from writing call options that expire unexercised are recorded as a realized gain on the expiration date. Premiums received from writing
call options that are exercised are added to the proceeds from the sale of the underlying security to calculate the realized gain (loss).
If a written call option is repurchased prior to its exercise, the realized gain (loss) is the difference between the premium received
and the amount paid to repurchase the option.
TEAF may enter into forward
currency contracts, which represent agreements to exchange currencies on specific future dates at predetermined rates. TEAF uses forward
currency contracts to manage exposure to changes in exchange rates. On a daily basis, TEAF’s investment adviser values forward
currency contracts and records unrealized appreciation or depreciation for open forward currency contracts in the Statements of Assets
& Liabilities. Realized gains or losses are recorded at the time the forward currency contracts are closed. TEAF did not enter into
any forward currency contracts during the period ended November 30, 2024.
I.
Indemnifications
Under
each of the Funds’ organizational documents, its officers and directors are indemnified against certain liabilities arising out
of the performance of their duties to the Funds. In addition, in the normal course of business, the Funds may enter into contracts that
provide general indemnification to other parties. A Fund’s maximum exposure under these arrangements is unknown, as this would
involve future claims that may be made against the Funds that have not yet occurred, and may not occur. However, the Funds have not had
prior claims or losses pursuant to these contracts and expect the risk of loss to be remote.
J.
Cash and Cash Equivalents
Cash
and cash equivalents include short-term, liquid investments with an original maturity of three months or less and money market fund accounts.
K.
Recent Accounting and Regulatory Updates
The
FASB issued final guidance (ASU No. 2022-08) to clarify that a contractual restriction on the sale of an equity security is not considered
part of the unit of account of the equity security and, therefore, is not considered when measuring fair value. Recognizing a contractual
restriction on the sale of an equity security as a separate unit of account is not permitted. The guidance applies to all entities that
have investments in equity securities measured at fair value that are subject to contractual sale restrictions. Entities that hold equity
securities subject to contractual sale restrictions are required to make additional disclosures. The guidance will be applied prospectively,
with special transition provisions for entities that qualify as investment companies under ASC 946. For public business entities, the
guidance is effective for fiscal years beginning after 15 December 2023, and interim periods within those fiscal years. Management is
currently assessing the potential impact of the new guidance on the Funds’ financial statements.
In November 2023, the
FASB issued ASU No. 2023-07 Segment Reporting (Topic 280); Improvements to Reportable Segment Disclosures, which improves reportable
segment disclosure requirements, primarily through enhanced disclosures about significant segment expenses. The ASU is effective for
fiscal years beginning after December 15, 2023, and interim periods within fiscal years beginning after December 15, 2024. Management
is currently evaluating the impact of applying the ASU to the Funds’ financial statements.
3. Risks and Uncertainties
TYG,
NTG, TTP, NDP and TPZ concentrate their investments in the energy sector. TEAF concentrates its investments in issuers operating in essential
asset sectors. Funds that primarily invest in a particular sector may experience greater volatility than companies investing in a broad
range of industry sectors. A Fund may, for defensive purposes, temporarily invest all or a significant portion of its assets in investment
grade securities, short-term debt securities and cash or cash equivalents. To the extent a Fund uses this strategy, it may not achieve
its investment objective.
2024 Annual Report | November
30, 2024
Notes to Financial Statements (continued)
4. Agreements
The Funds have each entered into an Investment Advisory
Agreement with Tortoise Capital Advisors, L.L.C. (the “Adviser”). The Funds each pay the Adviser a fee based on the Fund’s
average monthly total assets (including any assets attributable to leverage and excluding any net deferred tax asset) minus accrued liabilities
(other than net deferred tax liability, debt entered into for purposes of leverage and the aggregate liquidation preference of outstanding
preferred stock) (“Managed Assets”), in exchange for the investment advisory services provided. Average monthly Managed Assets
is the sum of the daily Managed Assets for the month divided by the number of days in the month. Accrued liabilities are expenses incurred
in the normal course of each Fund’s operations. Waived fees are not subject to recapture by the Adviser. The annual fee rates paid
to the Adviser as of November 30, 2024 are as follows:
TYG
— 0.95% up to $2,500,000,000, 0.90% between $2,500,000,000 and $3,500,000,000, and 0.85% above $3,500,000,000
NTG
— 0.95%
TTP
— 1.10%
NDP
— 1.10%
TPZ
— 0.95%
TEAF
— 1.35%
On August 9, 2021, the
Adviser voluntarily agreed to reimburse TTP and NDP for their Operating Expenses in order to ensure that Operating Expenses do not exceed
1.35% of average daily managed assets, effective September 1, 2021. In its sole discretion and at any time, the Adviser may elect to
extend, terminate or modify the temporary expense reimbursement upon written notice.
U.S. Bancorp Fund Services,
LLC d/b/a U.S. Bank Global Fund Services serves as each Fund’s administrator. Each Fund pays the administrator a monthly fee computed
at an annual rate of 0.03% of the first $1,000,000,000 of the Fund’s Managed Assets, 0.01% on the next $500,000,000 of Managed
Assets and 0.005% on the balance of the Fund’s Managed Assets.
U.S. Bank, N.A. serves
as the Funds’ custodian. Each Fund pays the custodian a monthly fee computed at an annual rate of 0.004% of the Fund’s U.S.
Dollar-denominated assets and 0.015% of the Fund’s Canadian Dollar-denominated assets, plus portfolio transaction fees.
5. Income Taxes
TYG and NTG:
It is the intention of
TYG and NTG to qualify as RICs under Subchapter M of the IRC and distribute all of its taxable income. Accordingly, no provision for
federal income taxes is required in the financial statements, except as discussed below.
For the year ended November
30, 2024, TYG and NTG have a net tax benefit (expense) of $(344,744) and $129,997 respectively, relating to prior periods in which they
were C Corporations (TYG: $216,622; NTG: $129,997), and built-in gains taxes related to the conversion transaction (TYG: $(561,366);
NTG: $0). TYG and NTG are expected to be subject to federal income tax on any built-in gains recognized related to the conversion transaction
(as described below) during its fiscal year ending November 30, 2024, but do not expect to be subject to excise tax during calendar year
ending December 31, 2024.
Income taxes relating
to prior periods in which TYG and NTG were subject to tax as C Corporations are being calculated by applying the federal rate of 21%.
As part of the conversion
transaction, TYG and NTG may be subject to corporate level-tax on the net unrecognized built-in gains inherent on the conversion date
recognized during the subsequent 5-year period which ends November 30, 2027 (“the recognition period”). The conversion transaction
requires TYG and NTG to track built-in gains throughout the recognition period and potentially pay a corporate-level tax on any built-in
gains recognized. During the recognition period, tax is imposed on the lesser of the net built-in gain recognized, the taxable income
as if the Fund were a corporation or the net unrealized built-in gain at the conversion date. If the unrecognized built-in gains are
recognized in the recognition period, the Funds calculate tax based on the lesser of these three calculations and utilize pre-conversion
capital loss carryforwards, it is possible that the sale of the conversion property will not result in a current tax liability. Therefore,
each year during the recognition period, TYG and NTG will determine if any of these built-in gains have been recognized, such gain is
not offset by the capital loss carryforwards and calculate tax accordingly. If a tax liability is generated, TYG and NTG will record
the current tax liability and current tax expense in the period in which it is incurred. After the recognition period has ended, any
built-in gains recognized will no longer be subject to corporate-level tax.
Deferred income taxes
reflect the net tax effect of temporary differences between the carrying amount of assets and liabilities for financial reporting and
tax purposes. The difference between the financial reporting basis and the tax basis of the investment in the MLP investments (i.e.,
the outside basis difference) may create a taxable temporary difference or a deductible temporary difference. In measuring and determining
the character of the tax consequences of the outside basis differences in its MLP investments, the Funds consider the expected types
of taxable
Notes to Financial Statements (continued)
or deductible amounts
in future years and have concluded that the nature of the outside basis differences are capital in character because the Funds do not
have the ability to control the MLPs’ investment, distribution, or allocation decisions and, therefore, expect to recover the outside
basis differences upon disposal of the interests in the MLPs, which are considered capital assets in accordance with the tax law. The
conversion transaction does not impose or trigger a sale of securities held by TYG or NTG as of the conversion date. TYG and NTG do not
estimate or forecast future events, including the potential recharacterization of capital gains as ordinary income associated with selling
MLP investments when evaluating their deferred income taxes. The sale of a MLP unit typically results in the recognition of a capital
gain or loss. In accordance with the tax law, a portion of any gain or loss recognized by the Funds may be recharacterized as ordinary
income (“recapture”) to the extent attributable to assets of the MLP that give rise to depreciation recapture in the recognition
period. Any such gain may exceed the net taxable gain realized on the sale and will be recognized regardless of whether there is a net
taxable gain or loss on the sale of such unit. The Funds will record any current and deferred taxes as appropriate.
Components of TYG’s
and NTG’s deferred tax assets and liabilities as of November 30, 2024 are as follows:
| | |
TYG | | |
NTG | |
| Deferred tax assets: | |
| | | |
| | |
| Capital loss carryforwards | |
$ | 16,517,264 | | |
$ | 5,590,414 | |
| | |
| 16,517,264 | | |
| 5,590,414 | |
| Deferred tax liabilities: | |
| | | |
| | |
| Net unrealized gain on investment securities | |
| 16,517,264 | | |
| 5,590,414 | |
| | |
| 16,517,264 | | |
| 5,590,414 | |
| Total net deferred tax liability (asset) | |
$ | — | | |
$ | — | |
The amount and character of income and capital gain distributions
to be paid, if any, are determined in accordance with federal income tax regulations, which may differ from U.S. generally accepted accounting
principles. These differences are primarily due to return of capital distributions, book/tax differences from underlying investments and
the timing of recognition of gains or losses on investments. Where such differences are permanent in nature, GAAP requires that they be
reclassified in the components of net assets based on their ultimate characterization for federal income tax purposes. Any such reclassifications
will have no effect on net assets, results of operations or net asset values per share of the Funds. These differences are caused primarily
by differences in the timing of the recognition of certain components of income, expense or realized capital gain for federal income tax
purposes. Permanent book and tax basis differences resulted in the reclassifications of $(2,675,775) and $(835,436) from accumulated losses
and $2,675,775 and $835,436 to additional paid-in capital for TYG and NTG respectively.
The tax character of distributions paid to stockholders
for the years ending November 30, 2024 and November 30, 2023 was as follows:
| Year Ended November 30,
2024 | |
TYG | | |
NTG | |
| | |
Common(1) | | |
Preferred(1) | | |
Common(1) | | |
Preferred(1) | |
| Ordinary income | |
$ | 4,875,004 | | |
$ | 1,223,068 | | |
$ | 1,694,296 | | |
$ | 460,868 | |
| Return of capital | |
| 27,204,496 | | |
| — | | |
| 14,398,984 | | |
| — | |
| Total distributions | |
$ | 32,079,500 | | |
$ | 1,223,068 | | |
$ | 16,093,280 | | |
$ | 460,868 | |
| | |
| | | |
| | |
| Year Ended November 30, 2023 | |
TYG | | |
NTG | |
| | |
Common | | |
Preferred | | |
Common | | |
Preferred | |
| Ordinary income | |
$ | 18,410,881 | | |
$ | 1,224,551 | | |
$ | 8,701,938 | | |
$ | 545,914 | |
| Return of capital | |
| 13,368,334 | | |
| — | | |
| 7,603,071 | | |
| — | |
| Total distributions | |
$ | 31,779,215 | | |
$ | 1,224,551 | | |
$ | 16,305,009 | | |
$ | 545,914 | |
| (1) |
For
federal income tax purposes, the amount and character of distribution are reported on a calendar year basis and will differ from
amount presented above. Shareholders should use federal Form 1099 in computing their income tax liabilities and filing their tax
returns. |
As of November 30,2024, the components of accumulated earnings
(deficit) on a tax basis were as follows:
| | |
TYG | | |
NTG | |
| Unrealized appreciation (depreciation) | |
$ | 107,239,768 | | |
$ | 67,869,380 | |
| Capital loss carryforwards | |
| (121,103,179 | ) | |
| (368,220,666 | ) |
| Undistributed ordinary income | |
| — | | |
| — | |
| Other temporary differences | |
| (1,222,955 | ) | |
| (1,151,691 | ) |
| Accumulated earnings (deficit) | |
$ | (15,086,366 | ) | |
$ | (301,502,977 | ) |
2024 Annual Report | November
30, 2024
Notes to Financial Statements (continued)
As of November 30, 2024,
for federal income tax purposes, TYG and NTG had capital loss carryforwards of approximately $121,103,000 and $368,221,000 respectively.
If not utilized, these capital losses will expire in the year ending November 30, 2025. Because of TYG and NTG’s intent to be subject
to tax as a RIC, any temporary differences such as capital loss carryforwards from periods in which each fund was a C-Corporation must
be further evaluated to determine what the expected future tax rate would be upon reversal. As such, TYG and NTG expect capital loss
carryforwards of $78,653,638 and $26,621,017 respectively, to reverse at 21%, the tax rate applicable to built-in gains that were generated
when the funds were C-Corporations. The remaining capital loss carryforwards are expected to reverse at 0%, the tax rate applicable to
RICs.
As of November 30, 2024,
TYG and NTG utilized $138,357,192 and $93,172,712 of capital loss carryforwards in the current year.
In order to meet certain
excise tax distribution requirements, TYG and NTG, are required to measure and distribute annually net capital gains realized during
a twelve month period ending October 31 and net investment income earned during a twelve month period ending December 31. In connection
with this, TYG and NTG are permitted for tax purposes to defer into their next fiscal year, qualified late year losses. Qualified late
year ordinary losses are any net ordinary losses incurred between January 1 and the end of their fiscal year, November 30, 2024. For
the taxable year ended November 30, 2024, TYG and NTG do not plan to defer any losses.
As of November 30, 2024,
the aggregate cost of investments, aggregate gross unrealized appreciation and aggregate gross unrealized depreciation on a federal income
tax basis were as follows:
| | |
TYG | | |
NTG | |
| Tax cost of investments | |
$ | 577,786,875 | | |
$ | 332,035,165 | |
| Gross unrealized appreciation of investments | |
$ | 129,534,117 | | |
$ | 75,446,877 | |
| Gross unrealized depreciation of investments | |
| (19,151,295 | ) | |
| (4,730,097 | ) |
| Net unrealized appreciation (depreciation) of investments | |
$ | 110,382,822 | | |
$ | 70,716,780 | |
TTP, NDP, TPZ and TEAF:
It is the intention of
TTP, NDP, TPZ and TEAF to qualify as RICs under Subchapter M of the IRC and distribute all of their taxable income. Accordingly, no provision
for federal income taxes is required in the financial statements. However, TEAF’s taxable subsidiary created to make and hold certain
investments is generally subject to federal and state income taxes on its income.
As of November 30, 2024,
TEAF consolidated the balance of a deferred tax expense of $0 related to the investment activities of its taxable subsidiary. Total income
taxes are computed by applying the federal statutory rate plus a blended state income tax rate totaling 24.76%.
At November 30, 2024,
a valuation allowance on deferred tax assets was necessary because TEAF believes it is not more likely than not that it will be able
to realize its deferred tax assets through future taxable income. TEAF has recorded a valuation allowance of $3,804,943. Any adjustments
to TEAF’s estimates of future taxable income will be made in the period such determination is made.
Total income tax expense
for TEAF’s taxable subsidiary differs from the amount computed by applying the federal statutory income tax rate of 21% to net
income for the year ended November 30, 2024, as follows:
| Application of Statutory Income tax rate | |
$ | (2,054,690 | ) |
| State Income taxes, net of federal tax effect | |
| (367,626 | ) |
| Permanent differences | |
| 4,443 | |
| Other | |
| (124,716 | ) |
| Change in valuation allowance | |
| 2,542,589 | |
| Total income tax benefit | |
$ | — | |
The amount and character of income and capital gain distributions
to be paid, if any, are determined in accordance with federal income tax regulations, which may differ from U.S. generally accepted accounting
principles. The sale of a MLP unit results in the recognition of a capital gain or loss with a portion of any gain or loss recognized
by the Funds subject to being treated as ordinary income to the extent attributable to assets of the MLP that give rise to depreciation
recapture. Any such gain may exceed the net taxable gain realized on the sale and will be recognized regardless of whether there is a
net taxable gain or loss on the sale of such unit. As such, net, ordinary gains recognized upon the sale of MLP units may change the character
of distributions to shareholders. These differences are primarily due to return of capital distributions and book/tax differences from
underlying investments. Where such differences are permanent in nature, GAAP requires that they be reclassified in the components of net
assets based on their ultimate characterization for federal income tax purposes. Any such reclassifications will have no effect on net
assets, result of operations or net asset values per share of the Funds. These differences are caused primarily by differences in the
timing of the recognition of certain components of income, expense or realized capital gain for federal income tax purposes.
| | |
TTP | | |
NDP | | |
TPZ | | |
TEAF | |
| Distributable earnings (loss) | |
$ | (342,673 | ) | |
$ | (449,443 | ) | |
$ | (539,351 | ) | |
$ | (398,615 | ) |
| Additional paid-in capital | |
$ | 342,673 | | |
$ | 449,443 | | |
$ | 539,351 | | |
$ | 398,615 | |
Notes to Financial Statements (continued)
The tax character of distributions paid to stockholders
for the years ending November 30, 2024 and November 30, 2023 was as follows:
| Year Ended November 30,
2024 | |
TTP | | |
NDP | | |
TPZ | | |
TEAF | |
| | |
Common | | |
Preferred | | |
Common | | |
Common | | |
Common | |
| Ordinary income | |
$ | 675,318 | | |
$ | 278,770 | | |
$ | 711,025 | | |
$ | 1,982,573 | | |
$ | 7,070,533 | |
| Return of capital | |
| 4,069,618 | | |
| — | | |
| 3,487,330 | | |
| 5,439,038 | | |
| 7,499,884 | |
| Total distributions | |
$ | 4,744,936 | | |
$ | 278,770 | | |
$ | 4,198,355 | | |
$ | 7,421,611 | | |
$ | 14,570,417 | |
| | |
| | | |
| | | |
| | | |
| | | |
| | |
| Year
Ended November 30, 2023 | |
TTP | | |
NDP | | |
TPZ | | |
TEAF | |
| | |
Common | | |
Preferred | | |
Common | | |
Common | | |
Common | |
| Ordinary income | |
$ | 1,109,052 | | |
$ | 290,100 | | |
$ | 1,293,398 | | |
$ | 3,812,109 | | |
$ | 4,770,361 | |
| Return of capital | |
| 3,823,183 | | |
| — | | |
| 3,070,680 | | |
| 3,967,561 | | |
| 9,800,056 | |
| Total distributions | |
$ | 4,932,235 | | |
$ | 290,100 | | |
$ | 4,364,078 | | |
$ | 7,779,670 | | |
$ | 14,570,417 | |
As of November 30, 2024, the components of accumulated
earnings (deficit) on a tax basis were as follows:
| | |
TTP | | |
NDP | | |
TPZ | | |
TEAF | |
| Unrealized appreciation (depreciation) | |
$ | 40,044,896 | | |
$ | 38,098,835 | | |
$ | 44,383,947 | | |
$ | (2,962,680 | ) |
| Capital loss carryforwards | |
| (95,564,228 | ) | |
| (169,226,142 | ) | |
| (13,321,303 | ) | |
| (25,532,803 | ) |
| Undistributed ordinary income | |
| — | | |
| — | | |
| — | | |
| — | |
| Other temporary differences | |
| (159,867 | )(1) | |
| (138,816 | ) | |
| 4,065 | | |
| (327,224 | ) |
| Accumulated earnings (deficit) | |
$ | (55,679,199 | ) | |
$ | (131,266,123 | ) | |
$ | 31,066,709 | | |
$ | (28,822,707 | ) |
| (1) |
Primarily related to losses deferred under straddle
regulations per IRC Sec. 1092 and dividends payable and interest disallowance per IRC Sec. 163(j). |
As of November 30, 2024,
TTP, NDP, TPZ and TEAF had short-term capital loss carryforwards of $16,588,783, $69,930,842, $165,043, and $22,633,791 respectively,
and TTP, NDP, TPZ and TEAF had long-term capital loss carryforwards of $78,975,445, $99,295,300, $13,156,260 and $2,899,012 respectively,
which may be carried forward for an unlimited period under the Regulated Investment Company Modernization Act of 2010. To the extent
future net capital gains are realized, those gains will be offset by any unused capital loss carryforwards. Capital loss carryforwards
will retain their character as either short-term or long-term capital losses. Thus, such losses must be used first to offset gains of
the same character; for example, long-term loss carryforwards will first offset long-term gains, before they can be used to offset short-term
gains.
As of November 30, 2024,
TTP, NDP, TPZ and TEAF utilized (generated) approximately $523,000, $1,199,000, $(2,884,000) and $1,675,000 of capital loss carryforwards
in the current year.
In order to meet certain
excise tax distribution requirements, TTP, NDP, TPZ and TEAF are required to measure and distribute annually net capital gains realized
during a twelve-month period ending October 31 and net investment income earned during a twelve-month period ending December 31. In connection
with this, TTP, NDP, TPZ and TEAF are permitted for tax purposes to defer into their next fiscal year, qualified late year losses. Qualified
late year ordinary losses are any net ordinary losses incurred between January 1 and the end of their fiscal year, November 30, 2024.
For the taxable year ended November 30, 2024, TTP, NDP, TPZ and TEAF do not plan to defer any losses.
As of November 30, 2024,
the aggregate cost of investments, aggregate gross unrealized appreciation and aggregate gross unrealized depreciation on a federal income
tax basis were as follows:
| | |
TTP | | |
NDP | | |
TPZ | | |
TEAF | |
| Tax cost of investments | |
$ | 58,540,635 | | |
$ | 45,824,058 | | |
$ | 93,257,344 | | |
$ | 229,919,320 | |
| Gross unrealized appreciation of investments | |
$ | 58,790,410 | | |
$ | 40,853,804 | | |
$ | 58,158,450 | | |
$ | 30,829,590 | |
| Gross unrealized depreciation of investments | |
| — | | |
| (134,659 | ) | |
| (1,281,064 | ) | |
| (32,673,549 | ) |
| Net unrealized appreciation (depreciation) of investments | |
$ | 58,790,410 | | |
$ | 40,719,145 | | |
$ | 56,877,386 | | |
$ | (1,843,959 | ) |
2024 Annual Report | November
30, 2024
Notes to Financial Statements (continued)
6. Restricted Securities
Certain of the Funds’
investments are restricted and are valued as determined in accordance with fair value procedures, as more fully described in Note 2.
The following table shows the principal amount or shares, acquisition date(s), acquisition cost, fair value and the percent of net assets
which the securities comprise at November 30, 2024.
| TYG: | |
| |
| |
| |
| | |
| | |
|
| Investment
Security | |
Investment
Type | |
Shares | |
Acquisition
Date(s) | |
Acquisition
Cost | | |
Fair
Value | | |
Fair
Value
as Percent
of Net Assets |
| TK NYS Solar Holdco, LLC | |
Private Investment | |
| N/A | |
08/18/17-08/19/19 | |
$ | 50,141,470 | | |
$ | 2,444,516 | | |
0.4% |
| TPZ: | |
| |
| | |
| |
| | | |
| | | |
|
| Investment
Security | |
Investment
Type | |
Principal
Amount | |
Acquisition
Date(s) | |
Acquisition
Cost | | |
Fair
Value | | |
Fair
Value
as Percent
of Net Assets |
| Antero Midstream Partners LP, 5.75%, 03/01/2027* | |
Corporate Bond | |
$ | 3,800,000 | |
04/03/19-09/07/21 | |
$ | 3,890,000 | | |
$ | 3,792,181 | | |
3.0% |
| Blue Racer Midstream, LLC, 6.63%, 07/15/2026* | |
Corporate Bond | |
$ | 2,950,000 | |
06/14/18-02/01/19 | |
| 2,997,313 | | |
| 2,948,971 | | |
2.4 |
| EnLink Midstream, 6.50%, 09/01/2030 | |
Corporate Bond | |
$ | 4,900,000 | |
04/16/24-07/01/24 | |
| 4,992,875 | | |
| 5,208,408 | | |
4.2 |
| Hess Corporation, 5.63%, 02/15/2026* | |
Corporate Bond | |
$ | 4,160,000 | |
07/17/18-08/02/18 | |
| 4,196,600 | | |
| 4,154,789 | | |
3.3 |
| Kodiak Gas Services, 7.25%, 02/15/2026* | |
Corporate Bond | |
$ | 4,000,000 | |
02/12/24-03/06/24 | |
| 4,087,025 | | |
| 4,134,852 | | |
3.3 |
| New Fortress Energy, Inc., 6.50%, 09/30/2026* | |
Corporate Bond | |
$ | 5,000,000 | |
03/26/21-10/07/21 | |
| 4,999,844 | | |
| 4,664,967 | | |
3.7 |
| NGPL Pipe Co, 3.25%, 07/15/2031* | |
Corporate Bond | |
$ | 3,500,000 | |
11/09/21- 07/10/23 | |
| 3,182,015 | | |
| 3,067,279 | | |
2.5 |
| Tallgrass Energy LP, 5.50%, 01/15/2028* | |
Corporate Bond | |
$ | 3,250,000 | |
09/24/18-02/04/19 | |
| 3,261,250 | | |
| 3,160,722 | | |
2.5 |
| Venture Global LNG, 9.88%, 02/01/2032* | |
Corporate Bond | |
$ | 3,500,000 | |
02/13/24-02/27/24 | |
| 3,710,469 | | |
| 3,892,084 | | |
3.1 |
| Vistra Corp., 7.75%, 10/15/2031* | |
Corporate Bond | |
$ | 1,700,000 | |
06/04/2024 | |
| 1,776,500 | | |
| 1,805,566 | | |
1.4 |
| | |
| |
| | |
| |
$ | 37,093,891 | | |
$ | 36,829,819 | | |
29.4% |
| | |
| |
| |
| |
| | |
| | |
|
| TEAF: | |
| |
| |
| |
| | |
| | |
|
| Investment
Security | |
Investment
Type | |
Principal
Amount/Shares | |
Acquisition
Date(s) | |
Acquisition
Cost | | |
Fair
Value | | |
Fair
Value
as Percent
of Net Assets |
| 315/333 West Dawson Associates, 11.00%, 01/31/26* | |
Corporate Bond | |
$ | 3,770,000 | |
03/30/21 | |
$ | 3,590,476 | | |
$ | 3,697,639 | | |
1.9% |
| Ativo Albuquerque LLC, 12.00%, 01/01/2028* | |
Corporate Bond | |
$ | 2,032,000 | |
12/28/22 | |
| 2,032,000 | | |
| 2,166,297 | | |
1.1 |
| Contour Propco, 11.00%, 10/01/25 | |
Corporate Bond | |
$ | 5,715,000 | |
09/30/21 | |
| 5,715,000 | | |
| 306,931 | | |
0.2 |
| Dove Mountain Residences, LLC 11.00%, 02/01/2026* | |
Corporate Bond | |
$ | 1,050,000 | |
12/02/21 | |
| 1,050,000 | | |
| 1,014,914 | | |
0.5 |
| Dove Mountain Residences, LLC 16.00%, 02/01/2026* | |
Corporate Bond | |
$ | 1,116,447 | |
12/02/21-02/01/24 | |
| 1,116,447 | | |
| 1,076,354 | | |
0.5 |
| Drumlin Reserve Property LLC, 10.00%, 10/02/2025* | |
Corporate Bond | |
$ | 1,705,311 | |
09/30/20 | |
| 1,705,311 | | |
| 1,691,693 | | |
0.9 |
| JW Living Smithville Urban Ren Sub Global 144A 27 11.75%, 06/01/2027 | |
Corporate Bond | |
$ | 3,890,000 | |
05/24/22 | |
| 3,890,000 | | |
| 4,003,066 | | |
2.0 |
| Realco Perry Hall MD LLC/OPCO, 10.00%, 10/01/2024* | |
Corporate Bond | |
$ | 2,198,000 | |
09/30/19 | |
| 2,198,000 | | |
| 2,198,107 | | |
1.1 |
Notes to Financial Statements (continued)
| TEAF: (continued) | |
| |
| |
| |
| | |
| | |
|
| Investment
Security | |
Investment
Type | |
Principal
Amount/Shares | |
Acquisition
Date(s) | |
Acquisition
Cost | | |
Fair
Value | | |
Fair
Value
as Percent
of Net Assets |
| Mexico Pacific Limited LLC (MPL) Series A | |
Private Investment | |
| 135,180 | |
10/23/19-05/10/23 | |
$ | 2,031,683 | | |
$ | 2,966,390 | | |
1.5 |
| One Energy | |
Private Investment | |
| 21,957 | |
04/12/23-11/12/24 | |
| 9,050,000 | | |
| 10,820,849 | | |
5.5 |
| Renewable Holdco, LLC | |
Private Investment | |
| N/A | |
07/25/19-09/27/24 | |
| 7,989,248 | | |
| 7,117,178 | | |
3.5 |
| Renewable Holdco I, LLC | |
Private Investment | |
| N/A | |
09/09/19 | |
| 22,010,876 | | |
| 12,192,839 | | |
6.2 |
| Renewable Holdco II, LLC | |
Private Investment | |
| N/A | |
11/15/16-12/22/21 | |
| 12,313,411 | | |
| 8,333,719 | | |
4.2 |
| Saturn Solar Bermuda 1 Ltd., 10.00%, 12/31/2024 | |
Private Note | |
$ | 3,510,000 | |
05/24/19-07/03/19 | |
| 3,778,904 | | |
| 3,653,559 | | |
1.8 |
| | |
| |
| | |
| |
$ | 78,471,356 | | |
$ | 61,239,535 | | |
30.9% |
| * |
Security is eligible for resale under Rule 144A under the 1933 Act. |
7. Affiliated Company Transactions
A summary of the transactions in affiliated companies during
the year ended November 30, 2024 is as follows:
| TYG: | |
| |
| | |
| | |
| | |
| | |
| |
| | |
| |
| Investment
Security | |
11/30/23
Share
Balance | |
Gross
Additions | | |
Gross
Reductions | | |
Realized
Gain/(Loss) | | |
Distributions
Received | | |
11/30/24
Share
Balance | |
11/30/24
Value | | |
Net
Change in
Unrealized
Appreciation
(Depreciation) | |
| TK NYS Solar Holdco, LLC | |
N/A | |
$ | — | | |
$ | — | | |
$ | — | | |
$ | — | | |
N/A | |
$ | 2,444,516 | | |
$ | (13,006,099 | ) |
| | |
| |
| | | |
| | | |
| | | |
| | | |
| |
| | | |
| | |
| TEAF: | |
| |
| | | |
| | | |
| | | |
| | | |
| |
| | | |
| | |
| Investment
Security | 11/30/23
Share
Balance | |
Gross
Additions | | |
Gross
Reductions | | |
Realized
Gain/(Loss) | | |
Distributions
Received | | 11/30/24
Share
Balance | |
11/30/24
Value | | |
Net
Change in
Unrealized
Appreciation
(Depreciation) | |
| Renewable Holdco, LLC | |
N/A | |
$ | 1,550,000 | | |
$ | — | | |
$ | — | | |
$ | — | | |
N/A | |
$ | 7,117,178 | | |
$ | (1,340,016 | ) |
| Renewable Holdco I, LLC | |
N/A | |
$ | — | | |
$ | — | | |
$ | — | | |
$ | — | | |
N/A | |
$ | 12,192,839 | | |
$ | (5,802,534 | ) |
| Renewable Holdco II, LLC | |
N/A | |
$ | — | | |
$ | — | | |
$ | — | | |
$ | — | | |
N/A | |
$ | 8,333,719 | | |
$ | (4,265,983 | ) |
| Total | |
N/A | |
$ | 1,550,000 | | |
$ | — | | |
$ | — | | |
$ | — | | |
N/A | |
$ | 27,643,736 | | |
$ | (11,408,533 | ) |
8. Investment Transactions
For the period ended November 30, 2024, the amount of security
transactions (other than U.S. government securities and short-term investments), is as follows:
| | |
TYG | | |
NTG | | |
TTP | | |
NDP | | |
TPZ | | |
TEAF | |
| Purchases | |
$ | 1,209,155,183 | | |
$ | 648,427,105 | | |
$ | 4,688,796 | | |
$ | 4,108,750 | | |
$ | 17,191,477 | | |
$ | 55,474,309 | |
| Sales | |
$ | 1,209,218,677 | | |
$ | 641,285,298 | | |
$ | 10,898,198 | | |
$ | 4,123,672 | | |
$ | 19,070,778 | | |
$ | 56,400,211 | |
9. Senior Notes
TYG, NTG and TTP each have issued private senior notes
(collectively, the “Notes”), which are unsecured obligations and, upon liquidation, dissolution or winding up of a Fund, will
rank: (1) senior to all of the Fund’s outstanding preferred shares, if any; (2) senior to all of the Fund’s outstanding common
shares; (3) on parity with any unsecured creditors of the Fund and any unsecured senior securities representing indebtedness of the Fund
and (4) junior to any secured creditors of the Fund. Holders of the Notes are entitled to receive periodic cash interest payments until
maturity. The Notes are not listed on any exchange or automated quotation system.
The Notes are redeemable in certain circumstances at the
option of a Fund, subject to payment of any applicable make-whole amounts or early redemption premiums. The Notes for a Fund are also
subject to a mandatory redemption if the Fund fails to meet asset coverage ratios required under the 1940 Act or the rating agency guidelines
if such failure is not waived or cured. At November 30, 2024, each of TYG, NTG and TTP were in compliance with asset coverage covenants
and basic maintenance covenants for its senior notes.
2024 Annual Report | November
30, 2024
Notes to Financial Statements (continued)
Details of each Fund’s outstanding Notes, including
estimated fair value, as of November 30, 2024, are included below. The estimated fair value of each series of fixed-rate Notes was calculated,
for disclosure purposes, by discounting future cash flows by a rate equal to the current U.S. Treasury rate with an equivalent maturity
date, plus either 1) the spread between the interest rate on recently issued debt and the U.S. Treasury rate with a similar maturity date
or 2) if there has not been a recent debt issuance, the spread between the AAA corporate finance debt rate and the U.S. Treasury rate
with an equivalent maturity date plus the spread between the fixed rates of the Notes and the AAA corporate finance debt rate. The estimated
fair value of floating rate Notes approximates the carrying amount because the interest rate fluctuates with changes in interest rates
available in the current market. The estimated fair values in the following tables are Level 2 valuations within the fair value hierarchy.
| TYG: | |
| |
| |
| |
| | |
| |
| Series | |
Maturity Date | |
Interest Rate | |
Payment Frequency | |
Notional Amount | | |
Estimated
Fair Value | |
| Series L | |
December 19, 2024 | |
3.99% | |
Semi-Annual | |
$ | 6,453,333 | | |
$ | 6,562,811 | |
| Series AA | |
June 14, 2025 | |
3.48% | |
Semi-Annual | |
| 3,226,666 | | |
| 3,244,572 | |
| Series NN | |
June 14, 2025 | |
3.20% | |
Semi-Annual | |
| 9,680,000 | | |
| 9,708,778 | |
| Series KK | |
December 18, 2025 | |
3.53% | |
Semi-Annual | |
| 3,226,667 | | |
| 3,218,638 | |
| Series OO | |
April 9, 2026 | |
3.27% | |
Semi-Annual | |
| 9,680,000 | | |
| 9,466,463 | |
| Series PP | |
September 25, 2027 | |
3.33% | |
Semi-Annual | |
| 8,066,667 | | |
| 7,722,349 | |
| Series QQ | |
December 17, 2028 | |
2.50% | |
Semi-Annual | |
| 10,000,000 | | |
| 9,803,367 | |
| | |
| |
| |
| |
$ | 50,333,333 | | |
$ | 49,726,978 | |
On December 18, 2023, TYG’s Series JJ Notes, with
a notional amount of $6,453,333 and a fixed interest rate of 3.34% were paid in full at maturity.
On January 22, 2024, TYG’s Series T Notes, with a
notional amount of $8,066,667 and a fixed interest rate of 4.16% were paid in full at maturity.
| NTG: | |
| |
| |
| |
| | |
| |
| Series | |
Maturity Date | |
Interest Rate | |
Payment Frequency | |
Notional Amount | | |
Estimated
Fair Value | |
| Series Q | |
October 16, 2025 | |
3.97% | |
Semi-Annual | |
$ | 2,234,292 | | |
$ | 2,217,881 | |
| Series R | |
October 16, 2026 | |
4.02% | |
Semi-Annual | |
| 1,936,386 | | |
| 1,902,960 | |
| Series S | |
December 17, 2028 | |
2.50% | |
Semi-Annual | |
| 25,000,000 | | |
| 22,870,124 | |
| | |
| |
| |
| |
$ | 29,170,678 | | |
$ | 26,990,965 | |
| | |
| |
| |
| |
| | | |
| | |
| TTP: | |
| |
| |
| |
| | | |
| | |
| Series | |
Maturity Date | |
Interest Rate | |
Payment Frequency | |
Notional Amount | | |
Estimated
Fair Value | |
| Series H | |
December 13, 2024 | |
3.97% | |
Semi-Annual | |
$ | 3,942,858 | | |
$ | 4,013,066 | |
10. Mandatory Redeemable Preferred Stock
TYG, NTG and TTP each have issued and outstanding MRP Stock
at November 30, 2024. The MRP Stock has rights determined by the Board of Directors. Except as otherwise indicated in the Funds’
Charter or Bylaws, or as otherwise required by law, the holders of MRP Stock have voting rights equal to the holders of common stock (one
vote per MRP share) and will vote together with the holders of shares of common stock as a single class except on matters affecting only
the holders of preferred stock or the holders of common stock. The 1940 Act requires that the holders of any preferred stock (including
MRP Stock), voting separately as a single class, have the right to elect at least two directors at all times.
Under the 1940 Act, a Fund may not declare dividends or
make other distributions on shares of common stock or purchases of such shares if, at the time of the declaration, distribution or purchase,
asset coverage with respect to the outstanding MRP Stock would be less than 200%. The MRP Stock is also subject to a mandatory redemption
if a Fund fails to meet an asset coverage ratio of at least 225% as determined in accordance with the 1940 Act or a rating agency basic
maintenance amount if such failure is not waived or cured. At November 30, 2024, each of TYG, NTG and TTP were in compliance with asset
coverage covenants and basic maintenance covenants for its MRP Stock.
Details of each Fund’s outstanding MRP Stock, including
estimated fair value, as of November 30, 2024 is included below. The estimated fair value of each series of TYG, NTG and TTP MRP Stock
was calculated for disclosure purposes by discounting future cash flows at a rate equal to the current U.S. Treasury rate with an equivalent
maturity date, plus either 1) the spread between the interest rate on recently issued preferred stock and the U.S. Treasury rate with
a similar maturity date or 2) if there has not been a recent preferred stock issuance, the spread between the AA corporate finance debt
rate and the U.S. Treasury rate with an equivalent maturity date plus the spread between the fixed rates of the MRP Stock and the AA corporate
finance debt rate. The estimated fair values of each series of the TYG, NTG and TTP MRP Stock are Level 2 valuations within the fair value
hierarchy.
Notes to Financial Statements (continued)
TYG:
TYG has 65,000,000 shares of preferred stock authorized
and 3,566,061 shares of MRP Stock outstanding at November 30, 2024. TYG’s MRP Stock has a liquidation value of $10.00 per share
plus any accumulated but unpaid distributions, whether or not declared. Holders of the MRP E Stock and MRP F Stock are entitled to receive
cash interest payments semi-annually at a fixed rate until maturity. The TYG MRP Stock is not listed on any exchange or automated quotation
system.
| Series | |
Mandatory
Redemption Date | |
Fixed Rate | |
Shares Outstanding | | |
Aggregate Liquidation
Preference | | |
Estimated
Fair Value | |
| Series E | |
December 17, 2024 | |
4.34% | |
| 1,566,061 | | |
$ | 15,660,610 | | |
$ | 15,955,386 | |
| Series F | |
December 17, 2026 | |
2.67% | |
| 2,000,000 | | |
| 20,000,000 | | |
| 18,880,166 | |
| | |
| |
| |
| 3,566,061 | | |
$ | 35,660,610 | | |
$ | 34,835,552 | |
TYG’s MRP Stock is redeemable in certain circumstances
at the option of TYG, subject to payment of any applicable make-whole amounts.
NTG:
NTG has 10,000,000 shares of preferred stock authorized
and 550,151 shares of MRP Stock outstanding at November 30, 2024. NTG’s MRP Stock has a liquidation value of $25.00 per share plus
any accumulated but unpaid distributions, whether or not declared. Holders of NTG MRP Stock are entitled to receive cash interest payments
each quarter at a fixed rate until maturity. The NTG MRP Stock is not listed on any exchange or automated quotation system.
| Series | |
Mandatory
Redemption Date | |
Fixed Rate | |
Shares Outstanding | | |
Aggregate Liquidation
Preference | | |
Estimated
Fair Value | |
| Series E | |
December 13, 2024 | |
3.78% | |
| 153,939 | | |
$ | 3,848,475 | | |
$ | 3,876,412 | |
| Series F | |
December 13, 2027 | |
4.07% | |
| 96,212 | | |
| 2,405,300 | | |
| 2,315,398 | |
| Series H | |
December 17, 2027 | |
2.90% | |
| 300,000 | | |
| 7,500,000 | | |
| 6,967,296 | |
| | |
| |
| |
| 550,151 | | |
$ | 13,753,775 | | |
$ | 13,159,106 | |
NTG’s MRP Stock is redeemable in certain circumstances
at the option of NTG, subject to payment of any applicable make-whole amounts.
TTP:
TTP has 10,000,000 shares of preferred stock authorized
and 244,000 shares of MRP Stock outstanding at November 30, 2024. TTP’s MRP Stock has a liquidation value of $25.00 per share plus
any accumulated but unpaid distributions, whether or not declared. Holders of TTP MRP Stock are entitled to receive cash interest payments
each quarter at a fixed rate until maturity. The TTP MRP Stock is not listed on any exchange or automated quotation system.
| Series | |
Mandatory
Redemption Date | |
Fixed Rate | |
Shares Outstanding | | |
Aggregate Liquidation
Preference | | |
Estimated
Fair Value | |
| Series B | |
December 13, 2024 | |
4.57% | |
| 244,000 | | |
$ | 6,100,000 | | |
$ | 6,156,303 | |
TTP’s MRP Stock is redeemable in certain circumstances
at the option of TTP, subject to payment of any applicable make-whole amounts.
2024 Annual Report | November
30, 2024
Notes to Financial Statements (continued)
11. Credit Facilities
The following table shows key terms, average borrowing
activity and interest rates for the period during which the facility was utilized during the period from December 1, 2023 through November
30, 2024 as well as the principal balance and interest rate in effect at November 30, 2024 for each of the Funds’ credit or margin
facilities:
| | |
TYG | | |
NTG | | |
TTP | | |
NDP | | |
TPZ | | |
TEAF | |
| Lending syndicate agent | |
| U.S. Bank, N.A. | | |
| U.S. Bank, N.A. | | |
| The Bank of Nova Scotia | | |
| The Bank of Nova Scotia | | |
| The Bank of Nova Scotia | | |
| The Bank of Nova Scotia | |
| Type of facility | |
| Unsecured, revolving credit facility | | |
| Unsecured, revolving credit facility | | |
| Unsecured, revolving credit facility | | |
| Margin loan facility | | |
| Margin loan facility | | |
| Margin loan facility | |
| | |
| | | |
| | | |
| | | |
| | | |
| | | |
| | |
| Borrowing capacity | |
$ | 45,000,000 | | |
$ | 35,000,000 | | |
$ | 15,000,000 | | |
$ | 12,000,000 | | |
$ | 30,000,000 | | |
$ | 45,000,000 | |
| Maturity date | |
| June 12, 2025 | | |
| June 12, 2025 | | |
| December 23,
2024 | | |
| 179-day rolling
evergreen | | |
| 179-day rolling
evergreen | | |
| 179-day rolling
evergreen | |
| Interest rate | |
| 1-month Term SOFR plus 1.35% | | |
| 1-month Term SOFR plus 1.35% | | |
| Simple SOFR plus 1.40% | | |
| 1-month Term SOFR plus 1.00% | | |
| 1-month Term SOFR plus 1.00% | | |
| 1-month Term SOFR plus 1.00% | |
| Non-usage fee | |
| 0.15%-0.25% | (1) | |
| 0.15%-0.25% | (2) | |
| 0.00%-0.30% | (3) | |
| 0.20% | | |
| 0.20% | | |
| 0.20% | |
| |
| For the period ended November 30, 2024: |
| Average principal balance | |
$ | 26,836,612 | | |
$ | 13,025,956 | | |
$ | 6,298,087 | | |
$ | 9,868,672 | | |
$ | 23,332,514 | | |
$ | 23,744,262 | |
| Average interest rate | |
| 6.55% | | |
| 6.55% | | |
| 6.61% | | |
| 6.20% | | |
| 6.20% | | |
| 6.19% | |
| |
| As of November 30, 2024: |
| Principal balance outstanding | |
$ | 41,200,000 | | |
$ | 21,200,000 | | |
$ | 2,700,000 | | |
$ | 11,600,000 | | |
$ | 25,500,000 | | |
$ | 31,500,000 | |
| Interest rate | |
| 5.88% | | |
| 5.88% | | |
| 5.97% | | |
| 5.53% | | |
| 5.53% | | |
| 5.53% | |
| (1) |
Non-use fees are tiered with a rate of 0.25% when
the outstanding balance is below $22,500,000 and 0.15% when the outstanding balance is at least $22,500,000, but below $31,500,000.
The outstanding balance will not be subject to the non-use fee when the amount outstanding is at least $31,500,000. |
| (2) |
Non-use fees are tiered with a rate of 0.25% when the outstanding
balance is below $17,500,000 and 0.15% when the outstanding balance is at least $17,500,000, but below $24,500,000. The outstanding
balance will not be subject to the non-use fee when the amount outstanding is at least $24,500,000. |
| (3) |
Non-use fee is 0.00% when the amount outstanding is at least $13,500,000,
and 0.15% when the amount outstanding is less than $13,500,000 and greater than or equal to $10,500,000, and 0.20% when the amount
outstanding is less than $10,500,000 and greater than or equal to $7,500,000, and 0.30% when the amount outstanding is less than
$7,500,000. |
Under the terms of the credit and margin facilities, the
Funds must maintain asset coverage required under the 1940 Act. If a Fund fails to maintain the required coverage, it may be required
to repay a portion of an outstanding balance until the coverage requirement has been met. At November 30, 2024, each Fund was in compliance
with facility terms.
12. Derivative Financial Instruments
The Funds have adopted the disclosure provisions of FASB
Accounting Standard Codification 815, Derivatives and Hedging (“ASC 815”). ASC 815 requires enhanced disclosures about the
Funds’ use of and accounting for derivative instruments and the effect of derivative instruments on the Funds’ results of
operations and financial position. Tabular disclosure regarding derivative fair value and gain/loss by contract type (e.g., interest rate
contracts, foreign exchange contracts, credit contracts, etc.) is required and derivatives accounted for as hedging instruments under
ASC 815 must be disclosed separately from those that do not qualify for hedge accounting. Even though the Funds may use derivatives in
an attempt to achieve an economic hedge, the Funds’ derivatives are not accounted for as hedging instruments under ASC 815 because
investment companies account for their derivatives at fair value and record any changes in fair value in current period earnings.
Forward Currency Contracts
TEAF may invest in derivative instruments for hedging or
risk management purposes, and for short-term purposes such as maintaining market exposure pending investment of the proceeds of an offering
or transitioning its portfolio between different asset classes. The Fund’s use of derivatives could enhance or decrease the cash
available to the Fund for payment of distributions or interest, as the case may be. Derivatives can be illiquid, may disproportionately
increase losses and have a potentially large negative impact on the Fund’s performance. Derivative transactions, including options
on securities and securities indices and other transactions in which the Fund may engage (such as forward currency transactions, futures
contracts and options thereon and total return swaps), may subject the Fund to increased risk of principal loss due to unexpected movements
in stock prices, changes in stock volatility levels, interest rates and foreign currency exchange rates and imperfect
Notes to Financial Statements (continued)
correlations between the Fund’s securities holdings
and indices upon which derivative transactions are based. The Fund also will be subject to credit risk with respect to the counterparties
to any OTC derivatives contracts the Fund enters into.
As of November 30, 2024, TEAF held no forward currency
contracts.
Interest Rate Swap Contracts
TYG may enter into interest rate swap contracts in an attempt
to protect it from increasing interest expense on its leverage resulting from increasing interest rates. A decline in interest rates may
result in a decline in the value of the swap contracts, which may result in a decline in the net assets of TYG. At the time the interest
rate swap contracts reach their scheduled termination, there is a risk that TYG will not be able to obtain a replacement transaction,
or that the terms of the replacement would not be as favorable as on the expiring transaction. In addition, if TYG is required to terminate
any swap contract early due to a decline in net assets below a threshold amount or failing to maintain a required 300% asset coverage
of the liquidation value of the outstanding debt, then TYG could be required to make a payment to the extent of any net unrealized depreciation
of the terminated swaps, in addition to redeeming all or some of its outstanding debt. TYG segregates a portion of its assets as collateral
for the amount of any net liability of its interest rate swap contracts.
TYG may be subject to credit risk on the interest rate
swap contracts if the counterparty should fail to perform under the terms of the interest rate swap contracts. The amount of credit risk
is limited to the net appreciation of the interest rate swap contracts, if any, as no collateral is pledged by the counterparty. In addition,
if the counterparty to the interest rate swap contracts defaults, the Fund would incur a loss in the amount of the receivable and would
not receive amounts due from the counterparty to offset the interest payments on the Fund’s leverage. As of November 30, 2024, TYG
held no interest rate swap contracts.
Written Call Options
Transactions in written option contracts for TEAF for the
period from December 1, 2023 through November 30, 2024 are as follows:
| | |
TEAF | |
| | |
Number of
Contracts | | |
Premium | |
| Options outstanding at November 30, 2023 | |
| 1,000 | | |
$ | 34,025 | |
| Options written | |
| 245 | | |
| 17,983 | |
| Options closed* | |
| — | | |
| — | |
| Options exercised | |
| (1,000 | ) | |
| (34,025 | ) |
| Options expired | |
| (245 | ) | |
| (17,983 | ) |
| Options outstanding at November 30, 2024 | |
| — | | |
$ | — | |
There were no written option contracts in TYG, NTG, TTP
and NDP during the period December 1, 2023 through November 30, 2024. As of November 30, 2024, TEAF held no written options contracts.
The following table presents the effect of derivatives
on the Statements of Operations for the year ended November 30, 2024:
Derivatives not accounted for
as hedging instruments under ASC 815 | |
Location of Gains (Losses)
on Derivatives | |
Net Realized
Gain (Loss) on
Derivatives | | |
Net Change
in Unrealized
Appreciation
(Depreciation)
of Derivatives | |
| TEAF: Written equity call options | |
Options | |
$ | 17,983 | | |
$ | 12,781 | |
13. Basis For Consolidation
As of November 30, 2024, TYG has committed a total of $56,156,470
of equity funding to Tortoise Holdco II, LLC, a wholly-owned investment of TYG. Tortoise Holdco II, LLC wholly owns TK NYS Solar Holdco,
LLC, which owns and operates renewable energy assets. TK NYS Solar Holdco, LLC acquired the commercial and industrial solar portfolio
between August 2017 and November 2019. Fair value of TK NYS Solar Holdco, LLC is net of tax benefits.
TYG’s consolidated schedule of investments includes
the portfolio holdings of the Fund and its subsidiary, Tortoise Holdco II, LLC. All inter-company transactions and balances have been
eliminated.
2024 Annual Report | November
30, 2024
Notes to Financial Statements (continued)
As of November 30, 2024, TEAF has committed $65,389,819
to TEAF Solar Holdco, LLC, a wholly-owned investment of TEAF. TEAF Solar Holdco, LLC wholly owns each of Renewable Holdco, LLC and Renewable
Holdco I, LLC, which owns and operates renewable energy assets. TEAF Solar Holdco, LLC owns a majority partnership interest in Renewable
Holdco II, LLC. Renewable Holdco, LLC and Renewable Holdco II, LLC’s acquisition of the commercial and industrial solar portfolio
is ongoing. Renewable Holdco I, LLC acquired the commercial and industrial solar portfolio in September 2019.
As of November 30, 2024, TEAF has provided $3,778,904 to
TEAF Solar Holdco I, LLC, a wholly-owned investment of TEAF. TEAF Solar Holdco I, LLC has committed to $6,667,100 of debt funding to Saturn
Solar Bermuda 1, Ltd. through a private note. Under the terms of the note Tortoise Solar Holdco I, LLC receives cash payments monthly
at an annual rate of 10%. As of November 30, 2024, $3,510,000 of the private note had been funded.
TEAF’s consolidated schedule of investments includes
the portfolio holdings of the Fund and its subsidiaries, TEAF Solar Holdco, LLC and TEAF Solar Holdco I, LLC. All inter-company transactions
and balances have been eliminated.
14. Subsequent Events
TYG and NTG fund merger
Pursuant to a plan of merger approved by the Board of Directors,
the Tortoise Energy Infrastructure Corp. (the “Acquiring Fund”) acquired all of the net assets of the Tortoise Midstream Energy
Fund, Inc. (the “Acquired Fund”) on December 23, 2024. A total of 5,092,810 shares of the Acquired Fund were exchanged for
6,470,738 shares of the Acquiring Fund on the closing date. The merger aims to strategically enhance stockholder value by potentially
increasing net earnings and distribution levels of common stock, due to the operating economies gained and lower net overall fees and
expenses from the scale of the combined Fund after the merger. Additionally, the merger seeks to mitigate the discount to NAV at which
the Funds’ shares have historically traded by increasing the distribution levels within the Acquiring Fund. This merger qualified
as tax-free reorganizations under Section 368(a)(1)(C) of the Internal Revenue Code. The aggregate net assets of the Acquiring Fund prior
to the reorganization totaled $301,535,343 and following the merger the combined net assets of the Acquiring Fund totaled $803,178,581.
As of the date of the merger and reorganization the combined balances for the entities for accumulated net investment gain was $108,105,110,
accumulated net realized loss on investment was $491,317,739, and net unrealized depreciation of investments and translations of foreign
currency was $25,373,422.
For financial reporting purposes, assets received and shares
issued by the Acquiring Fund were recorded at fair value. However, the cost basis of the investments being received from the Acquired
Fund were carried forward to align ongoing reporting of the Acquiring Fund’s realized and unrealized gains and losses with amounts
distributable to shareholders for tax purposes.
TTP, NDP & TPZ merger and subsequent conversion
to an active ETF
Pursuant to a plan of merger approved by the Funds Boards
of Directors of Tortoise Pipeline and Energy Fund, Inc. (“TTP”), Tortoise Energy Independence Fund, Inc. (“NDP”),
and Tortoise Power and Energy Infrastructure Fund, Inc. (“TPZ”), the newly formed exchange traded fund, Tortoise Power and
Energy Infrastructure Fund (the “Acquiring Fund”) acquired all of the net assets of Tortoise Pipeline and Energy Fund, Inc.,
Tortoise Energy Independence Fund, Inc., and Tortoise Power and Energy Infrastructure Fund, Inc. (the “Acquired Funds”) on
December 23, 2024. A total of 1,666,014 shares of NDP were exchanged for 3,407,320 shares of the Acquiring Fund, a total of 2,010,566
shares of TTP were exchanged for 4,843,279 of the Acquiring Fund, and a total of 5,890,167 shares of TPZ were exchanged for 5,890,167
of the Acquiring Fund on the closing date. The merger and reorganization into an actively managed ETF aims to provide shareholders with
a modernized fund structure that enhances liquidity and offers the potential for high current income through lower expenses, while also
reducing volatility associated with leverage. This merger qualified as tax-free reorganizations under Section 368(a)(1)(C) of the Internal
Revenue Code. Following the merger the combined net assets of the Acquiring Fund totaled $281,513,165. As of the date of the merger and
reorganization the combined balances for the entities for accumulated net investment loss was $22,052,793, accumulated net realized loss
on investment was $242,000,854, and net unrealized appreciation of investments and translations of foreign currency was $84,006,199.
For financial reporting purposes, assets received and shares
issued by the Acquiring Fund were recorded at fair value. However, the cost basis of the investments being received from the Acquired
Fund were carried forward to align ongoing reporting of the Acquiring Fund’s realized and unrealized gains and losses with amounts
distributable to shareholders for tax purposes.
The Board of Directors of TPZ approved a reorganization
plan for conversion of the Fund into an exchange traded fund and a reorganization into Tortoise Capital Series Trust on December 23, 2024.
Tortoise Capital Series Trust (the “Trust”) was organized as a Delaware statutory trust on August 23, 2024. The Trust is registered
under the Investment Company Act of 1940, as amended (the “1940 Act”), as an open-end management investment company.
Notes to Financial Statements (continued)
TYG:
On December 13, 2024, TYG amended its Second Amended and
Restated Credit agreement to increase the credit facility capacity from $45,000,000 to $80,000,000. The applicable rate and all other
terms were unchanged.
On December 18, 2024, TYG issued $25,000,000 Series RR
Senior Notes which carry a fixed rate interest rate of 5.83% and mature on December 18, 2031.
On December 18, 2024, TYG issued 1,500,000 Series G Mandatory
Redeemable Preferred Shares (aggregate liquidation preference $15,000,000) which carry a fixed rate interest rate of 5.96% and mature
on December 18, 2029.
On December 17, 2024, TYG Series E Mandatory Redeemable
Preferred Shares with aggregate liquidation preference of $15,660,610 and fixed rate of 4.34% were paid in full upon maturity.
On December 19, 2024, TYG Series L Senior Notes with a
notional value of $6,453,333 and fixed rate of 3.99% were paid in full upon maturity.
On December 31, 2024, TYG paid a distribution in the amount
of $0.365 per common share, for a total of $6,291,019.89. Of this total the dividend reinvestment amounted to $42.090.
TYG has performed an evaluation of subsequent events through
the date the financial statements were issued and has determined that no additional items require recognition or disclosure.
NTG:
On December 3, 2024, NTG Series E Mandatory Redeemable
Preferred Shares with aggregate liquidation preference of $3,848,475 and fixed rate of 3.78% were redeemed in full upon redemption date.
On December 13, 2024, NTG paid a distribution in the amount
of $0.530 per common share, for a total of $2,699,189.30. Of this total the dividend reinvestment amounted to $54.247.
NTG has performed an evaluation of subsequent events through
the date the financial statements were issued and has determined that no additional items require recognition or disclosure.
TTP:
On December 3, 2024, TTP Series H Senior Notes with a notional
value of $3,942,857 and fixed rate of 3.97% were redeemed in full upon redemption date.
On December 3, 2024, TTP Series B Mandatory Redeemable
Preferred Shares with aggregate liquidation preference of $6,100,000 and fixed rate of 4.57% were redeemed in full upon redemption date.
On December 13, 2024, TTP paid a distribution in the amount
of $0.175 per common share, for a total of $351,849.05. Of this total the dividend reinvestment amounted to $48.345.
TTP has performed an evaluation of subsequent events through
the date the financial statements were issued and has determined that no additional items require recognition or disclosure.
NDP:
On December 13, 2024, NDP paid a distribution in the amount
of $0.255 per common share, for a total of $424,833.57. Of this total the dividend reinvestment amounted to $41.151.
NDP has performed an evaluation of subsequent events through
the date the financial statements were issued and has determined that no items require recognition or disclosure.
TPZ:
On January 23, 2025, the Fund’s Board of Trustees
approved a change to the Fund’s name from Tortoise Power and Energy Infrastructure Fund, Inc. to Tortoise Essential Energy Fund
effective March 24, 2025.
TPZ has performed an evaluation of subsequent events through
the date the financial statements were issued and has determined that no additional items require recognition or disclosure.
TEAF:
On December 31, 2024, TEAF paid a distribution in the amount
of $0.09 per common share, for a total of $1,214,201.43. Of this total the dividend reinvestment amounted to $12.096.
TEAF has performed an evaluation of subsequent events through
the date the financial statements were issued and has determined that no additional items require recognition or disclosure.
2024 Annual Report | November
30, 2024
Report of Independent Registered Public Accounting Firm
To the Shareholders and
the Board of Directors of
Tortoise Energy Infrastructure Corp.
Tortoise Midstream Energy Fund, Inc.
Tortoise Pipeline &
Energy Fund, Inc.
Tortoise Energy Independence Fund, Inc.
Tortoise Power and Energy Infrastructure Fund, Inc.
Tortoise Sustainable and Social Impact Term Fund
Opinion on the Financial Statements
We have audited the accompanying consolidated statements
of assets and liabilities of Tortoise Energy Infrastructure Corp. and Tortoise Sustainable and Social Impact Term Fund (formerly Ecofin
Sustainable and Social Impact Term Fund), including the consolidated schedules of investments, as of November 30, 2024, and the related
consolidated statements of operations and cash flows for the year then ended, the consolidated statements of changes in net assets for
each of the two years in the period then ended, the consolidated financial highlights for each of the five years in the period then ended
and the related notes (collectively referred to as the “consolidated financial statements”). We have also audited the accompanying
statements of assets and liabilities of Tortoise Midstream Energy Fund, Inc, Tortoise Pipeline & Energy Fund, Inc., Tortoise Energy
Independence Fund, Inc., and Tortoise Power and Energy Infrastructure Fund, Inc. (collectively, together with Tortoise Energy Infrastructure
Corp. and Tortoise Sustainable and Social Impact Term Fund, referred to as the “Funds”), including the schedules of investments,
as of November 30, 2024, and the related statements of operations and cash flows for the year then ended, the statements of changes in
net assets for each of the two years in the period then ended, the financial highlights for each of the five years in the period then
ended and the related notes (collectively, together with the consolidated financial statements, referred to as the “financial statements”).
In our opinion, the financial statements present fairly, in all material respects, the financial position, or the consolidated financial
position, of each of the Funds at November 30, 2024, and the results, or the consolidated results, of their operations and their cash
flows for the year then ended, the changes or the consolidated changes in their net assets for each of the two years in the period then
ended and their financial highlights or consolidated financial highlights for each of the five years in the period then ended, in conformity
with U.S. generally accepted accounting principles.
Basis for Opinion
These financial statements are the responsibility of the
Funds’ management. Our responsibility is to express an opinion on each of the Funds’ financial statements based on our audits.
We are a public accounting firm registered with the Public Company Accounting Oversight Board (United States) (“PCAOB”) and
are required to be independent with respect to the Funds in accordance with the U.S. federal securities laws and the applicable rules
and regulations of the Securities and Exchange Commission and the PCAOB.
We conducted our audits in accordance with the standards
of the PCAOB. Those standards require that we plan and perform the audit to obtain reasonable assurance about whether the financial statements
are free of material misstatement, whether due to error or fraud. The Funds are not required to have, nor were we engaged to perform,
an audit of the Funds’ internal control over financial reporting. As part of our audits, we are required to obtain an understanding
of internal control over financial reporting but not for the purpose of expressing an opinion on the effectiveness of the Funds’
internal control over financial reporting. Accordingly, we express no such opinion.
Our audits included performing procedures to assess the
risks of material misstatement of the financial statements, whether due to error or fraud, and performing procedures that respond to those
risks. Such procedures included examining, on a test basis, evidence regarding the amounts and disclosures in the financial statements.
Our procedures included confirmation of securities owned as of November 30, 2024, by correspondence with the custodians, brokers and others.
Our audits also included evaluating the accounting principles used and significant estimates made by management, as well as evaluating
the overall presentation of the financial statements. We believe that our audits provide a reasonable basis for our opinion.

We have served as the auditor of one or more Tortoise investment
companies since 2004.
Minneapolis, Minnesota
January 29, 2025
Company
Officers and Directors (unaudited)
November 30, 2024
| Name
and Age(1) |
|
Position(s)
Held
With Company, Term
of Office and Length
of Time Served(2) |
|
Principal
Occupation During Past Five Years |
|
Number
of
Portfolios in
Fund Complex
Overseen
by Director(3) |
|
Other
Public
Company
Directorships
Held |
| Independent
Directors |
|
|
|
|
|
|
|
|
|
|
|
|
|
Conrad
S. Ciccotello
(Born 1960) |
|
Class
I Director of TYG since 2003 and of NTG since 2010; Class II Director of NDP since 2012 and of TPZ since 2007; Class III Director
of TTP since 2011; Class I Director of TEAF since 2019. |
|
Professor
and Director, Reiman School of Finance, University of Denver (faculty member since 2017); Senior Consultant to the finance practice
of Charles River Associates, which provides economic, financial, and management consulting services (since May 2020); Associate Professor
and Chairman of the Department of Risk Management and Insurance, Director of the Asset and Wealth Management Program, Robinson College
of Business, Georgia State University (faculty member from 1999-2017); Investment Consultant to the University System of Georgia
for its defined contribution retirement plan (2008-2017); Formerly Faculty Member, Pennsylvania State University (1997-1999); Published
a number of academic and professional journal articles on investment company performance and structure, with a focus on MLPs. |
|
7 |
|
CorEnergy
Infrastructure Trust, Inc.; Peachtree Alternative Strategies Fund |
Rand
C. Berney
(Born 1955) |
|
Class
I Director of TTP since 2014; Class II Director of each of TYG and NTG since 2014; Class III Director of TPZ since 2014 and of NDP
from 2014 to August 8, 2024; Class II Director of TEAF since 2019. |
|
Formerly
Executive-in-Residence, College of Business Administration, Kansas State University from 2012-2022; Formerly Senior Vice President
of Corporate Shared Services of ConocoPhillips from April 2009 to 2012, Vice President and Controller of ConocoPhillips from 2002
to April 2009, and Vice President and Controller of Phillips Petroleum Company from 1997 to 2002; Member of the Oklahoma Society
of CPAs, the Financial Executive Institute, American Institute of Certified Public Accountants, the Institute of Internal Auditors
and the Institute of Management Accountants. |
|
5 |
|
None |
Alexandra
Herger
(Born 1957) |
|
Class
I Director of each of NDP and TPZ since 2015; Class II Director of TTP since 2015; Class III Director of each of TYG and NTG since
2015; Class III Director of TEAF since 2019. |
|
Retired
in 2014; Previously interim vice president of exploration for Marathon Oil in 2014 prior to her retirement; Director of international
exploration and new ventures for Marathon Oil from 2008 to 2014; Held various positions with Shell Exploration and Production Co.
between 2002 and 2008; Member of the Society of Exploration Geophysicists, the American Association of Petroleum Geologists, the
Houston Geological Society and the Southeast Asia Petroleum Exploration Society; Member of the 2010 Leadership Texas/ Foundation
for Women’s Resources since 2010; Director of Panoro Energy ASA, an international independent oil and gas company listed on
the Oslo Stock Exchange; Director of Tethys Oil (Stockholm) and member of PGS (Oslo) nomination committee. |
|
6 |
|
None |
Gabriel
D. Gliksberg
(Born 1987) |
|
Class
III Director of NDP since August 8, 2024. |
|
Founder
and managing member of ATG Capital Management LLC, which provides investment management services to private funds and accounts. |
|
1 |
|
None |
| Interested Directors(4) |
|
|
|
|
|
|
H.
Kevin Birzer
(Born 1959) |
|
Class
I Director and Chairman of the Board of NDP since 2012 and of TPZ since 2007; Class II Director and Chairman of the Board of TTP
since 2011; Class III Director and Chairman of the Board of TYG since 2003 and of NTG since 2010; Class III Director and Chairman
of the Board of TEAF since 2019. |
|
Chief
Executive Officer of the Adviser; Managing Director of the Adviser and member of the Investment Committee of the Adviser since 2002.
CFA designation since 1988. |
|
6 |
|
None |
| (1) | The address of each director and officer
is 5901 College Boulevard, Suite 400, Overland Park, Kansas 66211. |
| (2) | Ending year of Director terms by Class are
as follows: |
| | |
| TYG
| | |
| NTG
| | |
| TTP
| | |
| NDP
| | |
| TPZ
| | |
| TEAF | |
| Class I | |
| 2023 | | |
| 2023 | | |
| 2024 | | |
| 2025 | | |
| 2025 | | |
| 2023 | |
| Class II | |
| 2024 | | |
| 2024 | | |
| 2025 | | |
| 2023 | | |
| 2023 | | |
| 2024 | |
| Class III | |
| 2025 | | |
| 2025 | | |
| 2023 | | |
| 2024 | | |
| 2024 | | |
| 2025 | |
| (3) | This number includes TYG, NTG, TTP, NDP,
TPZ and TEAF. For Mr. Ciccotello, this number also includes the Tax-Advantaged Social Impact
Fund, Inc. (”TSIFX”). The Adviser serves as the investment adviser to TYG, NTG,
TTP, NDP, TPZ, TEAF and TSIFX. |
| (4) | As a result of their respective positions
held with the Adviser or its affiliates, these individuals are considered “interested
persons” within the meaning of the 1940 Act. |
2024 Annual Report |
November 30, 2024
Company
Officers and Directors (unaudited) (continued)
November
30, 2024
| Name
and Age(1) |
|
Position(s)
Held
With Company,
Term
of Office and Length
of Time Served(2) |
|
Principal
Occupation During Past Five Years |
|
Number
of
Portfolios
in
Fund Complex
Overseen
by Director |
|
Other
Public
Company
Directorships
Held by
Officer |
| Interested
Officers(3) |
|
|
|
|
|
Matthew
G.P. Sallee
(Born 1978) |
|
Chief
Executive Officer of TYG, NTG, TPZ, TTP, NDP and TEAF since June 7, 2024; President of TYG and NTG since June 30, 2015. |
|
Managing
Director of the Adviser since January 2014 and a member of the Investment Committee of the Adviser since J une 30, 2015; Senior Portfolio
Manager of the Adviser since February 2019; Portfolio Manager of the Adviser from July 2013 to January 2019; CFA designation since
2009. |
|
N/A |
|
None |
Brian
A. Kessens
(Born 1975) |
|
President
of TTP and TPZ since June 30, 2015. |
|
Managing
Director of the Adviser since January 2015 and a member of the Investment Committee of the Adviser since June 30, 2015; Senior Portfolio
Manager of the Adviser since February 2019; Portfolio Manager of the Adviser from July 2013 to January 2019; CFA designation since
2006. |
|
N/A |
|
None |
Robert
J. Thummel, Jr.
(Born 1972) |
|
President
of NDP since June 30, 2015. |
|
Managing
Director of the Adviser since January 2014 and a member of the Investment Committee of the Adviser since June 30, 2015; Senior Portfolio
Manager of the Adviser since February 2019; Portfolio Manager of the Adviser from July 2013 to January 2019. |
|
N/A |
|
None |
Shobana
Gopal
(Born 1962) |
|
Vice
President of TYG, NTG, TPZ, TTP and NDP since June 30, 2015, and of TEAF since November 5, 2018. |
|
Managing
Director – Tax of the Adviser since July 2021; Director, Tax of the Adviser from January 2013 to July 2021; Tax Analyst of
the Adviser from September 2006 through December 2012; Vice President of TSIFX since February 2018. |
|
N/A |
|
None |
Sean
Wickliffe
(Born 1989) |
|
Principal
Financial Officer and Treasurer of each of TYG, NTG, TTP, NDP and TEAF since April 1, 2024; Vice President and Assistant Treasurer
of each of TYG, NTG, TPZ, TTP, NDP and TEAF from July 14, 2021 to April 1, 2024. |
|
Vice
President – Financial Operations of the Adviser since January 2021; Senior Financial Operations Analyst of the Adviser from
January 2020 to January 2021; Financial Operations Analyst of the Adviser from December 2016 to January 2020; Junior Financial Operations
Analyst of the Adviser from November 2015 to December 2016. |
|
N/A |
|
None |
Diane
Bono
(Born 1958) |
|
Chief
Compliance Officer of TYG since 2006 and of each of NTG, TPZ, TTP and NDP and TEAF since its inception; Secretary of TYG, NTG, TPZ,
TTP and NDP since May 2013 and of TEAF since November 5, 2018. |
|
Managing
Director of the Adviser since January 2018; Chief Compliance Officer of the Adviser since June 2006; Chief Compliance Officer and
Secretary of TSIFX since February 2018. |
|
N/A |
|
None |
| (1) | The address of each director and officer
is 5901 College Boulevard, Suite 400, Overland Park, KS 66211. |
| (2) | Officers are elected annually. |
| (3) | As a result of their respective positions
held with the Adviser or its affiliates, these individuals are considered “interested
persons” within the meaning of the 1940 Act. |
Additional Information
(unaudited)
Notice to Shareholders
For stockholders that do not have a November 30,
2024 tax year end, this notice is for information purposes only. For stockholders with a November 30, 2024 tax year end, please consult
your tax advisor as to the pertinence of this notice. For the fiscal year ended November 30, 2024, each Fund is designating the following
items with regard to distributions paid during the year.
| Common Distributions |
|
|
|
|
|
| |
Return
Of Capital |
Long-Term
Capital Gain |
Ordinary
Income |
Total |
Qualifying |
Qualifying
For Corporate |
| |
Distributions |
Distributions(1) |
Distributions |
Distributions |
Dividends(2) |
Dividends
Rec. Deduction(3) |
| TYG |
84.80% |
0.00% |
15.20% |
100.00% |
100.00% |
100.00% |
| NTG |
89.47% |
0.00% |
10.53% |
100.00% |
100.00% |
100.00% |
| TTP |
85.77% |
0.00% |
14.23% |
100.00% |
100.00% |
100.00% |
| NDP |
83.06% |
0.00% |
16.94% |
100.00% |
100.00% |
100.00% |
| TPZ |
73.29% |
0.00% |
26.71% |
100.00% |
66.13% |
54.04% |
| TEAF |
51.47% |
0.00% |
48.53% |
100.00% |
36.87% |
20.78% |
| |
| Preferred Distributions |
|
|
|
|
| |
Return
Of Capital |
Long-Term
Capital Gain |
Ordinary
Income |
Total |
Qualifying |
Qualifying
For Corporate |
| |
Distributions |
Distributions(1) |
Distributions |
Distributions |
Dividends(2) |
Dividends
Rec. Deduction(3) |
| TYG |
0.00% |
0.00% |
100.00% |
100.00% |
100.00% |
100.00% |
| NTG |
0.00% |
0.00% |
100.00% |
100.00% |
100.00% |
100.00% |
| TTP |
0.00% |
0.00% |
100.00% |
100.00% |
100.00% |
100.00% |
| (1) | The Fund designates long-term capital gain
distributions per IRC Code Sec. 852(b)(3)(C). The long-term capital gain tax rate is variable
based on the taxpayer’s taxable income. |
| (2) | Represents the portion of Ordinary Income
Distributions taxable at the capital gain tax rates if the stockholder meets holding period
requirements. |
| (3) | Represents the portion of Ordinary Income
Distributions which qualify for the “Corporate Dividends Received Deduction.” |
Stockholder Proxy Voting Results
The annual meeting of stockholders for each Fund
was held on August 8, 2024. The matters considered at the meeting by each fund, together with the actual vote tabulations relating to
such matters are as follows:
| 1. | For all Companies: To elect the following individual as director of the Fund, to hold office for a term of three years and until their
successors are duly elected and qualified. |
| | |
TYG | |
NTG | |
TTP | |
TPZ | |
TEAF |
| Rand C. Berney | |
| | | |
| | | |
| | | |
| | | |
| | |
| Affirmative | |
| 2,254,485 | | |
| 453,939 | | |
| 244,000 | | |
| 3,721,994 | | |
| 10,272,247 | |
| Withheld | |
| — | | |
| —- | | |
| — | | |
| 764,622 | | |
| 1,221,473 | |
| TOTAL | |
| 2,254,485 | | |
| 453,939 | | |
| 244,000 | | |
| 4,486,616 | | |
| 11,493,720 | |
| | |
| NDP(1) | | |
| | | |
| | | |
| | | |
| | |
| Affirmative for Rand C. Berney | |
| 357,849 | | |
| | | |
| | | |
| | | |
| | |
| Affirmative for Gabriel D. Gliksberg | |
| 610,206 | | |
| | | |
| | | |
| | | |
| | |
| Affirmative for Aaron T. Morris | |
| 605,460 | | |
| | | |
| | | |
| | | |
| | |
| Withheld | |
| 74,329 | | |
| | | |
| | | |
| | | |
| | |
| TOTAL | |
| 1,647,844 | | |
| | | |
| | | |
| | | |
| | |
H. Kevin Birzer and Alexandra A. Herger continue
as a director with terms expiring on the date of the 2025 annual meeting of stockholders. Conrad S. Ciccotello continues as a director
with his term expiring on the date of the 2026 annual meeting of stockholders.
(1) For NDP only: Nominating stockholder proposal
to replace Rand C. Berney and elect Gabriel D. Gliksberg or Aaron T. Morris
| 2. | | For all companies: To ratify the selection of Ernst & Young LLP as the independent registered
public accounting firm for the fiscal year ending November 30, 2024. |
| | |
TYG | |
NTG | |
TTP | |
NDP | |
TPZ | |
TEAF |
| Affirmative | | |
| 10,206,651 | | |
| 4,445,044 | | |
| 1,842,885 | | |
| 1,024,638 | | |
| 4,389,555 | | |
| 11,210,543 | |
| Against | | |
| 516,212 | | |
| 110,219 | | |
| 12,923 | | |
| 6,764 | | |
| 43,427 | | |
| 66,010 | |
| Abstain | | |
| 60,896 | | |
| 163,050 | | |
| 11,819 | | |
| 5,449 | | |
| 53,634 | | |
| 212,167 | |
| TOTAL | | |
| 10,783,759 | | |
| 4,718,313 | | |
| 1,867,627 | | |
| 1,036,851 | | |
| 4,486,616 | | |
| 11,488,720 | |
2024 Annual Report |
November 30, 2024
Additional Information
(unaudited) (continued)
| 3. | | For all companies: To consider and take action on the non-binding Stockholder Proposal requesting
declassification of the Board of Directors to elect each director annually. |
| | |
TYG | |
NTG | |
TTP | |
NDP | |
TPZ | |
TEAF |
| Affirmative | |
| 3,611,769 | | |
| 1,614,177 | | |
| 651,819 | | |
| 822,955 | | |
| 1,746,678 | | |
| 4,092,196 | |
| Against | |
| 2,995,629 | | |
| 1,101,251 | | |
| 468,067 | | |
| 205,556 | | |
| 646,084 | | |
| 1,057,881 | |
| Abstain | |
| 83,721 | | |
| 46,110 | | |
| 9,829 | | |
| 8,338 | | |
| 36,019 | | |
| 137,750 | |
| Broker non-votes | |
| 4,092,640 | | |
| 1,956,775 | | |
| 737,912 | | |
| — | | |
| 2,057,835 | | |
| 6,205,893 | |
| TOTAL | |
| 10,783,759 | | |
| 4,718,313 | | |
| 1,867,627 | | |
| 1,036,849 | | |
| 4,486,616 | | |
| 11,493,720 | |
| 4. | For TPZ and NDP: To consider and take action on the non-binding Stockholder Proposal requesting consideration of measures to allow
stockholders to monetize shares subject to specified conditions. |
| | |
NDP | |
TPZ |
| Affirmative | |
| 805,687 | | |
| 860,401 | |
| Against | |
| 220,033 | | |
| 1,534,230 | |
| Abstain | |
| 11,128 | | |
| 34,148 | |
| Broker non-votes | |
| — | | |
| 2,057,837 | |
| TOTAL | |
| 1,036,848 | | |
| 4,486,616 | |
Director and Officer Compensation
The Funds do not compensate any of its directors
who are “interested persons,” as defined in Section 2(a)(19) of the 1940 Act, nor any of its officers. For the period from
December 1, 2023 through November 30, 2024, the aggregate compensation paid by the Funds to the independent directors was as follows:
| TYG |
NTG |
TTP |
NDP |
TPZ |
TEAF |
| $98,200 |
$98,200 |
$66,000 |
$68,040 |
$84,600 |
$84,600 |
The Funds did not pay any special compensation
to any of its directors or officers.
Forward-Looking Statements
This report contains “forward-looking statements”
within the meaning of the 1933 Act and the Securities Exchange Act of 1934, as amended. By their nature, all forward-looking statements
involve risks and uncertainties, and actual results could differ materially from those contemplated by the forward-looking statements.
Several factors that could materially affect each Fund’s actual results are the performance of the portfolio of investments held
by it, the conditions in the U.S. and international financial, petroleum and other markets, the price at which shares of each Fund will
trade in the public markets and other factors discussed in filings with the Securities and Exchange Commission (SEC).
Proxy Voting Policies
A description of the policies and procedures that
each Fund uses to determine how to vote proxies relating to portfolio securities owned by the Fund and information regarding how each
Fund voted proxies relating to the portfolio of securities during the 12-month period ended June 30, 2024 are available to stockholders
(i) without charge, upon request by calling the Adviser at (913) 981-1020 or toll-free at (866) 362-9331 and on or through the Adviser’s
Web site at www.tortoiseadvisors.com; and (ii) on the SEC’s Web site at www.sec.gov.
Form N-PORT
Each Fund files its complete schedule of portfolio
holdings for the first and third quarters of each fiscal year with the SEC on Part F of Form N-PORT. Each Fund’s Form Part F of
Form N-PORT are available without charge upon request by calling the Adviser at (866) 362-9331 or by visiting the SEC’s Web site
at www.sec.gov.
Each Fund’s N-PORTs are also available through
the Adviser’s Web site at www.tortoiseadvisors.com.
Statement of Additional Information
The Statement of Additional Information (“SAI”)
includes additional information about each Fund’s directors and is available upon request without charge by calling the Adviser
at (866) 362-9331 or by visiting the SEC’s Web site at www.sec.gov.
Certifications
Each Fund’s Chief Executive Officer has
submitted to the New York Stock Exchange the annual CEO certification as required by Section 303A.12(a) of the NYSE Listed Company Manual.
Each Fund has filed with the SEC, as an exhibit
to its most recently filed Form N-CSR, the certification of its Chief Executive Officer and Principal Financial Officer required by Section
302 of the Sarbanes-Oxley Act.
Additional Information
(unaudited) (continued)
Privacy Policy
In order to conduct its business, each Fund collects
and maintains certain nonpublic personal information about its stockholders of record with respect to their transactions in shares of
each Fund’s securities. This information includes the stockholder’s address, tax identification or Social Security number,
share balances, and distribution elections. We do not collect or maintain personal information about stockholders whose share balances
of our securities are held in “street name” by a financial institution such as a bank or broker.
We do not disclose any nonpublic personal information
about you, the Funds’ other stockholders or the Funds’ former stockholders to third parties unless necessary to process a
transaction, service an account, or as otherwise permitted by law.
To protect your personal information internally,
we restrict access to nonpublic personal information about the Funds’ stockholders to those employees who need to know that information
to provide services to our stockholders. We also maintain certain other safeguards to protect your nonpublic personal information.
Repurchase Disclosure
Notice is hereby given in accordance with Section
23(c) of the 1940 Act, that each Fund may from time to time purchase shares of its common stock in the open market.
Automatic Dividend Reinvestment
Each of NTG, TTP, NDP and TPZ have an Automatic
Dividend Reinvestment Plan and TYG has an Automatic Dividend Reinvestment and Cash Purchase Plan (each, a “Plan”). Each Plan
allows participating common stockholders to reinvest distributions, including dividends, capital gains and return of capital in additional
shares of the Fund’s common stock and TYG’s Plan also allows registered holders of the TYG’s common stock to make optional
cash investments, in accordance with TYG’s Plan, on a monthly basis.
If a stockholder’s shares are registered
directly with the Fund or with a brokerage firm that participates in the Fund’s Plan, all distributions are automatically reinvested
for stockholders by the Agent in additional shares of common stock of the Fund (unless a stockholder is ineligible or elects otherwise).
Stockholders holding shares that participate in the Plan in a brokerage account may not be able to transfer the shares to another broker
and continue to participate in the Plan. Stockholders who elect not to participate in the Plan will receive all distributions payable
in cash paid by check mailed directly to the stockholder of record (or, if the shares are held in street or other nominee name, then to
such nominee) by Computershare, as dividend paying agent. Distributions subject to tax (if any) are taxable whether or not shares are
reinvested.
Any single investment pursuant to the cash purchase
option under TYG’s Plan must be in an amount of at least $100 and may not exceed $5,000 per month unless a request for waiver has
been granted. A request for waiver should be directed to TYG at 1-866-362-9331 and TYG has the sole discretion to grant any requested
waiver. Optional cash investments may be delivered to the Agent by personal check, by automatic or electronic bank account transfer or
by online access at www.computershare.com. TYG reserves the right to reject any purchase order. Stockholders who hold shares in street
or other nominee name who want to participate in optional cash investments should contact their broker, bank or other nominee and follow
their instructions. There is no obligation to make an optional cash investment at any time, and the amount of such investments may vary
from time to time. Optional cash investments must be received by the Agent no later than two business days prior to the monthly investment
date (the “payment date”) for purchase of common shares on the next succeeding purchase date under TYG’s Plan. Scheduled
optional cash purchases may be cancelled or refunded upon a participant’s written request received by the Agent at least two business
days prior to the purchase date. Participants will not be able to instruct the Agent to purchase common shares at a specific time or at
a specific price.
If on the distribution payment date or, for TYG,
the purchase date for optional cash investments, the net asset value per share of the common stock is equal to or less than the market
price per share of common stock plus estimated brokerage commissions, the Fund will issue additional shares of common stock to participants.
The number of shares will be determined by the greater of the net asset value per share or 95 percent of the market price. Otherwise,
shares generally will be purchased on the open market by the Agent as soon as possible following the payment date or purchase date, but
in no event later than 30 days after such date except as necessary to comply with applicable law. There are no brokerage charges with
respect to shares issued directly by the Fund as a result of distributions payable either in shares or in cash or, for TYG, as a result
of optional cash investments. However, each participant will pay a pro rata share of brokerage commissions incurred with respect to the
Agent’s open-market purchases in connection with the reinvestment of distributions or optional cash investments. If a participant
elects to have the Agent sell part or all of his or her common stock and remit the proceeds, such participant will be charged a transaction
fee of $15.00 plus his or her pro rata share of brokerage commissions on the shares sold.
Participation is completely voluntary. Stockholders
may elect not to participate in the Plan, and participation may be terminated or resumed at any time without penalty, by giving notice
in writing, by telephone or Internet to Computershare, the Plan Agent, at the address set forth below. Such termination will be effective
with respect to a particular distribution if notice is received prior to such record date.
Additional information about the Plan may be obtained
by writing to Computershare Trust Company, N.A, P.O. Box 30170, College Station, TX 77842-3170. You may also contact Computershare by
phone at (800) 426-5523 or visit their Web site at www.computershare.com.
2024 Annual Report |
November 30, 2024
Additional Information
(unaudited) (continued)
Approval of the Investment Advisory Agreements
for TYG, NTG, TPZ, TTP and TEAF
In 2024, in approving the renewal of the respective
Investment Advisory Agreement of each of TYG and TEAF, and to the extent the merger of NTG with and into TYG, and the mergers of TPZ and
TTP with and into an actively traded ETF in the Tortoise Capital Series Trust do not close on or prior to December 31, 2024, the renewal
of the respective Investment Advisory Agreement of each of NTG, TPZ, and TTP, the Board followed their established process. As part of
this process, the directors who are not “interested persons” (as defined in the Investment Company Act of 1940) of the fund
(“Independent Directors”) requested and received extensive data and information from the Adviser concerning the fund and the
services provided to it by the Adviser under the Investment Advisory Agreement, including information from independent, third-party sources,
regarding the factors considered in their evaluation. Before the Independent Directors voted on approval of the Investment Advisory Agreement,
the Independent Directors met with independent legal counsel during an executive session and discussed the agreements and related information.
Factors Considered for Each Fund
The Board, including the Independent Directors,
considered and evaluated all the information provided by the Adviser. The Board, including the Independent Directors, did not identify
any single factor as being all-important or controlling, and individual directors may have attributed different levels of importance to
different factors. In deciding to renew the fund’s agreement, the decision of the Board, including the Independent Directors, was
based on the following factors.
Nature, Extent and Quality of Services Provided.
The Board considered information regarding the history, qualification and background of the Adviser and the individuals primarily
responsible for the portfolio management of the fund. Additionally, the Board considered the quality and extent of the resources devoted
to research and analysis of the fund’s actual and potential investments, including the research and decision-making processes utilized
by the Adviser, as well as risk oversight and the methods adopted to seek to achieve compliance with the investment objectives, policies
and restrictions of the fund, and meeting regulatory requirements. Further, the Board considered the quality and depth of the Adviser
personnel (including the number and caliber of portfolio managers and research analysts involved and the size and experience of the investment,
accounting, trading, client service and compliance teams dedicated to the fund), and other Adviser resources, use of affiliates of the
Adviser, and the particular expertise with respect to energy companies, MLP markets and financing (including private financing). The Board
also considered the Adviser’s efforts to reduce the fund’s market price discount to net asset value, and to manage the use
of leverage in the fund.
In addition to advisory services, the Board considered
the quality of the administrative and other non-investment advisory services provided to the fund. The Adviser provides the fund with
certain services (in addition to any such services provided to the fund by third parties) and officers and other personnel as are necessary
for the operations of the fund. In particular, the Adviser provides the fund with the following administrative services including, among
others: (i) preparing disclosure documents, such as periodic stockholder reports and the prospectus and the statement of additional information
in connection with public offerings; (ii) communicating with analysts to support secondary market analysis of the fund; (iii) oversight
of daily accounting and pricing; (iv) preparing periodic filings with regulators and stock exchanges; (v) overseeing and coordinating
the activities of other service providers, including with respect to TEAF, the third-party Sub-Adviser; (vi) organizing Board meetings
and preparing the materials for such Board meetings; (vii) providing compliance support; (viii) furnishing analytical and other support
to assist the Board in its consideration of strategic issues; (ix) the responsible handling of the leverage target; and (x) performing
other administrative services for the operation of the fund, such as press releases, fact sheets, html e-mails and commentaries, leverage
financing, tax reporting, tax management, fulfilling regulatory filing requirements and investor relations services. The Adviser also
provides brand level thought leadership in the form of written insights, podcasts, timely updates, webinars and media placements.
The Board also reviewed information received from
the Adviser and the fund’s Chief Compliance Officer (the “CCO”) regarding the compliance policies and procedures established
pursuant to the 1940 Act and their applicability to the fund, including the fund’s Code of Ethics.
The Board, including the Independent Directors,
concluded that the nature of the fund and the specialized expertise of the Adviser in energy infrastructure, including midstream, utilities
and renewables for TYG, midstream equity for NTG and TTP, energy and power sectors for TPZ, and essential asset sectors with respect to
TEAF, as well as the nature, extent and quality of services provided by the Adviser, made the Adviser qualified to serve as the adviser.
The Independent Directors recognized that the Adviser’s commitment to a long-term investment horizon correlated well to the investment
strategy of the fund.
Investment Performance of the Fund and the
Adviser, Costs of the Services To Be Provided and Profits To Be Realized by the Adviser and its Affiliates from the Relationship, and
Fee Comparisons. The Board reviewed and evaluated information regarding the fund’s performance and the performance of other
Adviser accounts (including other investment companies), and information regarding the nature of the markets during the performance period,
with a particular focus on energy infrastructure equities including midstream, utilities and renewables for TYG, on midstream equity for
each of NTG and TTP, on power and energy infrastructure for TPZ, and on the essential asset sectors with respect to TEAF. The Board considered
the fund’s investment performance against peer funds for the following periods: one year, three year, five year, ten year and since
inception for each of TYG, NTG, TTP and TPZ, for one year, three year, five year and since inception for TEAF, and for each of 2022, 2023
and fiscal year-to-date 2024 for each of TYG, NTG, TTP, TPZ and TEAF, as well as against specialized sector (including a custom composite
of sector indices (“custom composite”) for TPZ) and more general market indices for the same periods for the fund. The Board
also considered senior management’s and portfolio managers’ analysis of the reasons for any over-
Additional Information
(unaudited) (continued)
performance or underperformance against its peers
and/or sector market indices, as applicable. The Board noted that for the relevant periods, based on NAV: TYG outperformed the median
for its peers in the fiscal year-to-date 2024 period, and underperformed the median of its peers in the other periods. TYG underperformed
two of the specialized sector market indices except for year-to-date 2024, outperformed one of the specialized indices for the one year
period, 2022 and fiscal year-to-date 2024 and underperformed in 2023, and outperformed the general market index in the one year and three
year periods, 2022 and fiscal year-to-date 2024, and underperformed in the other periods. NTG and TTP underperformed the median for their
peers in all periods, except for the one year period and fiscal year-to-date 2024, and with respect to TTP for 2023, where they outperformed
the median for their peers. NTG and TTP underperformed one of the specialized sector market indices in all periods except the one year
period and fiscal year-to date 2024, outperformed the other specialized sector market index in the one year and three year periods, 2022
and fiscal year-to-date 2024, and for TTP in 2023, and underperformed the index in the other periods. NTG and TTP outperformed the general
market index in the one year and three year periods, 2022 and fiscal year-to-date 2024, and underperformed in the other periods. TPZ performed
in line with the median for its peers in fiscal year-to-date 2024, outperformed the median for its peers in the since inception period,
and underperformed in the other periods. TPZ outperformed the custom composite for the one year, three year and since inception periods,
2022, 2023 and fiscal year-to-date 2024, and underperformed the custom composite in the five year and 10 year periods, and underperformed
the general market index in all periods except the three year period, 2022 and 2023 where it outperformed the index, and the one year
period where it performed in line with the index. TEAF underperformed the median of its peers in all applicable periods except 2022. TEAF
underperformed the specialized sector market index in all applicable periods, and underperformed the general market index in all applicable
periods except for 2022 where it outperformed the index. The Board noted that for the relevant periods, based on market price, TYG underperformed
the median of its peers except for year-to-date 2024, where it outperformed the median of its peers. NTG and TTP underperformed the median
for their peers in all periods, except for the one year period and fiscal year-to-date 2024, where they outperformed the median for their
peers. TPZ outperformed the median for its peers for the one year and since inception periods, 2023 and the fiscal year-to-date 2024 period,
and underperformed the median for its peers in the three year, five year and 10 year periods and 2022. TEAF underperformed the median
for its peers for the three year, five year and since inception periods, 2023, and the fiscal year-to-date 2024 period, performed in line
with the median for its peers in the one year period, and outperformed the median for its peers in 2022. For TPZ, the Board noted the
lack of peers and sector market indices with similar strategies to the fund and also took into account the custom composite to better
reflect the strategy of the fund. The Adviser believes that performance relative to the applicable custom composite for TPZ is an appropriate
performance metric for the fund. The Board also noted that the custom composite for TPZ and the sector market indices are pre-expenses,
in contrast to the fund and its peers, and the sector market indices are pre-tax accrual similar to TYG and NTG but in contrast with their
MLP peers. The Board also noted differences across the peer universe in distribution and leverage strategies, including the fund’s
focus on sustainable distributions and leverage strategy, and took into account that stockholders, in pursuing their investment goals
and objectives, may have purchased their shares based upon the reputation and the investment style, long-term philosophy and strategy
of the Adviser. The Board also considered discussions with the Adviser regarding a variety of initiatives for the fund, including the
Adviser’s plans to continue aftermarket support and investor communications. Based upon their review and also considering market
conditions and volatility in 2024, the Board, including the Independent Directors, concluded that the fund’s performance has been
reasonable based on the fund’s strategy and compared to other closed-end funds that focus on the applicable sectors discussed above.
The Adviser provided detailed information concerning
its cost of providing services to the fund, its profitability in managing the fund, its overall profitability, and its financial condition.
The Board reviewed the methodology used to prepare this financial information. This financial information regarding the Adviser is considered
in order to evaluate the Adviser’s financial condition, its ability to continue to provide services under the Investment Advisory
Agreement, and the reasonableness of the current management fee, and was, to the extent possible, evaluated in comparison to other more
specialized investment advisers.
The Board considered and evaluated information
regarding fees charged to, and services provided to, other investment companies advised by the Adviser (including the impact of any fee
waiver or reimbursement arrangements and any expense reimbursement arrangements), and fees charged to separate institutional accounts
and other accounts managed by the Adviser. The information provided to the Board discussed the significant differences in scope of services
provided to the fund and to the Adviser’s other non-closed-end fund clients. The Board considered the fee comparisons in light of
the different services provided in managing these other types of clients. The Board considered and evaluated the information comparing
the fund’s contractual annual management fee and overall expenses with a peer group of comparable closed-end funds with similar
investment objectives and strategies, including other MLP or energy investment companies, as applicable depending on the fund, and with
respect to TEAF with a group of comparable funds that are multi strategy including significant allocations to private investments as well
as funds structured as a term fund, in each case as determined by the Adviser. The Board also considered the management fee (based on
total managed assets) charged by the Adviser to other Tortoise funds compared to the management fee of TEAF. The Board noted that the
management fee paid by TEAF is higher than the management fees paid by the other Tortoise funds, but were advised by the Adviser that
there are additional portfolio management challenges in managing a multi-strategy defined term fund such as TEAF. The Board also considered
that the sub-advisory fee to the third-party sub-adviser is paid by the Adviser and TEAF incurs no additional expense for the sub-adviser’s
services. Given the specialized universe of managers and funds fitting within the criteria for the peer group as well as a lack of reliable,
consistent third-party data, the Adviser did not believe that it would be beneficial to engage the services of an independent third-party
to prepare the peer group analysis, and the Board, including the Independent Directors, concurred with this approach. The Adviser provided
information on the methodology used for determining the peer group.
2024 Annual Report |
November 30, 2024
Additional Information
(unaudited) (continued)
The Board, including the Independent Directors,
concluded that the fees (including the management fee) and expenses that the fund is paying under the Investment Advisory Agreement, as
well as the operating expense ratios of the fund, are reasonable given the nature, extent and quality of services provided under the Investment
Advisory Agreement and that such fees and expenses are reasonable compared to the fees charged by advisers to comparable funds.
Economies of Scale. The Board considered
information from the Adviser concerning whether economies of scale would be realized as the fund grows, and whether fee levels reflect
any economies of scale for the benefit of the fund’s stockholders. The Board, including the Independent Directors, concluded that
economies of scale are difficult to measure and predict overall. Accordingly, the Board reviewed other information, such as year-over-year
profitability of the Adviser generally, the profitability of its management of the fund, and the fees of competitive funds not managed
by the Adviser over a range of asset sizes. The Board, including the Independent Directors, concluded the Adviser is appropriately sharing
any economies of scale through its fee structure and through reinvestment in its business resources to provide stockholders additional
content and services.
Collateral Benefits Derived by the Adviser.
The Board reviewed information from the Adviser concerning collateral benefits it receives as a result of its relationship with
the fund. The Board, including the Independent Directors, concluded that the Adviser generally does not directly use the fund’s
or stockholder information to generate profits in other lines of business, and therefore does not derive any significant collateral benefits
from them.
The Board did not, with respect to their deliberations
concerning their approval of the continuation of the Investment Advisory Agreement, consider the benefits the Adviser may derive from
relationships the Adviser may have with brokers through soft dollar arrangements because the Adviser does not employ any third party soft
dollar arrangements in rendering its advisory services to the fund. The Adviser receives unsolicited research from some of the brokers
with whom it places trades on behalf of clients, however, the Adviser has no arrangements or understandings with such brokers regarding
receipt of research in return for commissions. The Adviser does not consider this research when selecting brokers to execute fund transactions
and does not put a specific value on unsolicited research, nor attempt to estimate and allocate the relative costs or benefits among clients.
Conclusions of the Directors
The Board, including the Independent Directors,
concluded that no single factor reviewed was determinative as the principal factor in whether to approve the Investment Advisory Agreement.
The process, as discussed above, describes only the most important factors, but not all of the matters, considered by the Board. On the
basis of such information as the Board considered necessary to the exercise of its reasonable business judgment and its evaluation of
all of the factors described above, and after discussion and as assisted by the advice of legal counsel that is independent of the Adviser,
the Independent Directors determined that each factor, in the context of all of the other factors they considered, favored approval of
the Investment Advisory Agreement. It was noted that it was the judgment of the Board, including the Independent Directors, that approval
of the Investment Advisory Agreement was in the best interests of the fund and its stockholders. The Board, and separately, all of the
Independent Directors, therefore unanimously concluded that the Investment Advisory Agreement between the fund and the Adviser is fair
and reasonable in light of the services provided and should be renewed.
Approval of the Sub-Advisory Agreement for
TEAF
In approving the investment sub-advisory agreement
between the Adviser and RWC Asset Management LLP (the “Sub-Adviser”) with respect to TEAF (the “TEAF Investment Sub-Advisory
Agreement”), the Independent Directors requested and received extensive data and information from the Adviser concerning the fund
and the services to be provided by the Sub-Adviser under the TEAF Investment Sub-Advisory Agreement. The Sub-Adviser’s principal
owner, together with each of the principal owner’s parent and subsidiary companies are collectively referred to as Redwheel. Before
the Independent Directors voted on approval of the TEAF Investment Sub-Advisory Agreement, the Independent Directors met with independent
legal counsel during an executive session and discussed the agreements and related information.
Factors Considered by the Board
In approving the Sub-Advisory Agreement, the Board
of Directors evaluated information provided by the Advisor and legal counsel and considered various factors, including:
Investment
Performance of the Fund. The Board of Directors reviewed the nature, extent and quality of the investment advisory services proposed
to be provided to the Advisor by RWC and found them to be consistent with the services provided to the Advisor by Ecofin and the services
provided by the Advisor. In connection with the approval of the continuation of the Investment Advisory Agreement in November 2023, the
Board reviewed and evaluated information regarding the Company’s performance and the performance of other Advisor accounts (including
other investment companies), and information regarding the nature of the markets during the performance period, with a particular focus
on the essential asset sectors with respect to the Company. With respect to RWC, the Board considered that Redwheel does not currently
operate any strategies in the infrastructure sector while it noted that Redwheel launched a clean economy strategy (within its Luxembourg
UCITS umbrella) in late 2023 which shares characteristics with the infrastructure sector but has a track record of under one year. The
Board also considered Redwheel’s experience as an investment adviser for another listed equity fund and other registered investment
companies. The Board further considered that as part of the Redwheel-Ecofin Transaction, Ecofin’s investment team, including the
Ecofin portfolio managers
Additional Information
(unaudited) (continued)
for the Company, will become employees of Redwheel
and continue to be the individuals responsible for managing the applicable sleeve of assets of the Company they previously managed as
Ecofin portfolio managers. The Board further considered that the investment philosophy will remain the same as it relates to the Company.
As a result, the Board does not expect the Company’s performance to be adversely affected by the Redwheel-Ecofin Transaction.
Cost of the Services to be Provided. The
Board had previously considered detailed information concerning the Advisor’s cost of providing services to the Company, its profitability
in managing the Company, its overall profitability, and its financial condition. The Board reviewed the financial report of RWC. This
financial information was considered to evaluate RWC’s financial condition, its ability to provide services under the New Sub-Advisory
Agreement, and the reasonableness of the proposed sub-advisory fee to be paid by the Advisor. The Board considered that under the New
Sub-Advisory Agreement, the fee to RWC is paid by the Advisor and the Company incurs no additional expense for RWC’s services. In
addition, the Board took into account that the fee to RWC under the New Sub-Advisory Agreement is the same fee as is currently in place
under the Current Sub-Advisory Agreement. The Board, including the Independent Directors, concluded that the fees to be paid by the Advisor
to RWC under the New Sub-Advisory Agreement are reasonable given the nature, extent and quality of services provided under the Current
Sub-Advisory Agreement.
Economies of Scale. The Board previously
considered information from the Advisor concerning whether economies of scale would be realized as the Company grows, and whether fee
levels reflect any economies of scale for the benefit of the Company’s stockholders. The Board, including the Independent Directors,
had previously concluded the Advisor is appropriately sharing any economies of scale through its fee structure and through reinvestment
in its business resources to provide stockholders additional content and services. The Board further considered that the sub-advisory
fee to RWC under the New Sub-Advisory Agreement will be paid by the Advisor and remains the same as the sub-advisory fee under the Current
Sub-Advisory Agreement, and the Company will not incur any additional expense for RWC’s services. The Board, including the Independent
Directors, concluded that appropriate economies of scale have been taken into account with respect to the sub-advisory fee to RWC.
Experience of Management Team and Personnel.
The Board of Directors considered the extensive experience of RWC with respect to the specific types of investments proposed and
concluded that RWC would provide valuable assistance to the Advisor in providing potential investment opportunities. The individuals currently
responsible for the investment management of that portion of the Company‘s portfolio allocated to Ecofin Advisors Limited under
the Current Sub-Advisory Agreement will be the same individuals responsible for the investment management of that allocated portion under
the New Sub-Advisory Agreement. The Advisor will retain its name and other personnel currently providing services to the Company and will
remain located at 5901 College Boulevard, Suite 400, Overland Park, KS 66211.
Provisions of New Sub-Advisory Agreement.
The Board of Directors considered the extent to which the provisions of the New Sub-Advisory Agreement could potentially expose
the Company to liability and concluded that its terms adequately protected the Company from such risk.
Conclusions of the Independent Directors
As a result of this process, the Independent Directors,
assisted by the advice of independent legal counsel, and taking into account all of the factors discussed above and the information provided
by the Advisor, unanimously concluded that the Sub-Advisory Agreement between the Advisor and RWC is fair and reasonable in light of the
services provided and should be approved.
2024 Annual Report |
November 30, 2024
Additional Information
(unaudited) (continued)
Fund Investment Objectives, Policies and Risks
Changes in the Last Fiscal Year
During each Fund’s most recent fiscal year,
there were no material changes in the Fund’s investment objectives or policies that have not been approved by shareholders or in
the principal risk factors associated with investment in the Fund.
Investment Objectives and Policies
Tortoise Energy Infrastructure Corporation
(TYG)
TYG’s investment objective is to seek a
high level of total return with an emphasis on current distributions paid to stockholders. Under normal circumstances, TYG invests at
least 90% of its total investments, defined as the value of all investments reported as total investments in its schedule of investments,
in securities of energy infrastructure companies. Energy infrastructure companies engage in the business of transporting, processing,
storing, distributing or marketing natural gas, natural gas liquids, coal, crude oil or refined petroleum products, or exploring, developing,
managing or producing such commodities. Additionally energy infrastructure includes renewables and power infrastructure companies that
generate, transport and distribute electricity.
As a regulated investment company, TYG may invest
up to 25% of its total assets in MLPs. TYG may invest up to 30% of its total investments in restricted securities, primarily through direct
placements. Subject to this policy, TYG may invest without limitation in illiquid securities. The types of restricted securities that
TYG may purchase include securities of private energy infrastructure companies and privately issued securities of publicly traded energy
infrastructure companies. Restricted securities, whether issued by public companies or private companies, are generally considered illiquid.
The aggregate of all of TYG’s investments in private companies that do not have any publicly traded shares or units are limited
to 5% of its total investments.
TYG may invest up to 25% of its total investments
in debt securities of energy infrastructure companies, including certain securities rated below investment grade (“junk bonds”).
Below investment grade debt securities will be rated at least B3 by Moody’s and at least B– by S&P at the time of purchase,
or comparably rated by another statistical rating organization or if unrated, determined to be of comparable quality by the Adviser.
TYG will not invest more than 10% of its total
investments in a single issuer or engage in short sales. TYG may write covered call options, up to 10% of its total investments. These
investment restrictions described above apply at the time of purchase, and TYG will not be required to reduce a position due solely to
market value fluctuations.
TYG may change these non-fundamental investment
policies without stockholder approval and will provide notice to stockholders of material changes (including notice through stockholder
reports); provided, however, that a change in the policy of investing at least 90% of TYG’s total investments in energy infrastructure
companies requires at least 60 days’ prior written notice to stockholders.
TYG may write covered call options, up to 10%
of its total investments.
Under adverse market or economic conditions, TYG
may invest up to 100% of its total investments in securities issued or guaranteed by the U.S. Government or its instrumentalities or agencies,
short-term debt securities, certificates of deposit, bankers’ acceptances and other bank obligations, commercial paper rated in
the highest category by a rating agency or other liquid fixed income securities deemed by the Adviser to be consistent with a defensive
posture (collectively, “short-term securities”), or may hold cash. To the extent TYG invests in short-term securities or cash
for defensive purposes, such investments are inconsistent with, and may result in TYG not achieving, its investment objective.
TYG also may invest in short-term securities or
cash pending investment of any offering proceeds to meet working capital needs including, but not limited to, for collateral in connection
with certain investment techniques, to hold a reserve pending payment of distributions, and to facilitate the payment of expenses and
settlement of trades. The yield on such securities may be lower than the returns on energy infrastructure companies or yields on lower
rated fixed income securities.
Leverage. TYG’s policy is to utilize
leverage in an amount that on average represents approximately 25% of its total assets. TYG considers market conditions at the time leverage
is incurred and monitors for asset coverage ratios relative to 1940 Act requirements and financial covenants on an ongoing basis. Leverage
as a percent of total assets will vary depending on market conditions, but will normally range between 20% - 30%.
TYG may use interest rate transactions for hedging
purposes only, in an attempt to reduce the interest rate risk arising from its leveraged capital structure. TYG does not intend to hedge
the interest rate risk of its portfolio holdings. Accordingly, if no leverage is outstanding, TYG currently does not expect to engage
in interest rate transactions. Interest rate transactions that TYG may use for hedging purposes may expose it to certain risks that differ
from the risks associated with its portfolio holdings.
Additional Information
(unaudited) (continued)
Tortoise Midstream Energy Fund, Inc. (“NTG”)
NTG’s investment objective is to provide
stockholders a high level of total return with an emphasis on current distributions paid to stockholders. NTG invests primarily in midstream
energy entities that own and operate a network of pipeline and energy-related logistical infrastructure assets with an emphasis on those
that transport, gather, process and store natural gas and natural gas liquids (NGLs). NTG targets midstream energy entities, including
master limited partnerships (MLPs) benefiting from U.S. natural gas production and global consumption expansion with limited direct commodity
exposure. Under normal circumstances, NTG invests at least 80% of its total investments in equity securities of midstream energy entities
in the energy infrastructure sector, including MLPs, with at least 50% of its total investments in equity securities of natural gas infrastructure
entities.
As a regulated investment company, NTG may invest
up to 25% of its total assets in MLPs. NTG may also invest up to 50% of its total investments in restricted securities, primarily through
direct investments. Restricted securities, whether issued by public companies or private companies, are generally considered illiquid.
The aggregate of all NTG’s investments in private companies that do not have any publicly traded shares or units is limited to 5%
of its total investments.
NTG may invest up to 20% of its total investments
in debt securities of midstream energy companies, including securities rated below investment grade (commonly referred to as “junk
bonds”). Below investment grade debt securities will be rated at least B3 by Moody’s Investors Service, Inc. (“Moody’s”)
and at least B- by Standard & Poor’s Ratings Group (“S&P”) at the time of purchase, or comparably rated by another
statistical rating organization or if unrated, determined to be of comparable quality by the Adviser. NTG currently has no specific maturity
policy with respect to debt securities.
NTG will not invest more than 10% of its total
investments in any single issuer.
NTG may write covered call options, up to 10% of its total investments.
NTG may change its investment objective and other
non-fundamental investment policies without stockholder approval and will provide written notice to stockholders of material changes (including
notice through stockholder reports), although a change in the policy of investing at least 80% of NTG’s total investments in equity
securities of midstream energy entities in the energy infrastructure sector, including MLPs, requires at least 60 days’ prior written
notice to stockholders. Unless otherwise stated, these investment restrictions apply at the time of purchase. Furthermore, NTG is not
required to reduce a position due solely to market value fluctuations.
Although inconsistent with NTG’s investment
objective, under (i) adverse market or economic conditions which results in NTG taking a temporary defensive position or (ii) pending
investment of offering or leverage proceeds, NTG may invest 100% of its total investments in mutual funds, cash, cash equivalents, securities
issued or guaranteed by the U.S. Government or its instrumentalities or agencies, high quality, short-term money market instruments, short-term
debt securities, certificates of deposit, bankers’ acceptances and other bank obligations, commercial paper or other liquid fixed
income securities. The yield on these securities may be lower than the returns on the securities in which NTG will otherwise invest or
yields on lower-rated, fixed income securities. NTG currently does not have a specific maturity policy. To the extent NTG invests in these
securities on a temporary basis or for defensive purposes, NTG may not achieve its investment objectives.
Leverage. NTG’s policy is to utilize
leverage in an amount that on average represents approximately 25% of its total assets. NTG considers market conditions at the time leverage
is incurred and monitors for asset coverage ratios relative to 1940 Act requirements and financial covenants on an ongoing basis. Leverage
as a percent of total assets will vary depending on market conditions, but will normally range between 20% - 30%.
NTG may use interest rate transactions for economic
hedging purposes only, in an attempt to reduce the interest rate risk arising from its leveraged capital structure. NTG does not intend
to hedge the interest rate risk of its portfolio holdings. Interest rate transactions that NTG may use for hedging purposes may expose
it to certain risks that differ from the risks associated with its portfolio holdings.
Tortoise Power and Energy Infrastructure Fund,
Inc. (“TPZ”)
TPZ’s primary investment objective is to
provide a high level of current income, with a secondary objective of capital appreciation. TPZ invests primarily in power and energy
infrastructure companies. TPZ seeks to invest in fixed income and dividend-paying equity securities of power and energy infrastructure
companies that provide stable and defensive characteristics throughout economic cycles.
TPZ’s investment approach emphasizes current
income, low volatility and minimization of downside risk. Under normal circumstances, the fund invests at least 80% of its total assets
(including assets obtained through leverage) in securities of power and energy infrastructure companies. Power infrastructure companies
use asset systems to provide electric power generation (including renewable energy), transmission and distribution. Energy infrastructure
companies use a network of pipeline assets to transport, store, gather and/or process crude oil, refined petroleum products (including
biodiesel and ethanol), natural gas or natural gas liquids.
2024 Annual Report |
November 30, 2024
Additional Information
(unaudited) (continued)
Under normal circumstances, the fund will invest
a minimum of 51% of its total assets in fixed income securities.
The fund will not invest more than 25% of its
total assets in non-investment grade rated fixed income securities or more than 15% of its total assets in restricted securities that
are ineligible for resale under Rule 144A, all of which may be illiquid securities. The fund may invest up to 10% of its total assets
in securities issued by non-U.S. issuers (including Canadian issuers). The fund will not engage in short sales. These investment restrictions
described above apply at the time of purchase, and the fund will not be required to reduce a position due solely to market value fluctuations.
As used for the purpose of each non-fundamental
investment policy above, the term “total assets” includes any assets obtained through leverage. TPZ’s Board of Directors
may change its non-fundamental investment policies without stockholder approval and will provide notice to stockholders of material changes
in such policies (including notice through stockholder reports). Any change in the policy of investing under normal circumstances at least
80% of TPZ’s total assets (including assets obtained through leverage) in the securities of companies that derive more than 50%
of their revenue from power or energy infrastructure operations requires at least 60 days’ prior written notice to stockholders.
Unless otherwise stated, the investment restrictions described above apply at the time of purchase, and TPZ will not be required to reduce
a position due solely to market value fluctuations.
In addition, to comply with federal tax requirements
for qualification as a RIC, TPZ’s investments will be limited so that at the close of each quarter of each taxable year (i) at least
50% of the value of its total assets is represented by cash and cash items, U.S. Government securities, the securities of other RICs and
other securities, with such other securities limited for purposes of such calculation, in respect of any one issuer, to an amount not
greater than 5% of the value of its total assets and not more than 10% outstanding voting securities of such issuer, and (ii) not more
than 25% of the value of TPZ’s total assets is invested in the securities of any one issuer (other than U.S. Government securities
or the securities of other RICs), the securities (other than the securities of other RICs) of any two or more issuers that TPZ controls
and that are determined to be engaged in the same business or similar or related trades or businesses, or the securities of one or more
qualified publicly traded partnerships (which includes MLPs). These tax-related limitations may be changed by the Board of Directors to
the extent appropriate in light of changes to applicable tax requirements.
Although inconsistent with its investment objectives,
under adverse market or economic conditions or pending investment of offering or leverage proceeds, TPZ may invest 100% of its total assets
in cash, cash equivalents, securities issued or guaranteed by the U.S. government or its instrumentalities or agencies, short-term money
market instruments, short-term fixed income securities, certificates of deposit, bankers’ acceptances and other bank obligations,
commercial paper or other liquid fixed income securities. The yield on these securities may be lower than the returns on the securities
in which TPZ will otherwise invest or yields on lower-rated, fixed income securities. To the extent TPZ invests in these securities on
a temporary basis or for defensive purposes, it may not achieve its investment objectives.
Leverage. TPZ’s policy is to utilize
leverage in an amount that on average represents approximately 20% of its total assets. TPZ considers market conditions at the time leverage
is incurred and monitors for asset coverage ratios relative to 1940 Act requirements and financial covenants on an ongoing basis. Leverage
as a percent of total assets will vary depending on market conditions, but will normally range between 15% - 25%.
TPZ may use interest rate transactions, for hedging
purposes only, in an attempt to reduce the interest rate risk arising from its leveraged capital structure. Interest rate transactions
that TPZ may use for hedging purposes may expose it to certain risks that differ from the risks associated with its portfolio holdings.
Tortoise Pipeline & Energy Fund, Inc. (“TTP”)
TTP has an investment objective of providing stockholders
a high level of total return with an emphasis on current distributions. TTP invests primarily in equity securities of pipeline companies
that transport natural gas, natural gas liquids (NGLs), crude oil and refined products and, to a lesser extent, in other energy infrastructure
companies.
TTP’s investment approach emphasizes total
return potential through current income and growth, low volatility and downside risk minimization. Under normal circumstances, TTP invests
at least 80% of its total assets (including assets obtained through leverage) in equity securities of pipeline and other energy infrastructure
companies. More than 75% of these companies will generally be structured as corporations or limited liability companies domiciled in the
U.S. or Canada.
As a regulated investment company,
TTP may invest up to 25% of its total assets in MLPs. TTP may invest up to 30% of its total assets in unregistered or otherwise restricted
securities, primarily through direct investments, and will not invest in private companies. TTP may invest up to 30% of its total assets
in non-U.S. issuers (including Canadian issuers). TTP may invest up to 20% of its total assets in debt securities, including those rated
below investment grade. TTP will not invest more than 10% of its total assets in any single issuer and will not engage in short sales.
These investment restrictions described above apply at the time of purchase, and TTP will not be required to reduce a position due solely
to market value fluctuations.
Additional Information
(unaudited) (continued)
TTP may also write (sell) covered call options
to seek to enhance long-term return potential across economic environments, increase current income and mitigate portfolio risk through
option income. TTP’s covered call strategy focuses on other energy companies that the Adviser believes are integral links in the
value chain for pipeline companies. The fund typically aims to write call options that are approximately 5% - 15% out-of-the-money on
approximately 20% of the portfolio, although it may adjust these targets depending on market volatility and other market conditions.
Leverage. TTP’s policy is to utilize
leverage in an amount that on average represents approximately 25% of its total assets. TTP considers market conditions at the time leverage
is incurred and monitors for asset coverage ratios relative to 1940 Act requirements and financial covenants on an ongoing basis. Leverage
as a percent of total assets will vary depending on market conditions, but will normally range between 20% - 30%.
Tortoise Energy Independence Fund, Inc. (“NDP”)
NDP has an investment objective of providing stockholders
a high level of total return with an emphasis on current distributions. NDP invests primarily in equity securities of upstream North American
energy companies that engage in the exploration and production of crude oil, condensate, natural gas and natural gas liquids that generally
have a significant presence in North American oil and gas fields, including shale reservoirs.
Under normal circumstances, NDP will invest at
least 80% of its total assets in equity securities of North American energy companies, including at least 50% of its total assets in equity
securities of upstream energy companies. “Total assets” are defined as the value of securities, cash or other assets held,
including securities or assets obtained through leverage, and interest accrued but not yet received. NDP will invest in equity securities
that are publicly traded on an exchange or in the over-the-counter (“OTC”) market, primarily consisting of common stock, but
also including, among others, master limited partnerships (“MLPs”) and limited liability company (“LLC”) common
units
NDP may invest up to 35% of its total assets in securities of non-U.S. issuers (including Canadian issuers). An issuer of a security
will generally be considered to be a non-U.S. issuer if it is organized under the laws of, or maintains its principal place of business
in, a country other than the United States.
NDP may invest up to 30% of its total assets in
restricted securities that are ineligible for resale under Rule 144A (“Rule 144A”) under the Securities Act of 1933, as amended
(the “1933 Act”), all of which may be illiquid securities, primarily through direct investments in securities of listed companies,
but will not invest in private companies. NDP will not invest more than 10% of its total assets in a single issuer or engage in short
sales. As a registered investment company (“RIC”), NDP may invest up to 25% of its total assets in securities of MLPs.
NDP may also seek to provide current income from
gains earned through an option strategy. NDP may also write (sell) call options on selected equity securities in its portfolio (“covered
calls”). As a writer of such call options, in effect, during the term of the option, in exchange for the premium NDP receives, it
sells the potential appreciation above the exercise price in the value of the security or securities covered by the options. Therefore,
NDP may forego part of the potential appreciation for part of its equity portfolio in exchange for the call premium received.
Leverage. NDP’s policy is to utilize
leverage in an amount that on average represents approximately 15% of its total assets. NDP considers market conditions at the time leverage
is incurred and monitors for asset coverage ratios relative to 1940 Act requirements and financial covenants on an ongoing basis. Leverage
as a percent of total assets will vary depending on market conditions, but will normally range between 10% - 20%.
Tortoise Sustainable and Social Impact Term
Fund (TEAF)
The Fund’s investment objective is to provide
its common shareholders with a high level of total return with an emphasis on current distributions.
Under normal market conditions, the Fund will
invest at least 80% of its total assets (including assets obtained through leverage) in issuers operating in essential asset sectors.
The Fund considers essential assets to be assets and services that are indispensable to the economy and society. Essential asset sectors
include the education, housing, healthcare, social and human services, power, water, energy, infrastructure, basic materials, industrial,
transportation and telecommunications sectors. The Fund may invest across all levels of an issuer’s capital structure and emphasize
income-generating investments, particularly in social infrastructure, sustainable infrastructure and energy infrastructure.
The Fund has adopted the following additional
non-fundamental investment policies:
| • | | Under normal conditions, the Fund may invest up to 40% of its total assets in directly originated
loans; |
| • | | Under normal conditions, the Fund may invest up to 25% of its total assets in direct placements
in restricted equity securities in listed companies; |
| • | | Under normal conditions, the Fund may invest up to 25% of its total assets in direct equity
investments in unlisted companies; |
2024 Annual Report | November 30, 2024
Additional Information
(unaudited) (continued)
| • | | Under normal conditions, the Fund may invest up to 30% of its total assets in securities
of non-U.S. issuers, including Canadian issuers. An issuer of a security generally will be considered to be a non-U.S. issuer if it is
organized under the laws of, or maintains its principal place of business in, a country other than the United States; |
| • | | As a RIC, the Fund may invest up to 25% of its total assets in securities of entities treated
as qualified publicly traded partnerships for federal income tax purposes, which generally includes MLPs; |
| • | | the Fund will not engage in short sales of securities; |
| • | | Under normal conditions, the Fund may invest up to 10% of its total assets in securities
of emerging market issuers; and |
| • | | Under normal conditions, the Fund may invest up to 10% of its total assets in non-directly
originated corporate debt securities that are, at the time of purchase, rated CCC+ or lower by S&P and Fitch and Caa1 or lower by
Moody’s. |
| • | | Under adverse market or economic conditions, the Fund may invest up to 100% of its total
assets in money market mutual funds, cash, cash equivalents, securities issued or guaranteed by the U.S. government or its instrumentalities
or agencies, high quality, short-term money market instruments, short-term debt securities, certificates of deposit, bankers’ acceptances
and other bank obligations, commercial paper or other liquid debt securities. |
Leverage. Leverage as a percent of total
assets will vary depending on market conditions, but will normally range between 10% - 15%.
Principal Risk Factors
Each fund’s NAV, ability to make distributions,
ability to service debt securities and preferred stock, and ability to meet asset coverage requirements depends on the performance of
its investment portfolio. The performance of each fund’s investment portfolio is subject to a number of risks. For each of TYG,
NTG, TPZ, TTP and NDP, there is a cybersecurity risk as follows:
Cybersecurity Risk. Investment advisers, including the Adviser,
must rely in part on digital and network technologies (collectively “cyber networks”) to conduct their businesses. Such cyber
networks might in some circumstances be at risk of cyberattacks that could potentially seek unauthorized access to digital systems for
purposes such as misappropriating sensitive information, corrupting data, or causing operational disruption. Cyberattacks might potentially
be carried out by persons using techniques that could range from efforts to electronically circumvent network security or overwhelm websites
to intelligence gathering and social engineering functions aimed at obtaining information necessary to gain access. Nevertheless, cyber
incidents could potentially occur, and might in some circumstances result in unauthorized access to sensitive information about the Adviser
or its clients.
For each of the funds there is an epidemic risk
as follows:
Epidemic Risk. Widespread disease, including
pandemics and epidemics have been and can be highly disruptive to economies and markets, adversely impacting individual companies, sectors,
industries, markets, currencies, interest and inflation rates, credit ratings, investor sentiment, and other factors affecting the value
of the Fund’s investments. Given the increasing interdependence among global economies and markets, conditions in one country, market,
or region are increasingly likely to adversely affect markets, issuers, and/or foreign exchange rates in other countries, including the
U.S. These disruptions could prevent the Fund from executing advantageous investment decisions in a timely manner and negatively impact
its ability to achieve its investment objectives. Any such event(s) could have a significant adverse impact on the value and risk profile
of the Fund.
The remaining risks are set out separately for
each fund below.
Tortoise Energy Infrastructure Corporation
Capital Markets Volatility Risk. Our capital
structure and performance may be adversely impacted by weakness in the credit markets and stock market if such weakness results in declines
in the value of energy infrastructure entities in which we invest. If the value of our investments decline or remain volatile, there is
a risk that we may be required to reduce outstanding leverage, which could adversely affect our stock price and ability to pay distributions
at historical levels. A sustained economic slowdown may adversely affect the ability of energy infrastructure entities to sustain their
historical distribution levels, which in turn, may adversely affect our ability to sustain distributions at historical levels. Energy
infrastructure entities that have historically relied heavily on outside capital to fund their growth may be impacted by a slowdown in
the capital markets. The performance of the energy infrastructure sector is dependent on several factors including the condition of the
financial sector, the general economy and the commodity markets.
Concentration Risk. Under normal circumstances,
we concentrate our investments in the energy infrastructure sector. The primary risks inherent in investments in entities in the energy
infrastructure sector include the following: (1) the performance and level of distributions of energy infrastructure entities can be affected
by direct and indirect commodity price exposure, (2) a decrease in market demand for natural gas or other energy commodities could adversely
affect energy infrastructure entities’ revenues or cash flows, (3) energy infrastructure assets deplete over time and must be replaced
and (4) a rising interest rate environment could increase the cost of capital for energy infrastructure entities.
Additional Information
(unaudited) (continued)
Industry Specific Risk. Energy infrastructure
companies also are subject to risks specific to the industry they serve.
MLP Risks. An investment in MLP securities
involves some risks that differ from the risks involved in an investment in the common stock of a corporation, including governance risk,
tax risk, and cash flow risk. Governance risk involves the risks associated with the ownership structure of MLPs. MLPs are also subject
to tax risk, which is the risk that MLPs might lose their partnership status for tax purposes. Cash flow risk is the risk that MLPs will
not make distributions to holders (including us) at anticipated levels or that such distributions will not have the expected tax character.
As a result, there could be a material reduction in our cash flow and there could be a material decrease in the value of our common shares.
Equity Securities Risk. Equity securities,
including MLP common units, can be affected by macro-economic and other factors affecting the stock market in general, expectations of
interest rates, investor sentiment toward the energy infrastructure sector, changes in a particular issuer’s financial condition,
or unfavorable or unanticipated poor performance of a particular issuer (in the case of MLPs, generally measured in terms of DCF). Prices
of common units of individual MLPs and other equity securities also can be affected by fundamentals unique to the partnership or company,
including size, earnings power, coverage ratios and characteristics and features of different classes of securities.
Smaller Company Securities Risk. Investing
in securities of smaller companies may involve greater risk than is associated with investing in more established companies. Companies
with smaller capitalization may have limited product lines, markets or financial resources; may lack management depth or experience; and
may be more vulnerable to adverse general market or economic developments than larger more established companies.
Debt Securities Risk: Investments in debt
securities are generally subject to credit risk, extension risk, interest rate risk, prepayment risk and spread risk.
Below Investment Grade Securities Risk. Investing
in below investment grade debt instruments (commonly referred to as “junk bonds”) involves additional risks than investment
grade securities. Adverse changes in economic conditions are more likely to lead to a weakened capacity of a below investment grade issuer
to make principal payments and interest payments than an investment grade issuer. An economic downturn could adversely affect the ability
of highly leveraged issuers to service their obligations or to repay their obligations upon maturity. Similarly, downturns in profitability
in the energy infrastructure industry could adversely affect the ability of below investment grade issuers in that industry to meet their
obligations. The market values of lower quality securities tend to reflect individual developments of the issuer to a greater extent than
do higher quality securities, which react primarily to fluctuations in the general level of interest rates.
The secondary market for below investment grade
securities may not be as liquid as the secondary market for more highly rated securities. There are fewer dealers in the market for below
investment grade securities than investment grade obligations. The prices quoted by different dealers may vary significantly, and the
spread between the bid and asked price is generally much larger than for higher quality instruments. Under adverse market or economic
conditions, the secondary market for below investment grade securities could contract further, independent of any specific adverse change
in the condition of a particular issuer, and these instruments may become illiquid. As a result, it may be more difficult to sell these
securities or we may be able to sell the securities only at prices lower than if such securities were widely traded. This may affect adversely
our ability to make required distribution or interest payments on our outstanding senior securities. Prices realized upon the sale of
such lower-rated or unrated securities, under these circumstances, may be less than the prices used in calculating our NAV.
Capital Markets Risk. Global financial
markets and economic conditions have been, and may continue to be, volatile due to a variety of factors, including significant write-offs
in the financial services sector. Despite more stabilized economic activity, if the volatility continues, the cost of raising capital
in the debt and equity capital markets, and the ability to raise capital, may be impacted. In particular, concerns about the general stability
of financial markets and specifically the solvency of lending counterparties, may impact the cost of raising capital from the credit markets
through increased interest rates, tighter lending standards, difficulties in refinancing debt on existing terms or at all and reduced,
or in some cases ceasing to provide, funding to borrowers. In addition, lending counterparties under existing revolving credit facilities
and other debt instruments may be unwilling or unable to meet their funding obligations. As a result of any of the foregoing, we or the
companies in which we invest may be unable to obtain new debt or equity financing on acceptable terms. If funding is not available when
needed, or is available only on unfavorable terms, we or the companies in which we invest may not be able to meet obligations as they
come due. Moreover, without adequate funding, midstream energy entities may be unable to execute their growth strategies, complete future
acquisitions, take advantage of other business opportunities or respond to competitive pressures, any of which could have a material adverse
effect on their revenues and results of operations.
Restricted Security Risk. We may invest
up to 30% of total assets in restricted securities, primarily through direct placements. Restricted securities are less liquid than securities
traded in the open market because of statutory and contractual restrictions on resale. Such securities are, therefore, unlike securities
that are traded in the open market, which can be expected to be sold immediately if the market is adequate. This lack of liquidity creates
special risks for us.
Liquidity Risk. Certain energy infrastructure
securities may trade less frequently than those of other companies due to their smaller capitalizations. Investments in securities that
are less actively traded or over time experience decreased trading volume may be difficult to dispose of when we believe it is desirable
to do so, may restrict our ability to take advantage of other opportunities, and may be more difficult to value.
2024 Annual Report | November 30, 2024
Additional Information
(unaudited) (continued)
Tax Risk. We have elected to be treated,
and intend to qualify each year, as a “regulated investment company” (“RIC”) under the Code. To maintain our qualification
for federal income tax purposes as a RIC under the Code, we must meet certain source-of-income, asset diversification and annual distribution
requirements, as discussed in detail below under “Certain U.S. Federal Income Tax Considerations.” If for any taxable year
we fail to qualify for the special federal income tax treatment afforded to RICs, all of our taxable income will be subject to federal
income tax at regular corporate rates (without any deduction for distributions to our stockholders) and our income available for distribution
will be reduced.
Non-Diversification Risk. We are registered
as a non-diversified, closed-end management investment company under the 1940 Act. Accordingly, there are no regulatory limits under the
1940 Act on the number or size of securities that we hold, and we may invest more assets in fewer issuers compared to a diversified fund.
However, in order to qualify as a RIC for federal income tax purposes, we must meet certain requirements.
Covered Call Risk. We cannot guarantee
that our covered call option strategy will be effective. There are several risks associated with transactions in options on securities.
The significant differences between the securities and options markets could result in an imperfect correlation between these markets.
The use of options may require us to sell portfolio securities at inopportune times or for prices other than current market values, may
limit the amount of appreciation we can realize on an investment, or may cause us to hold a security we might otherwise sell. There can
be no assurance that a liquid market will exist when we seek to close out an option position. Factors such as supply and demand, interest
rates, the current market price of the underlying security in relation to the exercise price of the option, the dividend or distribution
yield of the underlying security, the actual or perceived volatility of the underlying security and the time remaining until the expiration
date, could impact or cause to vary over time the amount of income we are able to generate through our covered call option strategy. The
number of covered call options we can write is limited by the number of shares of the corresponding common stock we hold. Furthermore,
our covered call option transactions may be subject to limitations established by each of the exchanges, boards of trade or other trading
facilities on which such options are traded. If we fail to maintain any required asset coverage ratios in connection with any use by us
of leverage, we may be required to redeem or prepay some or all of our leverage instruments. Such redemption or prepayment would likely
result in our seeking to terminate early all or a portion of any option transaction. Early termination of an option could result in a
termination payment by or to us.
Hedging Strategy Risk. We may use interest
rate transactions for hedging purposes only, in an attempt to reduce the interest rate risk arising from our leveraged capital structure.
There is no assurance that the interest rate hedging transactions into which we enter will be effective in reducing our exposure to interest
rate risk. Hedging transactions are subject to correlation risk, which is the risk that payment on our hedging transactions may not correlate
exactly with our payment obligations on senior securities. Interest rate transactions that we may use for hedging purposes, such as swaps,
caps and floors, will expose us to certain risks that differ from the risks associated with our portfolio holdings.
Delay in Use of Proceeds Risk. Although
we expect to fully invest the net proceeds of any offering within three months after the closing of the offering, such investments may
be delayed if suitable investments are unavailable at the time, if we are unable to secure firm commitments for direct investments, if
market conditions and volumes of the securities of midstream energy entities are not favorable at the time or for other reasons.
Valuation Risk. We may invest up to 30%
of total assets in restricted securities, which are subject to restrictions on resale. The value of such investments ordinarily will be
based on fair valuations determined by the Adviser pursuant to procedures adopted by the Board of Directors. Restrictions on resale or
the absence of a liquid secondary market may affect adversely our ability to determine NAV. The sale price of securities that are restricted
or otherwise are not readily marketable may be higher or lower than our most recent valuations.
Competition Risk. At the time we completed
our initial public offering in February 2004, we were the only publicly traded investment company offering access to a portfolio of energy
infrastructure MLPs. Since that time, a number of alternative vehicles for investment in a portfolio of energy infrastructure MLPs, including
other publicly traded investment companies and private funds, have emerged. These competitive conditions may adversely impact our ability
to meet our investment objective, which in turn could adversely impact our ability to make interest or distribution payments.
Management Risk. The Adviser was formed
in October 2002 to provide portfolio management services to institutional and high net worth investors seeking professional management
of their MLP investments. The Adviser has been managing our portfolio since we began operations in February 2004. To the extent that the
Adviser’s assets under management grow, the Adviser may have to hire additional personnel and, to the extent it is unable to hire
qualified individuals, its operations may be adversely affected.
Subsidiary Risks. By investing in any Subsidiary,
we will be indirectly exposed to the risks associated with such Subsidiary’s investments. The instruments that will be held by any
Subsidiary will generally be similar to those that are permitted to be held by the Company and will be subject to the same risks that
apply to similar investments if held directly by the Company. The Subsidiaries will not be registered under the 1940 Act, and, unless
otherwise noted, will not be subject to all of the protections of the 1940 Act. However, we will wholly own and control any Subsidiary,
and we and any Subsidiary will each be managed by our Adviser and will share the same portfolio management team. Our Board of Directors
will have oversight responsibility for the investment activities of the Company, including its investment in the Subsidiaries, and our
role as sole shareholder of any Subsidiary. Changes in the laws of the United States and/or any jurisdiction in which a Subsidiary if
formed could result in our inability or the inability of the Subsidiaries to operate as expected and could adversely affect the Company.
Additional
Information (unaudited) (continued)
Additional Risks to Common Stockholders
Leverage Risk. We are currently leveraged
and intend to continue to use leverage primarily for investment purposes. Leverage, which is a speculative technique, could cause us to
lose money and can magnify the effect of any losses. Weakness in the credit markets may cause our leverage costs to increase and there
is a risk that we may not be able to renew or replace existing leverage on favorable terms or at all. If the cost of leverage is no longer
favorable, or if we are otherwise required to reduce our leverage, we may not be able to maintain common stock distributions at historical
levels and common stockholders will bear any costs associated with selling portfolio securities. If our net asset value of our portfolio
declines or remains subject to heightened market volatility, there is an increased risk that we will be unable to maintain coverage ratios
for debt securities and preferred stock mandated by the 1940 Act, rating agency guidelines or contractual terms of bank lending facilities
or privately placed notes. If we do not cure any deficiencies within specified cure periods, we will be required to redeem such senior
securities in amounts that are sufficient to restore the required coverage ratios or, in some cases, offer to redeem all of such securities.
As a result, we may be required to sell portfolio securities at inopportune times, and we may incur significant losses upon the sale of
such securities. There is no assurance that a leveraging strategy will be successful.
Market Impact Risk. The sale of our common
stock (or the perception that such sales may occur) may have an adverse effect on prices in the secondary market for our common stock.
An increase in the number of common shares available may put downward pressure on the market price for our common stock.
Dilution Risk. The voting power of current
stockholders will be diluted to the extent that such stockholders do not purchase shares in any future common stock offerings or do not
purchase sufficient shares to maintain their percentage interest.
If we are unable to invest the proceeds of such
offering as intended, our per share distribution may decrease and we may not participate in market advances to the same extent as if such
proceeds were fully invested as planned.
Market Discount Risk. Our common stock
has traded both at a premium and at a discount in relation to NAV. We cannot predict whether our shares will trade in the future at a
premium or discount to NAV.
Additional Risks to Senior Security Holders
Additional risks of investing in senior securities,
include the following:
Interest Rate Risk. Distributions and interest
payable on our senior securities are subject to interest rate risk. To the extent that distributions or interest on such securities are
based on short-term rates, our leverage costs may rise so that the amount of distributions or interest due to holders of senior securities
would exceed the cash flow generated by our portfolio securities. To the extent that our leverage costs are fixed, our leverage costs
may increase when our senior securities mature. This might require that we sell portfolio securities at a time when we would otherwise
not do so, which may adversely affect our future ability to generate cash flow. In addition, rising market interest rates could negatively
impact the value of our investment portfolio, reducing the amount of assets serving as asset coverage for senior securities.
Senior Leverage Risk. Our preferred stock
will be junior in liquidation and with respect to distribution rights to our debt securities and any other borrowings. Senior securities
representing indebtedness may constitute a substantial lien and burden on preferred stock by reason of their prior claim against our income
and against our net assets in liquidation. We may not be permitted to declare distributions with respect to any series of our preferred
stock unless at such time we meet applicable asset coverage requirements and the payment of principal or interest is not in default with
respect to debt securities or any other borrowings.
Our debt securities, upon issuance, are expected
to be unsecured obligations and, upon our liquidation, dissolution or winding up, will rank: (1) senior to all of our outstanding common
stock and any outstanding preferred stock; (2) on a parity with any of our unsecured creditors and any unsecured senior securities representing
our indebtedness; and (3) junior to any of our secured creditors. Secured creditors of ours may include, without limitation, parties entering
into interest rate swap, floor or cap transactions, or other similar transactions with us that create liens, pledges, charges, security
interests, security agreements or other encumbrances on our assets.
Ratings and Asset Coverage Risk. To the
extent that senior securities are rated, a rating does not eliminate or necessarily mitigate the risks of investing in our senior securities,
and a rating may not fully or accurately reflect all of the credit and market risks associated with that senior security. A rating agency
could downgrade the rating of our shares of preferred stock or debt securities, which may make such securities less liquid in the secondary
market, though probably with higher resulting interest rates. If a rating agency downgrades, or indicates a potential downgrade to, the
rating assigned to a senior security, we may alter our portfolio or redeem a portion of our senior securities. We may voluntarily redeem
a senior security under certain circumstances to the extent permitted by its governing documents.
Inflation Risk. Inflation is the reduction
in the purchasing power of money resulting from an increase in the price of goods and services. Inflation risk is the risk that the inflation
adjusted or “real” value of an investment in preferred stock or debt securities or the income from that investment will be
worth less in the future. As inflation occurs, the real value of the preferred stock or debt securities and the distributions or interest
payable to holders of preferred stock or debt securities declines.
Decline in Net Asset Value Risk. A material
decline in our NAV may impair our ability to maintain required levels of asset coverage for our preferred stock or debt securities.
2024 Annual Report | November 30, 2024
Additional Information
(unaudited) (continued)
Tortoise Midstream Energy Fund, Inc.
We are designed primarily as a long-term investment
vehicle, and our securities are not an appropriate investment for a short-term trading strategy. An investment in our securities should
not constitute a complete investment program for any investor. Due to the uncertainty in all investments, there can be no assurance that
we will achieve our investment objective. Investing in our securities involves risk, including the risk that you may receive little or
no return on your investment. Before investing in our securities, you should consider carefully the summary risks set forth below.
Capital Markets Volatility Risk. Our capital
structure and performance may be adversely impacted by weakness in the credit markets and stock market if such weakness results in declines
in the value of midstream energy entities in which we invest. If the value of our investments decline or remain volatile, there is a risk
that we may be required to reduce outstanding leverage, which could adversely affect our stock price and ability to pay distributions
at historical levels. A sustained economic slowdown may adversely affect the ability of midstream energy entities to sustain their historical
distribution levels, which in turn, may adversely affect our ability to sustain distributions at historical levels. Midstream energy entities
that have historically relied heavily on outside capital to fund their growth may be impacted by a slowdown in the capital markets. The
performance of the midstream energy sector is dependent on several factors including the condition of the financial sector, the general
economy and the commodity markets.
Concentration Risk. Under normal circumstances,
we will concentrate our investments in the energy infrastructure sector, and will invest in a portfolio consisting primarily of midstream
energy entities in the energy infrastructure sector, with an emphasis on natural gas infrastructure entities. Risks inherent in the business
of these types of entities include (1) the volume of natural gas or other energy commodities available for transporting, processing, storing
or distributing, (2) energy commodity prices, (3) demand for natural gas, crude oil, and refined petroleum products, (4) climate change
regulation, (5) depletion of natural gas reserves and other commodities, (6) changes in the regulatory environment, (7) extreme weather
patterns, (8) a rising interest rate environment, (9) the threat of terrorism and related military activity and (10) face operating risks,
including the risk of fire, explosions, blow-outs, pipe failure, abnormally pressured formations and environmental hazards.
Industry
Specific Risk. Energy infrastructure companies also are subject to risks specific to the industry they serve.
MLP Risks. An investment in MLP securities
involves some risks that differ from the risks involved in an investment in the common stock of a corporation, including governance risk,
tax risk, and cash flow risk. Governance risk involves the risks associated with the ownership structure of MLPs. MLPs are also subject
to tax risk, which is the risk that MLPs might lose their partnership status for tax purposes. Cash flow risk is the risk that MLPs will
not make distributions to holders (including us) at anticipated levels or that such distributions will not have the expected tax character.
As a result, there could be a material reduction in our cash flow and there could be a material decrease in the value of our common shares.
Equity Securities Risk. Equity securities,
including MLP common units, can be affected by macro-economic and other factors affecting the stock market in general, expectations of
interest rates, investor sentiment towards the midstream energy sector, changes in a particular issuer’s financial condition, or
unfavorable or unanticipated poor performance of a particular issuer (in the case of MLPs, generally measured in terms of distributable
cash flow). Prices of equity securities also can be affected by fundamentals unique to the entity, including size, earnings power, coverage
ratio and characteristics and features of different classes of securities.
Smaller Company Securities Risk. Investing
in securities of smaller companies may involve greater risk than is associated with investing in more established companies. Companies
with smaller capitalization may have limited product lines, markets or financial resources; may lack management depth or experience; and
may be more vulnerable to adverse general market or economic developments than larger more established companies.
Debt Securities Risk: Investments in debt
securities are generally subject to credit risk, extension risk, interest rate risk, prepayment risk and spread risk.
Below Investment Grade Securities Risk. Investing
in below investment grade debt instruments (commonly referred to as “junk bonds”) involves additional risks than investment
grade securities. Adverse changes in economic conditions are more likely to lead to a weakened capacity of a below investment grade issuer
to make principal payments and interest payments than an investment grade issuer. An economic downturn could adversely affect the ability
of highly leveraged issuers to service their obligations or to repay their obligations upon maturity. Similarly, downturns in profitability
in the energy infrastructure industry could adversely affect the ability of below investment grade issuers in that industry to meet their
obligations. The market values of lower quality securities tend to reflect individual developments of the issuer to a greater extent than
do higher quality securities, which react primarily to fluctuations in the general level of interest rates.
The secondary market for below investment grade
securities may not be as liquid as the secondary market for more highly rated securities. There are fewer dealers in the market for below
investment grade securities than investment grade obligations. The prices quoted by different dealers may vary significantly, and the
spread between the bid and asked price is generally much larger than for higher quality instruments. Under adverse market or economic
conditions, the secondary market for below investment grade securities could contract further, independent
Additional Information
(unaudited) (continued)
of any specific adverse change in the condition
of a particular issuer, and these instruments may become illiquid. As a result, it may be more difficult to sell these securities or we
may be able to sell the securities only at prices lower than if such securities were widely traded. This may affect adversely our ability
to make required distribution or interest payments on our outstanding senior securities. Prices realized upon the sale of such lower-rated
or unrated securities, under these circumstances, may be less than the prices used in calculating our NAV.
Capital Markets Risk. Global financial
markets and economic conditions have been, and may continue to be, volatile due to a variety of factors, including significant write-offs
in the financial services sector. Despite more stabilized economic activity, if the volatility continues, the cost of raising capital
in the debt and equity capital markets, and the ability to raise capital, may be impacted. In particular, concerns about the general stability
of financial markets and specifically the solvency of lending counterparties, may impact the cost of raising capital from the credit markets
through increased interest rates, tighter lending standards, difficulties in refinancing debt on existing terms or at all and reduced,
or in some cases ceasing to provide, funding to borrowers. In addition, lending counterparties under existing revolving credit facilities
and other debt instruments may be unwilling or unable to meet their funding obligations. As a result of any of the foregoing, we or the
companies in which we invest may be unable to obtain new debt or equity financing on acceptable terms. If funding is not available when
needed, or is available only on unfavorable terms, we or the companies in which we invest may not be able to meet obligations as they
come due. Moreover, without adequate funding, midstream energy entities may be unable to execute their growth strategies, complete future
acquisitions, take advantage of other business opportunities or respond to competitive pressures, any of which could have a material adverse
effect on their revenues and results of operations.
Restricted Securities Risk. We may invest
up to 50% of Total Assets in restricted securities, primarily through direct placements. Restricted securities are less liquid than securities
traded in the open market because of statutory and contractual restrictions on resale. Such securities are, therefore, unlike securities
that are traded in the open market, which can be expected to be sold immediately if the market is adequate.
Liquidity Risk. Although equity securities
of midstream energy entities trade on the NYSE, NYSE MKT LLC (formerly known as AMEX), and the NASDAQ National Market, certain midstream
energy securities may trade less frequently than those of larger companies due to their smaller capitalizations. In the event certain
midstream energy securities experience limited trading volumes, the prices of such securities may display abrupt or erratic movements
at times. In addition, it may be more difficult for us to buy and sell significant amounts of such securities without an unfavorable impact
on prevailing market prices.
Tax Risk. We have elected to be treated,
and intend to qualify each year, as a “regulated investment company” (“RIC”) under the Code. To maintain our qualification
for federal income tax purposes as a RIC under the Code, we must meet certain source-of-income, asset diversification and annual distribution
requirements, as discussed in detail below under “Certain U.S. Federal Income Tax Considerations.” If for any taxable year
we fail to qualify for the special federal income tax treatment afforded to RICs, all of our taxable income will be subject to federal
income tax at regular corporate rates (without any deduction for distributions to our stockholders) and our income available for distribution
will be reduced.
Non-Diversification Risk. We are registered
as a non-diversified, closed-end management investment company under the 1940 Act. Accordingly, there are no regulatory limits under the
1940 Act on the number or size of securities that we hold, and we may invest more assets in fewer issuers compared to a diversified fund.
However, in order to qualify as a RIC for federal income tax purposes, we must meet certain requirements.
Covered Call Risk. We cannot guarantee
that our covered call option strategy will be effective. There are several risks associated with transactions in options on securities.
The significant differences between the securities and options markets could result in an imperfect correlation between these markets.
The use of options may require us to sell portfolio securities at inopportune times or for prices other than current market values, may
limit the amount of appreciation we can realize on an investment, or may cause us to hold a security we might otherwise sell. There can
be no assurance that a liquid market will exist when we seek to close out an option position. Factors such as supply and demand, interest
rates, the current market price of the underlying security in relation to the exercise price of the option, the dividend or distribution
yield of the underlying security, the actual or perceived volatility of the underlying security and the time remaining until the expiration
date, could impact or cause to vary over time the amount of income we are able to generate through our covered call option strategy. The
number of covered call options we can write is limited by the number of shares of the corresponding common stock we hold. Furthermore,
our covered call option transactions may be subject to limitations established by each of the exchanges, boards of trade or other trading
facilities on which such options are traded. If we fail to maintain any required asset coverage ratios in connection with any use by us
of leverage, we may be required to redeem or prepay some or all of our leverage instruments. Such redemption or prepayment would likely
result in our seeking to terminate early all or a portion of any option transaction. Early termination of an option could result in a
termination payment by or to us.
Hedging Strategy Risk. We may use interest
rate transactions for hedging purposes only, in an attempt to reduce the interest rate risk arising from our leveraged capital structure.
There is no assurance that the interest rate hedging transactions into which we enter will be effective in reducing our exposure to interest
rate risk. Hedging transactions are subject to correlation risk, which is the risk that payment on our hedging transactions may not correlate
exactly with our payment obligations on senior securities.
2024 Annual Report | November
30, 2024
Additional Information
(unaudited) (continued)
Delay in Use of Proceeds Risk.
Although we expect to fully invest the net proceeds of any offering within three months after the closing of the offering, such investments
may be delayed if suitable investments are unavailable at the time, if we are unable to secure firm commitments for direct investments,
if market conditions and volumes of the securities of midstream energy entities are not favorable at the time or for other reasons.
Valuation Risk. We may invest
up to 50% of total assets in restricted securities, which are subject to restrictions on resale. The value of such investments ordinarily
will be based on fair valuations determined by the Adviser pursuant to procedures adopted by the Board of Directors. Restrictions on resale
or the absence of a liquid secondary market may affect adversely our ability to determine NAV. The sale price of securities that are restricted
or otherwise are not readily marketable may be higher or lower than our most recent valuations.
Competition Risk. A number
of alternatives exist for investing in a portfolio of energy infrastructure entities, including other publicly traded investment companies,
structured notes, private funds, open-end funds and indexed products. These competitive conditions may adversely impact our ability to
meet our investment objective, which in turn could adversely impact our ability to make distributions or interest or distribution payments.
Management Risk. The Adviser
was formed in October 2002 to provide portfolio management services to institutional and high net worth investors seeking professional
management of their MLP investments. The Adviser has been managing our portfolio since we began operations in July 2010. To the extent
that the Adviser’s assets under management grow, the Adviser may have to hire additional personnel and, to the extent it is unable
to hire qualified individuals, its operations may be adversely affected.
Subsidiary Risks. By investing
in any Subsidiary, we will be indirectly exposed to the risks associated with such Subsidiary’s investments. The instruments that
will be held by any Subsidiary will generally be similar to those that are permitted to be held by the Company and will be subject to
the same risks that apply to similar investments if held directly by the Company. The Subsidiaries will not be registered under the 1940
Act, and, unless otherwise noted, will not be subject to all of the protections of the 1940 Act. However, we will wholly own and control
any Subsidiary, and we and any Subsidiary will each be managed by our Adviser and will share the same portfolio management team. Our Board
of Directors will have oversight responsibility for the investment activities of the Company, including its investment in the Subsidiaries,
and our role as sole shareholder of any Subsidiary. Changes in the laws of the United States and/or any jurisdiction in which a Subsidiary
if formed could result in our inability or the inability of the Subsidiaries to operate as expected and could adversely affect the Company.
Leverage Risk. Our use of
leverage through the issuance of preferred stock or debt securities, and any borrowings (other than for temporary or emergency purposes)
would be considered “senior securities” for purposes of the 1940 Act and create risks. Leverage is a speculative technique
that may adversely affect common stockholders. If the return on securities acquired with borrowed funds or other leverage proceeds does
not exceed the cost of the leverage, the use of leverage could cause us to lose money. Successful use of leverage depends on our Adviser’s
ability to predict or hedge correctly interest rates and market movements, and there is no assurance that the use of a leveraging strategy
will be successful during any period in which it is used. Because the fee paid to our Adviser will be calculated on the basis of Managed
Assets, the fees will increase when leverage is utilized, giving our Adviser an incentive to utilize leverage.
Market Impact Risk. The sale
of our common stock (or the perception that such sales may occur) may have an adverse effect on prices in the secondary market for our
common stock. An increase in the number of common shares available may put downward pressure on the market price for our common stock.
Dilution Risk. The voting
power of current stockholders will be diluted to the extent that such stockholders do not purchase shares in any future common stock offerings
or do not purchase sufficient shares to maintain their percentage interest.
If we are unable to invest the proceeds
of such offering as intended, our per share distribution may decrease and we may not participate in market advances to the same extent
as if such proceeds were fully invested as planned.
Market Discount Risk. Our
common stock has traded both at a premium and at a discount in relation to NAV. We cannot predict whether our shares will trade in the
future at a premium or discount to NAV.
Additional Risks to Senior
Securities Holders
Interest Rate Risk. Distributions
and interest payable on our senior securities are subject to interest rate risk. To the extent that distributions or interest on such
securities are based on short-term rates, our leverage costs may rise so that the amount of distributions or interest due to holders of
senior securities would exceed the cash flow generated by our portfolio securities. To the extent that our leverage costs are fixed, our
leverage costs may increase when our senior securities mature. This might require that we sell portfolio securities at a time when we
would otherwise not do so, which may adversely affect our future ability to generate cash flow. In addition, rising market interest rates
could negatively impact the value of our investment portfolio, reducing the amount of assets serving as asset coverage for senior securities.
Senior Leverage Risk. Preferred
stock would be junior in liquidation and with respect to distribution rights to debt securities and any other borrowings. Senior securities
representing indebtedness may constitute a substantial lien and burden on any preferred stock by reason of their prior claim against our
income and against our net assets in liquidation. We may not be permitted to declare distributions with respect to any series of preferred
stock unless at such time we meet applicable asset coverage requirements and the payment of principal or interest is not in default with
respect to the Notes or any other borrowings.
Additional Information
(unaudited) (continued)
Ratings and Asset Coverage Risk.
To the extent that senior securities are rated, a rating does not eliminate or necessarily mitigate the risks of investing in our
senior securities, and a rating may not fully or accurately reflect all of the credit and market risks associated with a security. A rating
agency could downgrade the rating of our shares of preferred stock or debt securities, which may make such securities less liquid in the
secondary market, though probably with higher resulting interest rates. If a rating agency downgrades, or indicates a potential downgrade
to, the rating assigned to a senior security, we may alter our portfolio or redeem some senior securities. We may voluntarily redeem a
senior security under certain circumstances to the extent permitted by its governing documents.
Inflation Risk. Inflation
is the reduction in the purchasing power of money resulting from an increase in the price of goods and services. Inflation risk is the
risk that the inflation adjusted or “real” value of an investment in preferred stock or debt securities or the income from
that investment will be worth less in the future. As inflation occurs, the real value of the preferred stock or debt securities and the
distributions payable to holders of preferred stock or interest payable to holders of debt securities declines.
Decline in Net Asset Value Risk.
A material decline in our NAV may impair our ability to maintain required levels of asset coverage for our preferred stock or debt
securities.
Tortoise Power and Energy Infrastructure
Fund, Inc.
General Business Risk. We
are a Maryland corporation registered as a non-diversified, closed-end management investment company under the 1940 Act. We are subject
to all of the business risks and uncertainties associated with any business, including the risk that we will not achieve our investment
objectives and that the value of an investment in our securities could decline substantially and cause you to lose some or all of your
investment.
General Securities Risk. We
invest in securities that may be subject to certain risks, including: (1) issuer risk, (2) credit risk, (3) interest rate risk, (4) reinvestment
risk, (5) call or prepayment risk, (6) valuation risk, and (7) duration and maturity risk.
Capital Markets Risk. Global
financial markets and economic conditions have been, and continue to be, volatile due to a variety of factors, including significant write-offs
in the financial services sector. The third and fourth quarters of 2009 and the first and second quarters of 2010 witnessed more stabilized
economic activity as expectations for an economic recovery increased. However, if the volatility continues, the cost of raising capital
in the fixed income and equity capital markets and the ability to raise capital may be impacted. In particular, concerns about the general
stability of financial markets and specifically the solvency of lending counterparties, may impact the cost of raising capital from the
credit markets through increased interest rates, tighter lending standards, difficulties in refinancing debt on existing terms or at all
and reduced, or in some cases ceasing to provide, funding to borrowers. In addition, lending counterparties under existing revolving credit
facilities and other fixed income instruments may be unwilling or unable to meet their funding obligations. In addition, measures taken
by the U.S. Government to stimulate the U.S. economy may not be successful or may not have the intended effect. As a result of any of
the foregoing, companies may be unable to obtain new fixed income or equity financing on acceptable terms. If funding is not available
when needed, or is available only on unfavorable terms, companies may not be able to meet their obligations as they come due. Moreover,
without adequate funding, companies may be unable to execute their maintenance and growth strategies, complete future acquisitions, take
advantage of other business opportunities or respond to competitive pressures, any of which could have a material adverse effect on their
revenues and results of operations.
Investment Grade Fixed Income
Securities Risk. We may invest a portion of our assets in fixed income securities rated “investment grade” by nationally
recognized statistical rating organizations (“NRSROs”) or judged by our Adviser to be of comparable credit quality. Although
we do not intend to do so, we may invest up to 100% in such securities. Investment grade fixed income securities are rated Baa3 or higher
by Moody’s Investors Service (“Moody’s”), BBB- or higher by Standard & Poor’s Ratings Services (“S&P”),
or BBB- or higher by Fitch, Inc. (“Fitch”). Investment grade fixed income securities generally pay yields above those of otherwise-comparable
U.S. government securities because they are subject to greater risks than U.S. government securities, and yields that are below those
of non-investment grade fixed income securities, commonly referred to as “junk bonds,” because they are considered to be subject
to fewer risks than non-investment grade fixed income securities. Despite being considered to be subject to fewer risks than junk bonds,
investment grade fixed income securities are, in fact, subject to risks, including volatility, credit risk and risk of default, sensitivity
to general economic or industry conditions, potential lack of resale opportunities (illiquidity), and additional expenses to seek recovery
from issuers who default.
MLP Risks. An investment in
MLP securities involves some risks that differ from the risks involved in an investment in the common stock of a corporation, including
governance risk, tax risk, and cash flow risk. Governance risk involves the risks associated with the ownership structure of MLPs. MLPs
are also subject to tax risk, which is the risk that MLPs might lose their partnership status for tax purposes. Cash flow risk is the
risk that MLPs will not make distributions to holders (including us) at anticipated levels or that such distributions will not have the
expected tax character. As a result, there could be a material reduction in our cash flow and there could be a material decrease in the
value of our common shares.
Restricted Securities Risk. We
will not invest more than 15% of our total assets in restricted securities that are ineligible for resale under Rule 144A, all of which
may be illiquid securities. Restricted securities (including Rule 144A securities) are less liquid than freely tradable securities because
of statutory and contractual restrictions on resale. Such securities are, therefore, unlike freely tradable securities, which can be expected
to be sold immediately if the market is adequate. This lack of liquidity creates special risks for us.
2024 Annual
Report | November 30, 2024
Additional Information
(unaudited) (continued)
Rule 144A Securities Risk. The
Fund may purchase Rule 144A securities. Rule 144A provides an exemption from the registration requirements of the 1933 Act for the resale
of certain restricted securities to qualified institutional buyers, such as the Fund. Securities saleable among qualified institutional
buyers pursuant to Rule 144A will not be counted towards the 15% limitation on restricted securities.
An insufficient number of qualified
institutional buyers interested in purchasing Rule 144A-eligible securities held by us, however, could affect adversely the marketability
of certain Rule 144A securities, and we might be unable to dispose of such securities promptly or at reasonable prices. To the extent
that liquid Rule 144A securities that the Fund holds become illiquid, due to the lack of sufficient qualified institutional buyers or
market or other conditions, the percentage of the Fund’s assets invested in illiquid assets would increase and the fair value of
such investments may become not readily determinable. In addition, if for any reason we are required to liquidate all or a portion of
our portfolio quickly, we may realize significantly less than the fair value at which we previously recorded these investments.
Tax Risk. We have elected
to be treated, and intend to qualify each year, as a “regulated investment company” (“RIC”) under the Code. To
maintain our qualification for federal income tax purposes as a RIC under the Code, we must meet certain source-of-income, asset diversification
and annual distribution requirements, as discussed in detail below under “Certain U.S. Federal Income Tax Considerations.”
If for any taxable year we fail to qualify for the special federal income tax treatment afforded to RICs, all of our taxable income will
be subject to federal income tax at regular corporate rates (without any deduction for distributions to our stockholders) and our income
available for distribution will be reduced.
Equity Securities Risk. Equity
securities of entities that operate in the power and energy infrastructure sectors can be affected by macroeconomic and other factors
affecting the stock market in general, expectations about changes in interest rates, investor sentiment towards such entities, changes
in a particular issuer’s financial condition, or unfavorable or unanticipated poor performance of a particular issuer (in the case
of MLPs, generally measured in terms of distributions). Prices of equity securities of individual entities also can be affected by fundamentals
unique to the company or partnership, including earnings power and coverage ratios.
Non-investment Grade Fixed Income
Securities Risk. We will not invest more than 25% of our total assets in fixed income securities rated non-investment grade by NRSROs
or unrated securities of comparable quality. Non-investment grade securities are rated Ba1 or lower by Moody’s, BB+ or lower by
S&P or BB or lower by Fitch or, if unrated are determined by our Adviser to be of comparable credit quality. Non-investment grade
securities, also sometimes referred to as “junk bonds,” generally pay a premium above the yields of U.S. government securities
or fixed income securities of investment grade issuers because they are subject to greater risks than these securities. These risks, which
reflect their speculative character, include the following: greater volatility; greater credit risk and risk of default; potentially greater
sensitivity to general economic or industry conditions; potential lack of attractive resale opportunities (illiquidity); and additional
expenses to seek recovery from issuers who default.
Non-U.S. Securities Risk. We
may invest up to 10% of our total assets in securities issued by non-U.S. issuers (including Canadian issuers) and that otherwise meet
our investment objectives. This may include investments in the securities of non-U.S. issuers that involve risks not ordinarily associated
with investments in securities and instruments of U.S. issuers, including different accounting, auditing and financial standards, less
government supervision and regulation, additional tax withholding and taxes, difficulty enforcing rights in foreign countries, less publicly
available information, difficulty effecting transactions, higher expenses, and exchange rate risk.
Valuation Risk. The fair value
of certain of our investments may not be readily determinable. The fair value of these securities will be determined pursuant to methodologies
established by our Board of Directors. While the fair value of securities we acquire through direct placements generally will be based
on a discount from quoted market prices, other factors may adversely affect our ability to determine the fair value of such a security.
Our determination of fair value may differ materially from the values that would have been used if a ready market for these securities
had existed.
Leverage Risk. Our use of
leverage through borrowings or the issuance of preferred stock or fixed income securities, and any other transactions involving indebtedness
(other than for temporary or emergency purposes) would be considered “senior securities” for purposes of the 1940 Act. Under
normal circumstances, we will not employ leverage above 20% of our total assets at time of incurrence. Leverage is a speculative technique
that may adversely affect common stockholders. If the return on securities acquired with borrowed funds or other leverage proceeds does
not exceed the cost of the leverage, the use of leverage could cause us to lose money. There is no assurance that a leveraging strategy
will be successful.
Hedging Strategy Risk. We
may use interest rate swap transactions, for hedging purposes only, in an attempt to reduce the interest rate risk arising from our leveraged
capital structure. Interest rate swap transactions that we may use for hedging purposes will expose us to certain risks that differ from
the risks associated with our portfolio holdings. The use of hedging transactions might result in reduced overall performance, whether
or not adjusted for risk, than if we had not engaged in such transactions.
Additional
Information (unaudited) (continued)
Liquidity Risk. Certain securities
may trade less frequently than those of larger companies that have larger market capitalizations. Investments in securities that are less
actively traded or over time experience decreased trading volume may be difficult to dispose of when we believe it is desirable to do
so, may restrict our ability to take advantage of other opportunities, and may be more difficult to value.
Non-Diversification Risk. We
are registered as a non-diversified, closed-end management investment company under the 1940 Act. Accordingly, there are no regulatory
limits under the 1940 Act on the number or size of securities that we hold, and we may invest more assets in fewer issuers compared to
a diversified fund. However, in order to qualify as a RIC for federal income tax purposes, we must meet certain requirements.
Competition Risk. There are
a number of alternatives to us as vehicles for investment in a portfolio of companies operating primarily in the power and energy infrastructure
sectors, including publicly traded investment companies, structured notes, private funds, open-end funds and indexed products. In addition,
recent tax law changes have increased the ability of RICs or other institutions to invest in MLPs. These competitive conditions may adversely
impact our ability to meet our investment objectives, which in turn could adversely impact our ability to make interest or distribution
payments on any securities we may issue.
Performance Risk. We may not
be able to achieve operating results that will allow us to make distributions at a specific level or to increase the amount of these distributions
from time to time. In addition, the 1940 Act and restrictions and provisions in credit facilities and fixed income securities may limit
our ability to make distributions. For federal income tax purposes, we are required to distribute substantially all of our net investment
income each year both to reduce our federal income tax liability and to avoid a potential excise tax. If our ability to make distributions
on our common shares is limited, such limitations could, under certain circumstances, impair our ability to maintain our qualification
for taxation as a RIC, which would have adverse consequences for our stockholders.
Legal and Regulatory Change Risks.
The regulatory environment for closed-end companies is evolving, and changes in the regulation of closed-end companies may adversely
affect the value of our investments, our ability to obtain the leverage that we might otherwise obtain, or to pursue our trading strategy.
In addition, the securities markets are subject to comprehensive statutes and regulations. The Securities and Exchange Commission (“SEC”),
other regulators and self-regulatory organizations and exchanges are authorized to take extraordinary actions in the event of market emergencies.
The effect of any future regulatory change on us could be substantial and adverse.
Management Risk. Our Adviser
was formed in October 2002 to provide portfolio management services to institutional and high-net worth investors seeking professional
management of their MLP investments. Our Adviser has been managing our portfolio since we began operations in July 2009. To the extent
that the Adviser’s assets under management grow, the Adviser may have to hire additional personnel and, to the extent it is unable
to hire qualified individuals, its operations may be adversely affected.
Concentration Risk. The Fund’s
strategy of concentrating in power and energy infrastructure investments means that the performance of the Fund will be closely tied to
the performance of these particular market sectors. The Fund’s concentrations in these investments may present more risk than if
it were broadly diversified over numerous industries and sectors of the economy. A downturn in these investments would have a greater
impact on the Fund than on a fund that does not concentrate in such investments. At times, the performance of these investments may lag
the performance of other industries or the market as a whole.
Risks Related to Investing
in the Power and Energy Infrastructure Sectors
Under normal circumstances, we plan
to invest at least 80% of our total assets (including assets we obtain through leverage) in the securities of companies that derive more
than 50% of their revenue from power or energy infrastructure operations. Our focus on the power and energy infrastructure sectors may
present more risks than if it were broadly diversified over numerous sectors of the economy. Therefore, a downturn in the power and energy
infrastructure sectors would have a larger impact on us than on an investment company that does not concentrate in these sectors. Specific
risks of investing in the power and energy infrastructure sectors include the following: (1) interest rate risk, (2) credit rating downgrade
risk, (3) terrorism and natural disasters risk, (4) climate change regulation risk, (5) operating risk (6) power infrastructure company
risk, and (7) energy infrastructure company risk.
Power Infrastructure Company Risk.
Companies operating in the power infrastructure sector also are subject to additional risks, including: (1) regulatory risk, (2) Federal
Energy Regulatory Commission risk, (3) environmental risk and (4) competition risk. To the extent that any of these risks materialize
for a company whose securities are in our portfolio, the value of these securities could decline and our net asset value and share price
could be adversely affected.
Energy Infrastructure Company
Risk. Companies operating in the energy infrastructure sector also are subject to additional risks, including: (1) pipeline company
risk, (2) gathering and processing company risk, (3) propane company risk, (4) supply and demand risk, (5) price volatility risk, (6)
competition risk, and (7) regulatory risk. To the extent that any of these risks materialize for a company whose securities are in our
portfolio, the value of these securities could decline and our net asset value and share price would be adversely affected.
2024 Annual Report | November
30, 2024
Additional
Information(unaudited) (continued)
Additional Risks to Common
Stockholders
Market Impact Risk. The sale
of our common stock (or the perception that such sales may occur) may have an adverse effect on prices in the secondary market for our
common stock by increasing the number of shares available, which may put downward pressure on the market price for our common stock. Our
ability to sell shares of common stock below NAV may increase this pressure. These sales also might make it more difficult for us to sell
additional equity securities in the future at a time and price we deem appropriate.
Dilution Risk. The voting
power of current stockholders will be diluted to the extent that such stockholders do not purchase shares in any future common stock offerings
or do not purchase sufficient shares to maintain their percentage interest. In addition, if we sell shares of common stock below NAV,
our NAV will fall immediately after such issuance.
If we are unable to invest the proceeds
of such offering as intended, our per share distribution may decrease and we may not participate in market advances to the same extent
as if such proceeds were fully invested as planned.
Market Discount Risk. Our
common stock has traded both at a premium and at a discount in relation to NAV. We cannot predict whether our shares will trade in the
future at a premium or discount to NAV.
Additional Risks to Senior
Security Holders
Additional risks of investing in
preferred stock or debt securities issued by us include the following:
Interest Rate Risk. Distributions
and interest payable on our senior securities are subject to interest rate risk. To the extent that distributions on such securities are
based on short-term rates, our leverage costs may rise so that the amount of distributions or interest due to holders of senior securities
would exceed the cash flow generated by our portfolio securities. To the extent that our leverage costs are fixed, our leverage costs
may increase when our senior securities mature. This might require that we sell portfolio securities at a time when we would otherwise
not do so, which may adversely affect our future ability to generate cash flow. In addition, rising market interest rates could negatively
impact the value of our investment portfolio, reducing the amount of assets serving as asset coverage for senior securities.
Senior Leverage Risk. Our
preferred stock will be junior in liquidation and with respect to distribution rights to our debt securities and any other borrowings.
Senior securities representing indebtedness may constitute a substantial lien and burden on preferred stock by reason of their prior claim
against our income and against our net assets in liquidation. We may not be permitted to declare distributions with respect to any series
of our preferred stock unless at such time we meet applicable asset coverage requirements and the payment of principal or interest is
not in default with respect to senior debt securities or any other borrowings.
Our debt securities, upon issuance,
are expected to be unsecured obligations and, upon our liquidation, dissolution or winding up, will rank: (1) senior to all of our outstanding
common stock and any outstanding preferred stock; (2) on a parity with any of our unsecured creditors and any unsecured senior securities
representing our indebtedness; and (3) junior to any of our secured creditors. Secured creditors of ours may include, without limitation,
parties entering into interest rate swap, floor or cap transactions, or other similar transactions with us that create liens, pledges,
charges, security interests, security agreements or other encumbrances on our assets.
Ratings and Asset Coverage Risk.
To the extent that senior securities are rated, a rating does not eliminate or necessarily mitigate the risks of investing in our
senior securities, and a rating may not fully or accurately reflect all of the credit and market risks associated with that senior security.
A rating agency could downgrade the rating of our shares of preferred stock or debt securities, which may make such securities less liquid
in the secondary market, though probably with higher resulting interest rates. If a rating agency downgrades, or indicates a potential
downgrade to, the rating assigned to a senior security, we may alter our portfolio or redeem a portion of our senior securities. We may
voluntarily redeem a senior security under certain circumstances to the extent permitted by its governing documents.
Inflation Risk. Inflation
is the reduction in the purchasing power of money resulting from an increase in the price of goods and services. Inflation risk is the
risk that the inflation adjusted or “real” value of an investment in preferred stock or debt securities or the income from
that investment will be worth less in the future. As inflation occurs, the real value of the preferred stock or debt securities and the
distributions or interest payable to holders of preferred stock or debt securities declines.
Decline in Net Asset Value Risk.
A material decline in our NAV may impair our ability to maintain required levels of asset coverage for our preferred stock or debt
securities.
Additional
Information (unaudited) (continued)
Tortoise Pipeline & Energy
Fund, Inc.
The following are the general risks
of investing in our securities that affect our ability to achieve our investment objective. The risks below could lower the returns and
distributions on common stock and reduce the amount of cash and net assets available to make distribution payments on preferred stock
and interest payments on debt securities.
Capital Markets Volatility Risk.
Our capital structure and performance may be adversely impacted by weakness in the credit markets and stock market if such weakness
results in declines in the value of companies in which we invest. If the value of our investments decline or remain volatile, there is
a risk that we may be required to reduce outstanding leverage, which could adversely affect our stock price and ability to pay distributions
at historical levels. A sustained economic slowdown may adversely affect the ability of the companies in which we invest to obtain new
debt or equity financing on acceptable terms. If funding is not available when needed, or is available only on unfavorable terms, we or
the companies in which we invest may not be able to meet obligations as they come due. Moreover, without adequate funding, energy infrastructure
companies may be unable to execute their growth strategies, complete future acquisitions, take advantage of other business opportunities
or respond to competitive pressures, any of which could have a material adverse effect on their revenues and results of operations.
Rising interest
rates could limit the capital appreciation of equity units of energy infrastructure companies as a result of the increased availability
of alternative investments at competitive yields. Rising interest rates may increase the cost of capital for companies operating in this
sector. A higher cost of capital or an inflationary period may lead to inadequate funding, which could limit growth from acquisition
or expansion projects, the ability of such entities to make or grow dividends or distributions or meet debt obligations, the ability
to respond to competitive pressures, all of which could adversely affect the prices of their securities.
Concentration Risk. Our strategy
of concentrating in energy infrastructure investments means that our performance will be closely tied to the performance of the energy
infrastructure sector, which includes midstream, upstream and downstream energy industries. Our concentration in these investments may
present more risk than if we were broadly diversified over numerous industries and sectors of the economy. A downturn in these investments
would have a greater impact on us than on a fund that does not concentrate in such investments. At times, the performance of these investments
may lag the performance of other industries or the market as a whole. Risks inherent in the business of energy infrastructure companies
include:
| • | Supply and Demand Risk. A decrease in the production
of natural gas, NGLs, crude oil, coal, refined petroleum products or other energy commodities, or a decrease in the volume of such commodities
available for transporting, storing, gathering, processing, distributing, exploring, developing, managing or producing may adversely
impact the financial performance and profitability of energy infrastructure companies. Production declines and volume decreases could
be caused by various factors, including depletion of resources, declines in estimates of proved reserves, labor difficulties, political
events, OPEC actions, changes in commodity prices, declines in production from existing facilities, environmental proceedings, increased
regulations, equipment failures and unexpected maintenance problems, failure to obtain necessary permits, unscheduled outages, unanticipated
expenses, inability to successfully carry out new construction or acquisitions, import supply disruption, increased competition from
alternative energy sources or related commodity prices and other events. Alternatively, a sustained decline in or varying demand for
such commodities could also adversely affect the financial performance of energy infrastructure companies. Factors that could lead to
a decline in demand include economic recession or other adverse economic conditions, higher fuel taxes or governmental regulations, increases
in fuel economy, consumer shifts to the use of alternative fuel sources, changes in commodity prices or weather. |
| | |
| • | Operating Risk. energy infrastructure companies are
subject to many operating risks, including: equipment failure causing outages; structural, maintenance, impairment and safety problems;
transmission or transportation constraints, inoperability or inefficiencies; dependence on a specified fuel source, including the transportation
of fuel; changes in electricity and fuel usage; availability of competitively priced alternative energy sources; changes in generation
efficiency and market heat rates; lack of sufficient capital to maintain facilities; significant capital expenditures to keep older assets
operating efficiently; seasonality; changes in supply and demand for energy commodities; catastrophic and/or weather- related events
such as fires, explosions, floods, earthquakes, hurricanes and similar occurrences; storage, handling, disposal and decommissioning costs;
and environmental compliance. Breakdown or failure of a pipeline or other energy infrastructure company’s assets may prevent the
company from performing under applicable sales agreements, which in certain situations, could result in termination of the agreement
or incurring a liability for liquidated damages. A company’s ability to successfully and timely complete capital improvements to
existing or other capital projects is contingent upon many variables. Should any such efforts be unsuccessful, a pipeline or other energy
infrastructure company could be subject to additional costs and / or the write-off of its investment in the project or improvement. As
a result of the above risks and other potential hazards associated with energy infrastructure companies, certain companies may become
exposed to significant liabilities for which they may not have adequate insurance coverage. Any of the aforementioned risks or related
regulatory and environmental risks could have a material adverse effect on the business, financial condition, results of operations and
cash flows of energy infrastructure companies. |
2024 Annual Report | November
30, 2024
Additional
Information (unaudited) (continued)
| • | Regulatory Risk. Energy infrastructure issuers are
subject to regulation by various governmental authorities in various jurisdictions and may be adversely affected by the imposition of
special tariffs and changes in tax laws, regulatory policies and accounting standards. Regulation exists in multiple aspects of their
operations, including how facilities are constructed, maintained and operated, environmental and safety controls, and the prices they
may charge for the products and services they provide. Various governmental authorities have the power to enforce compliance with these
regulations and the permits issued under them, and violators are subject to administrative, civil and criminal penalties, including fines,
injunctions or both. Stricter laws, regulations or enforcement policies could be enacted in the future which may increase compliance
costs and may adversely affect the financial performance of energy infrastructure companies. Pipeline companies engaged in interstate
pipeline transportation of natural gas, refined petroleum products and other products are subject to regulation by the Federal Energy
Regulatory Commission (“FERC”) with respect to tariff rates these companies may charge for pipeline transportation services.
An adverse determination by the FERC with respect to the tariff rates of a pipeline or other energy infrastructure company could have
a material adverse effect on its business, financial condition, results of operations and cash flows and its ability to make cash distributions
to its equity owners. Prices for certain electric power companies are regulated in the U.S. with the intention of protecting the public
while ensuring that the rate of return earned by such companies is sufficient to attract growth capital and to provide appropriate services
but do not provide any assurance as to achievement of earnings levels. We could become subject to the FERC’s jurisdiction if we
are deemed to be a holding company of a public utility company or of a holding company of a public utility company, and we may be required
to aggregate securities held by us or other funds and accounts managed by the Adviser and its affiliates, or be prohibited from buying
certain securities or be forced to divest certain securities. |
| | |
| • | Environmental Risk. Energy infrastructure company
activities are subject to stringent environmental laws and regulation by many federal, state and local authorities, international treaties
and foreign governmental authorities. Failure to comply with such laws and regulations or to obtain any necessary environmental permits
pursuant to such laws and regulations could result in fines or other sanctions. Congress and other domestic and foreign governmental
authorities have either considered or implemented various laws and regulations to restrict or tax certain emissions, particularly those
involving air and water emissions. Existing environmental regulations could be revised or reinterpreted, new laws and regulations could
be adopted or become applicable, and future changes in environmental laws and regulations could occur, which could impose additional
costs on the operation of power plants. Energy infrastructure companies have made and will likely continue to make significant capital
and other expenditures to comply with these and other environmental laws and regulations. Changes in, or new, environmental restrictions
may force energy infrastructure companies to incur significant expenses or expenses that may exceed their estimates. There can be no
assurance that such companies would be able to recover all or any increased environmental costs from their customers or that their business,
financial condition or results of operations would not be materially and adversely affected by such expenditures or any changes in domestic
or foreign environmental laws and regulations, in which case the value of these companies’ securities in our portfolio could be
adversely affected. In addition, a pipeline or other energy infrastructure company may be responsible for any on-site liabilities associated
with the environmental condition of facilities that it has acquired, leased or developed, regardless of when the liabilities arose and
whether they are known or unknown. |
| | |
| • | Price Volatility Risk. The volatility of energy commodity
prices can affect certain energy infrastructure companies due to the impact of prices on the volume of commodities transported, stored,
gathered, processed, distributed, developed or produced. Most pipeline companies are not subject to direct commodity price exposure because
they do not own the underlying energy commodity. Nonetheless, the price of a pipeline company security can be adversely affected by the
perception that the performance of all such entities is directly tied to commodity prices. However, the operations, cash flows and financial
performance of other energy infrastructure companies in which we will invest may be more directly affected by energy commodity prices,
especially those energy companies owning the underlying energy commodity. Commodity prices fluctuate for several reasons, including changes
in global and domestic market and economic conditions, the impact of weather on demand, levels of domestic production and imported commodities,
energy conservation, domestic and foreign governmental regulation, political instability, conservation efforts, and taxation and the
availability of local, intrastate and interstate transportation systems. Volatility of commodity prices may also make it more difficult
for energy companies to raise capital to the extent the market perceives that their performance may be directly or indirectly tied to
commodity prices. Historically, energy commodity prices have been cyclical and exhibited significant volatility which may adversely impact
other energy infrastructure companies in which we invest. |
| | |
| • | Terrorism Risk. Energy infrastructure companies, and
the market for their securities, are subject to disruption as a result of terrorist activities, such as the terrorist attacks on the
World Trade Center on September 11, 2001; war, such as the wars in Afghanistan and Iraq and their aftermaths; and other geopolitical
events, including upheaval in the Middle East or other energy producing regions. The U.S. government has issued warnings that energy
assets, specifically those related to energy infrastructure, production facilities, and transmission and distribution facilities, might
be specific targets of terrorist activity. Such events have led, and in the future may lead, to short-term market volatility and may
have long-term effects on companies in the energy infrastructure industry and markets. Such events may also adversely affect our business
and financial condition. |
Additional
Information (unaudited) (continued)
| • | Natural Disaster Risk. Natural risks, such as earthquakes,
flood, lightning, hurricanes and wind, are inherent risks in infrastructure company operations. For example, extreme weather patterns,
such as Hurricane Ivan in 2004 and Hurricanes Katrina and Rita in 2005, the Tohuku earthquake and resulting tsunami in Japan in 2011,
Hurricane Sandy in 2012 and Hurricane Harvey in 2017, or the threat thereof, could result in substantial damage to the facilities of
certain companies located in the affected areas and significant volatility in the supply of energy and could adversely impact the prices
of the securities in which we invest. This volatility may create fluctuations in commodity prices and earnings of energy infrastructure
companies. |
| | |
| • | Climate Change Regulation Risk. Climate change regulation
could result in increased operations and capital costs for the companies in which we invest. Voluntary initiatives and mandatory controls
have been adopted or are being discussed both in the United States and worldwide to reduce emissions of “greenhouse gases”
such as carbon dioxide, a by-product of burning fossil fuels, which some scientists and policymakers believe contribute to global climate
change. These measures and future measures could result in increased costs to certain companies in which we invest to operate and maintain
facilities and administer and manage a greenhouse gas emissions program and may reduce demand for fuels that generate greenhouse gases
and that are managed or produced by companies in which we invest. |
Industry Specific Risk. Energy
infrastructure companies are subject to specific risks, including:
| • | Renewable and power infrastructure companies are subject
to many risks, including earnings variability based upon weather patterns in the locations where the company operates, the change in
the demand for electricity, the cost to produce power, and the regulatory environment. Further, share prices are partly based on the
interest rate environment, the sustainability and potential growth of the dividend, and the outcome of various rate cases undertaken
by the company or a regulatory body. |
| | |
| • | Pipeline companies are subject to varying demand for crude
oil, natural gas, NGLs or refined products in the markets served by the pipeline; changes in the availability of products for transporting,
gathering, processing or sale due to natural declines in reserves and production in the supply areas serviced by the company’s
facilities; sharp decreases in crude oil or natural gas prices that cause producers to curtail production or reduce capital spending
for exploration activities; and environmental regulation. Specifically, demand for gasoline, which accounts for a substantial portion
of refined product transportation, depends on price, prevailing economic conditions in the markets served, and demographic and seasonal
factors. |
| | |
| • | Processing companies are subject to declines in production
of natural gas fields, which utilize the processing facilities as a way to market the gas, prolonged depression in the price of natural
gas, which curtails production due to lack of drilling activity and declines in the prices of NGL products and natural gas prices, resulting
in lower processing margins. |
| | |
| • | Integrated energy companies are impacted by declines in the
demand for and prices of natural gas, crude oil and refined petroleum products. Reductions in prices for natural gas and crude oil can
cause a given reservoir to become uneconomic for continued production earlier than it would if prices were higher. The operating margins
and cash flows of integrated energy companies may fluctuate widely in response to a variety of factors, including global and domestic
economic conditions, weather conditions, natural disasters, the supply and price of imported energy commodities, change in the level
and relationship in crude oil and refined petroleum product pricing, political instability, conservation efforts and governmental regulation.
The accuracy of any reserve estimate is a function of the quality of available data, the accuracy of assumptions regarding future commodity
prices and costs, and engineering and geological interpretations and judgments. Due to natural declines in reserves and production, exploitation
and production companies must economically find or acquire and develop additional reserves in order to maintain and grow their revenues
and distributions. Integrated energy companies are also subject to risks related to operations (such as fires and explosions) as well
as the potential environmental and regulatory risks of such events, which may adversely impact their business and financial condition. |
| | |
| • | Renewable and power infrastructure companies are subject
to many risks, including earnings variability based upon weather patterns in the locations where the company operates, the change in
the demand for electricity, the cost to produce power, and the regulatory environment. Furthermore, share prices are partly
based on the interest rate environment, the sustainability and potential growth of the dividend, and the outcome of various rate cases
undertaken by the company or a regulatory body. |
MLP Risks. An investment in
MLP securities involves some risks that differ from the risks involved in an investment in the common stock of a corporation, including
governance risk, tax risk, and cash flow risk. Governance risk involves the risks associated with the ownership structure of MLPs. MLPs
are also subject to tax risk, which is the risk that MLPs might lose their partnership status for tax purposes. Cash flow risk is the
risk that MLPs will not make distributions to holders (including us) at anticipated levels or that such distributions will not have the
expected tax character. As a result, there could be a material reduction in our cash flow and there could be a material decrease in the
value of our common shares.
2024 Annual Report | November
30, 2024
Additional
Information (unaudited) (continued)
Equity Securities Risk. Equity
securities can be affected by macroeconomic and other factors affecting the stock market in general, expectations about changes in interest
rates, investor sentiment toward such entities, changes in a particular issuer’s financial condition, or unfavorable or unanticipated
poor performance of a particular issuer. Prices of equity securities of individual entities also can be affected by fundamentals unique
to the company or partnership, including size, earnings power, coverage ratio and characteristics and features of different classes of
securities. Equity securities are susceptible to general stock market fluctuations and to volatile increases and decreases in value. The
equity securities we hold may experience sudden, unpredictable drops in value or long periods of decline in value. In addition, by writing
covered call options, capital appreciation potential will be limited on a portion of our investment portfolio.
Foreign Securities Risk. Investments
in securities (including ADRs) of foreign issuers involve risks not ordinarily associated with investments in securities and instruments
of U.S. issuers. For example, foreign companies are not generally subject to uniform accounting, auditing and financial standards and
requirements comparable to those applicable to U.S. companies. Foreign securities exchanges, brokers and companies may be subject to less
government supervision and regulation than exists in the U.S. Dividend and interest income may be subject to withholding and other foreign
taxes, which may adversely affect the net return on such investments. The Fund may not be able to pass through to its shareholders any
foreign income tax credits as a result of any foreign income taxes it pays. There may be difficulty in obtaining or enforcing a court
judgment abroad. In addition, it may be difficult to effect repatriation of capital invested in certain countries. With respect to certain
countries, there are risks of expropriation, confiscatory taxation, political or social instability or diplomatic developments that could
affect the Fund’s assets held in foreign countries. Furthermore, foreign companies operate and serve customers in many parts of
the world, and encounter a variety of political and legal risks unique to those jurisdictions. Local economic conditions may vary and
may have a meaningful influence on the outcome of business activities. Some of these risks are impacted by regional inflation, economic
cycles, currency volatility, sovereign debt markets, local economic environments, and regional trade patterns. There may be less publicly
available information about a foreign company than there is regarding a U.S. company, and many foreign companies are not subject to accounting,
auditing, and financial reporting standards, regulatory framework and practices comparable to those in the U.S. Foreign securities markets
may have substantially less volume than U.S. securities markets and some foreign company securities are less liquid than securities of
otherwise comparable U.S. companies. Foreign markets also have different clearance and settlement procedures that could cause the Fund
to encounter difficulties in purchasing and selling securities on such markets and may result in the Fund missing attractive investment
opportunities or experiencing a loss. In addition, a portfolio that includes securities issued by foreign issuers can expect to have a
higher expense ratio because of the increased transaction costs in foreign markets and the increased costs of maintaining the custody
of such foreign securities. When investing in securities issued by foreign issuers, there is also the risk that the value of such an investment
or the Fund’s income, measured in U.S. dollars, will decrease because of unfavorable changes in currency exchange rates.
Liquidity Risk. We may invest
in securities of any market capitalization and may be exposed to liquidity risk when trading volume, lack of a market maker, or legal
restrictions impair our ability to sell particular securities or close call option positions at an advantageous price or a timely manner.
We may invest in mid-cap and small-cap companies, which may not have the management experience, financial resources, product diversification
and competitive strengths of large-cap companies. Analysts and other investors may follow these companies less actively and therefore
information about these companies may not be as readily available as that for large-cap companies. Therefore, their securities may be
more volatile and less liquid than the securities of larger, more established companies. In the event certain securities experience limited
trading volumes, the prices of such securities may display abrupt or erratic movements at times. In addition, it may be more difficult
for us to buy and sell significant amounts of such securities without an unfavorable impact on prevailing market prices. As a result,
these securities may be difficult to sell at a favorable price at the times when we believe it is desirable to do so. Investment of our
capital in securities that are less actively traded (or over time experience decreased trading volume) may restrict our ability to take
advantage of other market opportunities or to sell those securities. This also may affect adversely our ability to make required interest
payments on our debt securities and distributions on any of our preferred stock, to redeem such securities, or to meet asset coverage
requirements.
Non-Diversification Risk. We
are registered as a non-diversified, closed-end management investment company under the 1940 Act. Accordingly, there are no regulatory
limits under the 1940 Act on the number or size of securities that we hold, and we may invest more assets in fewer issuers compared to
a diversified fund. However, in order to qualify as a RIC for federal income tax purposes, we must meet certain requirements.
Performance and Distribution Risk.
We may not be able to achieve operating results that will allow us to make distributions at a specific level or to increase the amount
of these distributions from time to time. We cannot assure you that you will receive distributions at a particular level or at all. Dividends
and distributions on equity securities are not fixed but are declared at the discretion of the issuer’s board of directors. If stock
market volatility declines, the level of premiums from writing covered call options will likely decrease as well. Payments to close-out
written call options will reduce amounts available for distribution from gains earned in respect of call option expiration or close out.
The equity securities in which we invest may not appreciate or may decline in value. Net realized and unrealized gains on the securities
investments will be determined primarily by the direction and movement of the applicable securities markets and our holdings. Any gains
that we do realize on the disposition of any securities may not be sufficient to offset losses on other securities or option transactions.
A significant decline in the value of the securities in which we invest may negatively impact our ability to pay distributions or cause
you to lose all or a part of your investment.
Additional
Information (unaudited) (continued)
In addition, the 1940 Act may limit
our ability to make distributions in certain circumstances. Restrictions and provisions in any future credit facilities and our debt securities
may also limit our ability to make distributions. For federal income tax purposes, we are required to distribute substantially all of
our net investment income each year both to reduce our federal income tax liability and to avoid a potential excise tax. If our ability
to make distributions on our common shares is limited, such limitations could, under certain circumstances, impair our ability to maintain
our qualification for taxation as a RIC, which would have adverse consequences for our stockholders.
Quarterly Results Risk. We
could experience fluctuations in our operating results due to a number of factors, including the return on our investments, the level
of our expenses, variations in and the timing of the recognition of realized and unrealized gains or losses on our investments and written
call options, the level of call premium we receive by writing covered calls, the degree to which we encounter competition in our markets
and general economic conditions. As a result of these factors, results for any period should not be relied upon as being indicative of
performance in future periods.
Restricted Securities Risk. We
may invest up to 30% of our total assets in unregistered or otherwise restricted securities, primarily through direct investments in securities
of listed companies. Restricted securities (including Rule 144A securities) are less liquid than securities traded in the open market
because of statutory and contractual restrictions on resale. Such securities are, therefore, unlike securities that are traded in the
open market, which can be expected to be sold immediately if the market is adequate. This lack of liquidity may create special risks for
us. However, we could sell such securities in private transactions with a limited number of purchasers or in public offerings under the
1933 Act.
Restricted securities are subject
to statutory and contractual restrictions on their public resale, which may make it more difficult to value them, may limit our ability
to dispose of them and may lower the amount we could realize upon their sale. To enable us to sell our holdings of a restricted security
not registered under the 1933 Act, we may have to cause those securities to be registered. The expenses of registering restricted securities
may be determined at the time we buy the securities. When we must arrange registration because we wish to sell the security, a considerable
period may elapse between the time the decision is made to sell the security and the time the security is registered so that we could
sell it. We would bear the risks of any downward price fluctuation during that period.
Portfolio Turnover Risk. We
may, but under normal market conditions do not intend to, engage in frequent and active trading of portfolio securities to achieve our
investment objective. However, annual portfolio turnover as a result of our purchases and sales of equity securities and call options
may exceed 100%, which is higher than many other investment companies and would involve greater trading costs to us and may result in
greater realization of taxable capital gains.
Hedging and Derivatives Risk.
In addition to writing call options as part of the investment strategy, we may invest in derivative instruments for hedging or risk
management purposes. Our use of derivatives could enhance or decrease the cash available to us for payment of distributions or interest,
as the case may be. Derivatives can be illiquid, may disproportionately increase losses and have a potentially large negative impact on
our performance. Derivative transactions, including options on securities and securities indices and other transactions in which we may
engage (such as forward currency transactions, futures contracts and options thereon, and total return swaps), may subject us to increased
risk of principal loss due to unexpected movements in stock prices, changes in stock volatility levels, interest rates and foreign currency
exchange rates and imperfect correlations between our securities holdings and indices upon which derivative transactions are based. We
also will be subject to credit risk with respect to the counterparties to any over-the-counter derivatives contracts we purchased. If
a counterparty becomes bankrupt or otherwise fails to perform its obligations under a derivative contract, we may experience significant
delays in obtaining any recovery under the derivative contract in a bankruptcy or other reorganization proceeding. We may obtain only
a limited recovery or may obtain no recovery in such circumstances. In addition, if the counterparty to a derivative transaction defaults,
we would not be able to use the anticipated net receipts under the derivative to offset our cost of financial leverage.
Interest rate transactions will expose
us to certain risks that differ from the risks associated with our portfolio holdings. There are economic costs of hedging reflected in
the price of interest rate swaps, floors, caps and similar techniques, the costs of which can be significant, particularly when long-term
interest rates are substantially above short-term rates. In addition, our success in using hedging instruments is subject to our Adviser’s
ability to predict correctly changes in the relationships of such hedging instruments to our leverage risk, and there can be no assurance
that our Adviser’s judgment in this respect will be accurate. Consequently, the use of hedging transactions might result in a poorer
overall performance, whether or not adjusted for risk, than if we had not engaged in such transactions. There is no assurance that the
interest rate hedging transactions into which we enter will be effective in reducing our exposure to interest rate risk. Hedging transactions
are subject to correlation risk, which is the risk that payment on our hedging transactions may not correlate exactly with our payment
obligations on senior securities. To the extent there is a decline in interest rates, the value of certain derivatives could decline,
and result in a decline in our net assets.
Tax Risk. We have elected
to be treated, and intend to qualify each year, as a “regulated investment company” (“RIC”) under the Code. To
maintain our qualification for federal income tax purposes as a RIC under the Code, we must meet certain source-of-income, asset diversification
and annual distribution requirements, as discussed in detail below under “Certain U.S. Federal Income Tax Considerations.”
If for any taxable year we fail to qualify for the special federal income tax treatment afforded to RICs, all of our taxable income will
be subject to federal income tax at regular corporate rates (without any deduction for distributions to our stockholders) and our income
available for distribution will be reduced.
2024 Annual Report | November
30, 2024
Additional
Information (unaudited) (continued)
Anti-Takeover Provisions Risks.
Maryland law and our Charter and Bylaws include provisions that could delay, defer or prevent other entities or persons from acquiring
control of us, causing us to engage in certain transactions or modifying our structure. These provisions may be regarded as “anti-takeover”
provisions. Such provisions could limit the ability of common stockholders to sell their shares at a premium over the then-current market
prices by discouraging a third party from seeking to obtain control of us.
Below Investment Grade Securities
Risk. Investing in below investment grade debt instruments (commonly referred to as “junk bonds”) involves additional
risks than investment grade securities. Adverse changes in economic conditions are more likely to lead to a weakened capacity of a below
investment grade issuer to make principal payments and interest payments than an investment grade issuer. An economic downturn could adversely
affect the ability of highly leveraged issuers to service their obligations or to repay their obligations upon maturity. Similarly, downturns
in profitability in the energy infrastructure industry could adversely affect the ability of below investment grade issuers in that industry
to meet their obligations. The market values of lower quality securities tend to reflect individual developments of the issuer to a greater
extent than do higher quality securities, which react primarily to fluctuations in the general level of interest rates.
The secondary market for below investment
grade securities may not be as liquid as the secondary market for more highly rated securities. There are fewer dealers in the market
for below investment grade securities than investment grade obligations. The prices quoted by different dealers may vary significantly,
and the spread between the bid and asked price is generally much larger than for higher quality instruments. Under adverse market or economic
conditions, the secondary market for below investment grade securities could contract further, independent of any specific adverse change
in the condition of a particular issuer, and these instruments may become illiquid. As a result, it may be more difficult to sell these
securities or we may be able to sell the securities only at prices lower than if such securities were widely traded. This may affect adversely
our ability to make required distribution or interest payments on our outstanding senior securities. Prices realized upon the sale of
such lower-rated or unrated securities, under these circumstances, may be less than the prices used in calculating our NAV.
Because investors generally perceive
that there are greater risks associated with lower quality securities of the type in which we may invest a portion of our assets, the
yields and prices of such securities may tend to fluctuate more than those for higher rated securities. In the lower quality segments
of the debt securities market, changes in perceptions of issuers’ creditworthiness tend to occur more frequently and in a more pronounced
manner than do changes in higher quality segments of the debt securities market, resulting in greater yield and price volatility.
Factors having an adverse impact
on the market value of below investment grade securities may have an adverse effect on our NAV and the market value of our common stock.
In addition, we may incur additional expenses to the extent we are required to seek recovery upon a default in payment of principal or
interest on our portfolio holdings. In certain circumstances, we may be required to foreclose on an issuer’s assets and take possession
of its property or operations. In such circumstances, we would incur additional costs in disposing of such assets and potential liabilities
from operating any business acquired.
Counterparty Risk. We may
be subject to credit risk with respect to the counterparties to certain derivative agreements entered into by us. If a counterparty becomes
bankrupt or otherwise fails to perform its obligations under a derivative contract due to financial difficulties, we may experience significant
delays in obtaining any recovery under the derivative contract in a bankruptcy or other reorganization proceeding. We may obtain only
a limited recovery or may obtain no recovery in such circumstances.
Management Risk. Our Adviser
was formed in 2002 to provide portfolio management to institutional and high-net worth investors seeking professional management of their
MLP investments. Our Adviser has been managing our portfolio since we began operations. To the extent that the Adviser’s assets
under management grow, the Adviser may have to hire additional personnel and, to the extent it is unable to hire qualified individuals,
its operations may be adversely affected.
Additional Risks to Common
Stockholders
Leverage Risk. Our use of
leverage through the issuance of preferred stock (“Tortoise Preferred Shares”) and senior notes (“Tortoise Notes”)
along with the issuance of any additional preferred stock or debt securities, and any additional borrowings or other transactions involving
indebtedness (other than for temporary or emergency purposes) are or would be considered “senior securities” for purposes
of the 1940 Act and create risks. Leverage is a speculative technique that may adversely affect common stockholders. If the return on
securities acquired with borrowed funds or other leverage proceeds does not exceed the cost of the leverage, the use of leverage could
cause us to lose money. Successful use of leverage depends on the Adviser’s ability to predict or hedge correctly interest rates
and market movements, and there is no assurance that the use of a leveraging strategy will be successful during any period in which it
is used. Because the fee paid to the Adviser will be calculated on the basis of Managed Assets, the fees will increase when leverage is
utilized, giving the Adviser an incentive to utilize leverage.
Our issuance of senior securities
involves offering expenses and other costs, including interest payments, which are borne indirectly by our common stockholders. Fluctuations
in interest rates could increase interest or distribution payments on our senior securities, and could reduce cash available for distributions
on common stock. Increased operating costs, including the financing cost associated with any leverage, may reduce our total return to
common stockholders.
Additional
Information (unaudited) (continued)
The 1940 Act and/or the rating agency
guidelines applicable to senior securities impose asset coverage requirements, distribution limitations, voting right requirements (in
the case of the senior equity securities), and restrictions on our portfolio composition and our use of certain investment techniques
and strategies. The terms of any senior securities or other borrowings may impose additional requirements, restrictions and limitations
that are more stringent than those currently required by the 1940 Act, and the guidelines of the rating agencies that rate outstanding
senior securities. These requirements may have an adverse effect on us and may affect our ability to pay distributions on common stock
and preferred stock. To the extent necessary, we intend to redeem our senior securities to maintain the required asset coverage. Doing
so may require that we liquidate portfolio securities at a time when it would not otherwise be desirable to do so. Nevertheless, it is
not anticipated that the 1940 Act requirements, the terms of any senior securities or the rating agency guidelines will impede the Adviser
in managing our portfolio in accordance with our investment objective and policies.
Market Impact Risk. The sale
of our common stock (or the perception that such sales may occur) may have an adverse effect on prices in the secondary market for our
common stock. An increase in the number of common shares available may put downward pressure on the market price for our common stock.
Dilution Risk. The voting
power of current stockholders will be diluted to the extent that current stockholders do not purchase shares in any future common stock
offerings or do not purchase sufficient shares to maintain their percentage interest.
If we are unable to invest the proceeds
of such offering as intended, our per share distribution may decrease and we may not participate in market advances to the same extent
as if such proceeds were fully invested as planned.
Market Discount Risk. Our
common stock has traded both at a premium and at a discount in relation to NAV. We cannot predict whether our shares will trade in the
future at a premium or discount to NAV. Shares of closed-end investment companies frequently trade at a discount from NAV, but in some
cases have traded above NAV. Continued development of alternatives as a vehicle for investment in MLP securities may contribute to reducing
or eliminating any premium or may result in our shares trading at a discount. The risk of the shares of common stock trading at a discount
is a risk separate from the risk of a decline in our NAV as a result of investment activities. Our NAV will be reduced immediately following
an offering of our common or preferred stock, due to the offering costs for such stock, which are borne entirely by us. Although we also
bear the offering costs of debt securities, such costs are amortized over time and therefore do not impact our NAV immediately following
an offering.
Whether stockholders will realize
a gain or loss for federal income tax purposes upon the sale of our common stock depends upon whether the market value of the common shares
at the time of sale is above or below the stockholder’s basis in such shares, taking into account transaction costs, and is not
directly dependent upon our NAV. Because the market value of our common stock will be determined by factors such as the relative demand
for and supply of the shares in the market, general market conditions and other factors beyond our control, we cannot predict whether
our common stock will trade at, below or above NAV, or at, below or above the public offering price for common stock.
Additional Risks to Senior
Security Holders
Generally, an investment in preferred
stock or debt securities (collectively, “senior securities”) is subject to the following risks:
Interest Rate Risk. Distributions
and interest payable on our senior securities are subject to interest rate risk. To the extent that distributions or interest on such
securities are based on short-term rates, our leverage costs may rise so that the amount of distributions or interest due to holders of
senior securities would exceed the cash flow generated by our portfolio securities. To the extent that our leverage costs are fixed, our
leverage costs may increase when our senior securities mature. This might require that we sell portfolio securities at a time when we
would otherwise not do so, which may adversely affect our future ability to generate cash flow. In addition, rising market interest rates
could negatively impact the value of our investment portfolio, reducing the amount of assets serving as asset coverage for senior securities.
Senior Leverage Risk. Preferred
stock will be junior in liquidation and with respect to distribution rights to debt securities and any other borrowings. Senior securities
representing indebtedness may constitute a substantial lien and burden on preferred stock by reason of their prior claim against our income
and against our net assets in liquidation. We may not be permitted to declare distributions or other distributions with respect to any
series of preferred stock unless at such time we meet applicable asset coverage requirements and the payment of principal or interest
is not in default with respect to the Tortoise Notes or any other borrowings.
Our debt securities, upon issuance,
are expected to be unsecured obligations and, upon our liquidation, dissolution or winding up, will rank: (1) senior to all of our outstanding
common stock and any outstanding preferred stock; (2) on a parity with any of our unsecured creditors and any unsecured senior securities
representing our indebtedness; and (3) junior to any of our secured creditors. Secured creditors of ours may include, without limitation,
parties entering into interest rate swap, floor or cap transactions, or other similar transactions with us that create liens, pledges,
charges, security interests, security agreements or other encumbrances on our assets.
2024 Annual Report | November
30, 2024
Additional
Information (unaudited) (continued)
Ratings and Asset Coverage Risk.
To the extent that senior securities are rated, a rating does not eliminate or necessarily mitigate the risks of investing in our
senior securities, and a rating may not fully or accurately reflect all of the credit and market risks associated with a security. A rating
agency could downgrade the rating of our shares of preferred stock or debt securities, which may make such securities less liquid in the
secondary market, though probably with higher resulting interest rates. If a rating agency downgrades, or indicates a potential downgrade
to, the rating assigned to a senior security, we may alter our portfolio or redeem some senior securities. We may voluntarily redeem a
senior security under certain circumstances to the extent permitted by its governing documents.
Inflation Risk. Inflation
is the reduction in the purchasing power of money resulting from an increase in the price of goods and services. Inflation risk is the
risk that the inflation adjusted or “real” value of an investment in preferred stock or debt securities or the income from
that investment will be worth less in the future. As inflation occurs, the real value of the preferred stock or debt securities and the
distributions or interest payable to holders of preferred stock or interest payable to holders of debt securities declines.
Decline in Net Asset Value Risk.
A material decline in our NAV may impair our ability to maintain required levels of asset coverage for our preferred stock or debt
securities.
General Risks Associated with
an Investment in a Closed-End Fund
Market Discount Risk. As with
any shares, the price of the Fund’s shares will fluctuate with market conditions and other factors. If shares are sold, the price
received may be more or less than the original investment. Common shares are designed for long-term investors and should not be treated
as trading vehicles. Common shares of closed-end management investment companies frequently trade at a discount from their NAV. Common
shares of closed-end management investment companies like the Fund that invest primarily in equity securities have during some periods
traded at prices higher than their NAV and during other periods traded at prices lower than their NAV. The Fund cannot assure you that
its common shares will trade at a price higher than or equal to NAV. In addition to NAV, the market price of the Fund’s common shares
may be affected by such factors as distribution levels, which are in turn affected by expenses, distribution stability, liquidity, the
market for equity securities of MLPs, and market supply and demand the Fund’s shares may trade at a price that is less than the
offering price.
Investment Risk. An investment
in the Fund’s common shares is subject to investment risk, including the possible loss of the entire amount that you invest. An
investment in common shares represents an indirect investment in the securities owned by the Fund. The value of these securities, like
other market investments, may move up or down. The Fund common shares at any point in time may be worth less than their value at closing
of the Merger.
Tortoise Energy Independence Fund,
Inc.
General. We are designed primarily
as a long-term investment vehicle and not as a trading tool. An investment in our securities should not constitute a complete investment
program for any investor and involves a high degree of risk. Due to the uncertainty in all investments, there can be no assurance that
we will achieve our investment objective. The value of an investment in our common stock could decline substantially and cause you to
lose some or all of your investment.
Non-Diversification Risk. We
are registered as a non-diversified, closed-end management investment company under the 1940 Act. Accordingly, there are no regulatory
limits under the 1940 Act on the number or size of securities that we hold, and we may invest more assets in fewer issuers compared to
a diversified fund. However, in order to qualify as a RIC for federal income tax purposes, we must meet certain requirements.
Concentration Risk. Our strategy
of concentrating in North American energy investments, particularly upstream energy companies, means that our performance will be closely
tied to the performance of the energy industry. Our concentration in these investments may present more risk than if we were broadly diversified
over numerous industries and sectors of the economy. A downturn in these investments would have a greater impact on us than on a fund
that does not concentrate in such investments. At times, the performance of these investments may lag the performance of other industries
or the market as a whole. Risks inherent in the business of energy companies include:
| • | Commodity Price Volatility Risk. The volatility of
energy commodity prices can significantly affect energy companies due to the impact of prices on the volume of commodities developed,
produced, gathered and processed. Historically, energy commodity prices have been cyclical and exhibited significant volatility which
may adversely impact the value, operations, cash flows and financial performance of energy companies in which we invest. |
Commodity prices fluctuate for several
reasons and can be swift, including changes in global and domestic energy market, general economic conditions, consumer demand, price
and level of foreign imports, the impact of weather on demand, levels of domestic and worldwide supply, levels of production and imports,
domestic and foreign governmental regulation, political instability, acts of war and terrorism, the success and costs of exploration projects,
conservation and environmental protection efforts, alternative energy, taxation and the availability of local, intrastate and interstate
transportation systems.
Additional
Information (unaudited) (continued)
| • | Supply and Demand Risk. A decrease in the exploration,
production or development of natural gas, NGLs, crude oil, refined petroleum products, or a decrease in the volume of such commodities,
may adversely impact the financial performance and profitability of energy companies. Production declines and volume decreases could
be caused by various factors, including changes in commodity prices, oversupply, depletion of resources, declines in estimates of proved
reserves, catastrophic events affecting production, labor difficulties, political events, production variance from expectations, Organization
of the Petroleum Exporting Countries (“OPEC”) actions, environmental proceedings, increased regulations, equipment failures
and unexpected maintenance problems or outages, inability to obtain necessary permits or carryout new construction or acquisitions, unanticipated
expenses, import supply disruption, increased competition from alternative energy sources, and other events. All of the above is particularly
true for new or emerging areas of supply in North America that may have limited or no production history. Reductions in or prolonged
periods of low prices for natural gas and crude oil can cause a given reservoir to become uneconomic for continued production earlier
than it would if prices were higher. |
A sustained decline in or varying
demand for such commodities, could also adversely affect the financial performance of energy companies. Factors that could lead to a decline
in demand include economic recession or other adverse economic conditions, political and economic conditions in other natural resource
producing countries including embargoes, hostilities in the Middle East, military campaigns and terrorism, OPEC actions, higher fuel taxes
or governmental regulations, increases in fuel economy, consumer shifts to the use of alternative fuel sources, exchange rates, and changes
in commodity prices or weather.
| • | Reserve & Depletion Risk. Energy companies’
estimates of proved reserves and projected future net revenue are generally based on internal reserve reports, engineering data, and
reports of independent petroleum engineers. Estimated reserves are based on many assumptions that may prove inaccurate and require subjective
estimates of underground accumulations and assumptions concerning future prices, production levels, and operating and development costs.
As a result, estimated quantities of proved reserves, projections of future production rates, and the timing of related expenditures
may prove to be inaccurate. Any material negative inaccuracies in these reserve estimates or underlying assumptions could materially
lower the value of upstream energy companies. Future natural gas, NGL and oil production is highly dependent upon the success in acquiring
or finding additional reserves that are economically recoverable. This can be particularly true for new areas of exploration and development,
such as in North American oil and gas reservoirs, including shale. A portion of any one upstream company’s assets may be dedicated
to crude oil or natural gas reserves that naturally deplete over time and a significant slowdown in the identification or availability
of reasonably priced and accessible proved reserves for these companies could adversely affect their business. |
| • | Operating Risk. Energy companies are subject to many
operating risks, including: equipment failure causing outages; structural, maintenance, impairment and safety problems; transmission
or transportation constraints, inoperability or inefficiencies; dependence on a specified fuel source; changes in electricity and fuel
usage; availability of competitively priced alternative energy sources; changes in generation efficiency and market heat rates; lack
of sufficient capital to maintain facilities; significant capital expenditures to keep older assets operating efficiently; seasonality;
changes in supply and demand for energy; catastrophic and/or weather-related events such as spills, leaks, well blowouts, uncontrollable
flows, ruptures, fires, explosions, floods, earthquakes, hurricanes, discharges of toxic gases and similar occurrences; storage, handling,
disposal and decommissioning costs; and environmental compliance. Breakdown or failure of an energy company’s assets may prevent
it from performing under applicable sales agreements, which in certain situations, could result in termination of the agreement or incurring
a liability for liquidated damages. As a result of the above risks and other potential hazards associated with energy companies, certain
companies may become exposed to significant liabilities for which they may not have adequate insurance coverage. Any of the aforementioned
risks could have a material adverse effect on the business, financial condition, results of operations and cash flows of energy companies. |
The energy industry is cyclical and
from time to time may experience a shortage of drilling rigs, equipment, supplies, or qualified personnel, or due to significant demand,
such services may not be available on commercially reasonable terms. A company’s ability to successfully and timely complete capital
improvements to existing or other capital projects is contingent upon many variables. Should any such efforts be unsuccessful, an energy
company could be subject to additional costs and / or the write-off of its investment in the project or improvement. The marketability
of oil and gas production depends in large part on the availability, proximity and capacity of pipeline systems owned by third parties.
Oil and gas properties are subject to royalty interests, liens and other burdens, encumbrances, easements or restrictions, all of which
could impact the production of a particular energy company. Oil and gas companies operate in a highly competitive and cyclical industry,
with intense price competition. A significant portion of their revenues may depend on a relatively small number of customers, including
governmental entities and utilities.
Energy companies engaged in interstate
pipeline transportation of natural gas, refined petroleum products and other products are subject to regulation by the Federal Energy
Regulatory Commission (“FERC”) with respect to tariff rates these companies may charge for pipeline transportation services.
An adverse determination by the FERC with respect to the tariff rates of an energy company could have a material adverse effect on its
business, financial condition, results of operations and cash flows and its ability to make cash distributions to its equity owners.
2024 Annual Report | November
30, 2024
Additional
Information (unaudited) (continued)
| • | Regulatory Risk. Energy companies are subject to regulation
by governmental authorities in various jurisdictions and may be adversely affected by the imposition of special tariffs and changes in
tax laws, regulatory policies and accounting standards. Regulation exists in multiple aspects of their operations, including reports
and permits concerning exploration, drilling, and production; how facilities are constructed, maintained and operated; how wells are
spaced; the unitization and pooling of properties; environmental and safety controls, including emissions release, the reclamation and
abandonment of wells and facility sites, remediation, protection of endangered species, and the discharge and disposition of waste materials;
offshore oil and gas operations; and the prices they may charge for the oil and gas produced or transported under federal and state leases
and other products and services. Various governmental authorities have the power to enforce compliance with these regulations and the
permits issued under them, and violators are subject to administrative, civil and criminal penalties, including fines, injunctions or
both. Stricter laws, regulations or enforcement policies could be enacted in the future which may increase compliance costs and may adversely
affect the financial performance of energy companies. Additionally, legislation has been proposed that would, if enacted into law, make
significant changes to U.S. federal income tax laws, including the elimination of certain U.S. federal income tax benefits currently
available to oil and gas exploration and production companies. |
The use of methods such as hydraulic
fracturing may be subject to new or different regulation in the future. Any new state or federal regulations that may be imposed on hydraulic
fracturing could result in additional permitting and disclosure requirements (including of substances used in the fracturing process)
and in additional operating restrictions. The imposition of various conditions and restrictions on drilling and completion operations
could lead to operational delays and increased costs and, moreover, could delay or effectively prevent the development of oil and gas
from formations that would not be economically viable without the use of hydraulic fracturing.
| • | Environmental Risk. Energy company activities are
subject to stringent environmental laws and regulation by many federal, state and local authorities, international treaties and foreign
governmental authorities. Failure to comply with such laws and regulations or to obtain any necessary environmental permits pursuant
to such laws and regulations could result in fines or other sanctions. Congress and other domestic and foreign governmental authorities
have either considered or implemented various laws and regulations to restrict or tax certain emissions, particularly those involving
air and water emissions. Existing environmental regulations could be revised or reinterpreted, new laws and regulations could be adopted
or become applicable, and future changes in environmental laws and regulations could occur, which could impose significant additional
costs. Energy companies have made and will likely continue to make significant capital and other expenditures to comply with these and
other environmental laws and regulations. There can be no assurance that such companies would be able to recover all or any increased
environmental costs from their customers or that their business, financial condition or results of operations would not be materially
and adversely affected by such expenditures or any changes in domestic or foreign environmental laws and regulations, in which case the
value of these companies’ securities could be adversely affected. In addition, energy companies may be responsible for environmentally-related
liabilities, including any on-site liabilities associated with the environmental condition of facilities that it has acquired, leased
or developed, or liabilities from associated activities, regardless of when the liabilities arose and whether they are known or unknown. |
Hydraulic fracturing is a common
practice used to stimulate production of natural gas and/or oil from dense subsurface rock formations such as shales that generally exist
several thousand feet below ground. The companies in which we will invest commonly apply hydraulic-fracturing techniques in onshore oil
and natural gas drilling and completion programs. The process involves the injection of water, sand, and additives under pressure into
a targeted subsurface formation. The water and pressure create fractures in the rock formations, which are held open by the grains of
sand, enabling the oil or natural gas to flow to the wellbore. The use of hydraulic fracturing may produce certain wastes that may in
the future be designated as hazardous wastes and may thus become subject to more rigorous and costly compliance and disposal requirements.
The EPA has commenced a study of potential environmental effects of hydraulic fracturing on drinking water and groundwater, with initial
results expected to be available by late 2012 and final results by 2014 and, more recently in October 2011, the EPA announced that it
is launching a study regarding wastewater resulting from hydraulic fracturing activities and currently plans to propose standards by 2014
that such wastewater must meet before being transported to a treatment plant. Also, the Department of Energy is conducting an investigation
into practices the agency could recommend to better protect the environment from drilling using hydraulic fracturing completion methods
and the Department of the Interior has proposed disclosure, well testing and monitoring requirements for hydraulic fracturing on federal
lands. The White House Council on Environmental Quality and a committee of the US House of Representatives are reviewing hydraulic-fracturing
practices. At the same time, legislation has been introduced before Congress to provide for federal regulation of hydraulic fracturing
and to require disclosure of the chemicals used in the fracturing process. In addition, some states have adopted, and other states are
considering adopting, regulations that could impose more stringent permitting, disclosure and well construction requirements on hydraulic
fracturing operations. Additional regulations could be imposed that could include, among other things, limiting injection of oil and gas
well wastewater into underground disposal wells, due to concerns about the possibility of minor earthquakes being linked to such injection,
an indirect activity to drilling utilized in certain geographic regions. If new laws or regulations that significantly restrict hydraulic
fracturing or associated activity are adopted, such laws could make it more difficult or costly for the companies in which we invest to
perform fracturing to stimulate production from tight formations, which could adversely impact their production levels, operations, cash
flow and the value of their securities.
Additional
Information (unaudited) (continued)
| • | Climate Change Regulation Risk. Climate change regulation
could result in increased operations and capital costs for the companies in which we invest. Voluntary initiatives and mandatory controls
have been adopted or are being discussed both in the U.S. and worldwide to reduce emissions of “greenhouse gases” such as
carbon dioxide, a by-product of burning fossil fuels, which some scientists and policymakers believe contribute to global climate change.
These measures and future measures could result in increased costs to certain companies in which the Fund invests to operate and maintain
facilities and administer and manage a greenhouse gas emissions program and may reduce demand for fuels that generate greenhouse gases
and that are managed or produced by companies in which we invest. These actions could result in increased costs of operations and impact
the demand and prices for fossil fuels. |
| | |
| • | Terrorism Risk. Energy companies, and the market for
their securities, are subject to disruption as a result of terrorist activities, such as the terrorist attacks on the World Trade Center
on September 11, 2001; war, such as the wars in Afghanistan and Iraq and their aftermaths; and other geopolitical events, including upheaval
in the Middle East or other energy producing regions. Cyber hacking could also cause significant disruption and harm to energy companies.
The U.S. government has issued warnings that energy assets, specifically those related to energy, including exploration and production
facilities, pipelines and transmission and distribution facilities, might be specific targets of terrorist activity. Such events have
led, and in the future may lead, to short-term market volatility and may have long-term effects on companies in the energy industry and
markets. Such events may also adversely affect our business and financial condition. |
| | |
| • | Natural Disaster Risk. Natural risks, such as earthquakes,
flood, lightning, hurricanes, tsunamis, tornadoes and wind, are inherent risks in energy company operations. For example, extreme weather
patterns, such as Hurricane Ivan in 2004 and Hurricanes Katrina and Rita in 2005, the Tohuku earthquake and resulting tsunami in Japan
in 2011, or the threat thereof, could result in substantial damage to the facilities of certain companies located in the affected areas
and significant volatility in the supply of energy and could adversely impact the prices of the securities in which we invest. This volatility
may create fluctuations in commodity prices and earnings of energy companies. |
Equity Securities Risk. Equity
securities can be affected by macroeconomic and other factors affecting the stock market in general, expectations about changes in interest
rates, investor sentiment toward such entities, changes in a particular issuer’s financial condition, or unfavorable or unanticipated
poor performance of a particular issuer. Prices of equity securities of individual entities also can be affected by fundamentals unique
to the company or partnership, including size, earnings power, coverage ratio and characteristics and features of different classes of
securities. Equity securities are susceptible to general stock market fluctuations and to volatile increases and decreases in value. The
equity securities held by the Fund may experience sudden, unpredictable drops in value or long periods of decline in value. In addition,
by writing covered call options, capital appreciation potential will be limited on a portion of our investment portfolio.
MLP Risks. An investment in
MLP securities involves some risks that differ from the risks involved in an investment in the common stock of a corporation, including
governance risk, tax risk, and cash flow risk. Governance risk involves the risks associated with the ownership structure of MLPs. MLPs
are also subject to tax risk, which is the risk that MLPs might lose their partnership status for tax purposes. Cash flow risk is the
risk that MLPs will not make distributions to holders (including us) at anticipated levels or that such distributions will not have the
expected tax character. As a result, there could be a material reduction in our cash flow and there could be a material decrease in the
value of our common shares.
Non-U.S. Securities Risk. Investments
in securities of non-U.S. issuers (including Canadian issuers) involve risks not ordinarily associated with investments in securities
and instruments of U.S. issuers. For example, non-U.S. companies are not generally subject to uniform accounting, auditing and financial
standards and requirements comparable to those applicable to U.S. companies. Non-U.S. securities exchanges, brokers and companies may
be subject to less government supervision and regulation than exists in the U.S. Dividend and interest income may be subject to withholding
and other non-U.S. taxes, which may adversely affect the net return on such investments. Because we intend to limit our investments to
no more than 35% of our Total Assets in securities issued by non-U.S. issuers (including Canadian issuers), we not be able to pass through
to our stockholders any foreign income tax credits as a result of any foreign income taxes we pay. There may be difficulty in obtaining
or enforcing a court judgment abroad. In addition, it may be difficult to effect repatriation of capital invested in certain countries.
With respect to certain countries, there are also risks of expropriation, confiscatory taxation, political or social instability or diplomatic
developments that could affect the Fund’s assets held in non-U.S. countries. There may be less publicly available information about
a non-U.S. company than there is regarding a U.S. company. Non-U.S. securities markets may have substantially less volume than U.S. securities
markets and some non-U.S. company securities are less liquid than securities of otherwise comparable U.S. companies. Non-U.S. markets
also have different clearance and settlement procedures that could cause the Fund to encounter difficulties in purchasing and selling
securities on such markets and may result in the Fund missing attractive investment opportunities or experiencing a loss. In addition,
a portfolio that includes securities issued by non-U.S. issuers can expect to have a higher expense ratio because of the increased transaction
costs in non-U.S. markets and the increased costs of maintaining the custody of such non-U.S. securities. When investing in securities
issued by non-U.S. issuers, there is also the risk that the value of such an investment, measured in U.S. dollars, will decrease because
of unfavorable changes in currency exchange rates. We may, but do not currently intend to, hedge our exposure to non-U.S. currencies.
Capital Markets Risk. Global
financial markets and economic conditions have been, and may continue to be, volatile due to a variety of factors, including significant
write-offs in the financial services sector. Despite more stabilized economic activity, if the volatility continues, the cost of raising
capital in the debt and equity capital markets, and the ability to raise capital, may be impacted. In particular, concerns about the general
stability of financial markets and specifically the solvency of lending counterparties, may impact the cost of raising capital from the
credit markets through increased interest rates, tighter lending standards, difficulties in refinancing debt on existing terms or at all
and reduced, or in some cases ceasing to provide, funding to borrowers. In addition, lending counterparties under existing revolving credit
2024 Annual Report | November
30, 2024
Additional Information
(unaudited) (continued)
facilities and other debt instruments
may be unwilling or unable to meet their funding obligations. As a result of any of the foregoing, we or the companies in which we invest
may be unable to obtain new debt or equity financing on acceptable terms. If funding is not available when needed, or is available only
on unfavorable terms, we or the companies in which we invest may not be able to meet obligations as they come due. Moreover, without adequate
funding, energy companies may be unable to execute their growth strategies, complete future acquisitions, take advantage of other business
opportunities or respond to competitive pressures, any of which could have a material adverse effect on their revenues and results of
operations.
Rising interest rates could limit
the capital appreciation of equity units of energy companies as a result of the increased availability of alternative investments at competitive
yields. Rising interest rates may increase the cost of capital for companies operating in this sector. A higher cost of capital or an
inflationary period may lead to inadequate funding, which could limit growth from acquisition or expansion projects, the ability of such
entities to make or grow dividends or distributions or meet debt obligations, the ability to respond to competitive pressures, all of
which could adversely affect the prices of their securities.
In 2010, several European Union (“EU”)
countries, including Greece, Ireland, Italy, Spain, and Portugal, began to face budget issues, some of which may have negative long-term
effects for the economies of those countries and other EU countries. There is continued concern about national-level support for the euro
and the accompanying coordination of fiscal and wage policy among European Economic and Monetary Union member countries. A return to unfavorable
economic conditions could impair our ability to achieve our investment objective. In addition, the events surrounding the recent negotiations
regarding the U.S. federal government debt ceiling and the resulting agreement could adversely affect us. In 2011, S&P lowered its
long-term sovereign credit rating on the U.S. federal government debt to “AA+” from “AAA.” We cannot predict the
effects of these or similar events in the future on the U.S. economy and securities markets or on our portfolio.
Credit Risk. Credit risk refers
to the possibility that the issuer of a security or other instrument will be unable to make timely interest payments and/or repay the
principal on its debt. Because we may invest up to 20% of our Total Assets in debt securities, including those rated below investment
grade, commonly referred to as “junk bonds,” we may be subject to a greater degree of credit risk than a fund investing only
in investment grade securities. Generally, lower-grade securities provide a higher yield than higher-grade securities of similar maturity
but are subject to greater risks, such as greater credit risk, greater volatility and greater liquidity concerns. Such securities are
generally regarded as predominantly speculative and are more susceptible to non-payment of interest and principal and default than higher-grade
securities and are more sensitive to specific issuer developments or real or perceived general adverse economic changes than higher-grade
securities. The market for lower-grade securities may also have less information available than the market for other securities, further
complicating evaluations and valuations of such securities.
Covered Call Risks. We cannot
guarantee that our covered call option strategy will be effective. There are several risks associated with transactions in options on
securities, including:
| • | There are significant differences between the securities
and options markets that could result in an imperfect correlation between these markets, causing a given covered call option transaction
not to achieve its objectives. A decision as to whether, when and how to use covered calls (or other options) involves the exercise of
skill and judgment, and even a well-conceived transaction may be unsuccessful because of market behavior or unexpected events. |
| | |
| • | The use of options may require us to sell portfolio securities
at inopportune times or for prices other than current market values, may limit the amount of appreciation we can realize on an investment,
or may cause us to hold a security we might otherwise sell. As the writer of a covered call option, we forego, during the option’s
life, the opportunity to profit from increases in the market value of the security covering the call option above the exercise price
of the call option, but retain the risk of loss should the price of the underlying security decline. Although such loss would be offset
in part by the option premium received, in a situation in which the price of a particular stock on which we have written a covered call
option declines rapidly and materially or in which prices in general on all or a substantial portion of the stocks on which we have written
covered call options decline rapidly and materially, we could sustain material depreciation or loss to the extent we do not sell the
underlying securities (which may require it to terminate, offset or otherwise cover our option position as well). |
| | |
| • | There can be no assurance that a liquid market will exist
when we seek to close out an option position. If we were unable to close out a covered call option that we had written on a security,
we would not be able to sell the underlying security unless the option expired without exercise. Reasons for the absence of a liquid
secondary market for exchange-traded options may include, but are not limited to, the following: (i) there may be insufficient trading
interest; (ii) restrictions may be imposed by an exchange on opening transactions or closing transactions or both; (iii) trading halts,
suspensions or other restrictions may be imposed with respect to particular classes or series of options; (iv) unusual or unforeseen
circumstances may interrupt normal operations on an exchange; (v) the trading facilities may not be adequate to handle current trading
volume; or (vi) the relevant exchange could discontinue the trading of options. In addition, our ability to terminate OTC options may
be more limited than with exchange-traded options and may involve the risk that counterparties participating in such transactions will
not fulfill their obligations. |
| | |
| • | The principal factors affecting the market value of an option
include supply and demand, interest rates, the current market price of the underlying security in relation to the exercise price of the
option, the dividend or distribution yield of the underlying security, the actual or perceived volatility of the underlying security
and the time remaining until the expiration date. Any of the foregoing could impact or cause to vary over time the amount of income we
are able to generate through our covered call option strategy. |
Additional
Information (unaudited) (continued)
| • | The number of covered call options we can write is limited
by the number of shares of the corresponding common stock we hold. Furthermore, our covered call option transactions may be subject to
limitations established by each of the exchanges, boards of trade or other trading facilities on which such options are traded. |
| • | If we fail to maintain any required asset coverage ratios
in connection with any use by us of leverage, we may be required to redeem or prepay some or all of our leverage instruments. Such redemption
or prepayment would likely result in our seeking to terminate early all or a portion of any option transaction. Early termination of
an option could result in a termination payment by or to us. |
Legal and Regulatory Risk. Legal,
tax and regulatory changes could occur and may adversely affect us or our ability to pursue our investment strategy and/or increase the
costs of implementing such strategies. New (or revised) laws or regulations may be imposed by the Commodity Futures Trading Commission
(“CFTC”), the SEC, the U.S. Federal Reserve or other banking regulators, other governmental regulatory authorities or self-regulatory
organizations that supervise the financial markets that could adversely affect us. In particular, these agencies are empowered to promulgate
a variety of new rules pursuant to recently enacted financial reform legislation in the United States. We also may be adversely affected
by changes in the enforcement or interpretation of existing statutes and rules by these governmental regulatory authorities or self-regulatory
organizations.
The recent instability in the financial
markets has led the U.S. government and foreign governments to take a number of unprecedented actions designed to support certain financial
institutions and segments of the financial markets that have experienced extreme volatility, and in some cases a lack of liquidity. U.S.
federal and state governments and foreign governments, their regulatory agencies or self-regulatory organizations may take additional
actions that affect the regulation of the securities in which we invest, or the issuers of such securities, in ways that are unforeseeable
and on an “emergency” basis with little or no notice, with the consequence that some market participants’ ability to
continue to implement certain strategies or manage the risk of their outstanding positions has been suddenly and/or substantially eliminated
or otherwise negatively impacted. Given the complexities of the global financial markets and the limited timeframe within which governments
have been able to take action, these interventions have sometimes been unclear in scope and application, resulting in confusion and uncertainty,
which in itself has been materially detrimental to the efficient functioning of such markets as well as previously successful investment
strategies. Decisions made by government policy makers could exacerbate the current economic difficulties in the U.S. and other countries.
In addition, the securities and futures
markets are subject to comprehensive statutes, regulations and margin requirements. The CFTC, the SEC, the Federal Deposit Insurance Corporation,
other regulators and self-regulatory organizations and exchanges are authorized under these statutes, regulations and otherwise to take
extraordinary actions in the event of market emergencies. We and our Adviser have historically been eligible for exemptions from certain
regulations. However, there is no assurance that we or our Adviser will continue to be eligible for such exemptions. For example, we have
filed with the CFTC and the National Futures Association a notice claiming an exclusion from the definition of the term “commodity
pool operator” under Regulation 4.5 under the Commodity Exchange Act, as amended (the “CEA”), with respect to our operation.
However, the CFTC has recently adopted amendments to CFTC Regulation 4.5, which, when effective, may subject our Adviser to regulation
by the CFTC, and require it to operate us subject to applicable CFTC requirements, including registration, disclosure and operational
requirements. Compliance with these additional requirements may increase our expenses. Certain of the rules that would apply to us if
we becomes subject to CFTC regulation have not yet been adopted, and while it is unclear what the effect of those rules would be on us
if they are adopted, these rules could potentially limit or restrict our ability to pursue our investment objective and execute our investment
strategy.
Congress recently enacted legislation
that provides for new regulation of the derivatives market, including clearing, margin, reporting, recordkeeping, and registration requirements.
Because the legislation leaves much to agency rule making, its ultimate impact remains unclear. New regulations could, among other things,
restrict our ability to engage in derivative transactions (for example, by making certain types of derivative transactions no longer available
to us) and/or increase the costs of such derivative transactions (for example, by increasing margin or capital requirements), and we may
be unable to execute our investment strategy as a result. It is unclear how the regulatory changes will affect counterparty risk.
The CFTC and certain futures exchanges
have established limits, referred to as “position limits,” on the maximum net long or net short positions which any person
may hold or control in particular options and futures contracts; those position limits may also apply to certain other derivatives positions
we may wish to take. All positions owned or controlled by the same person or entity, even if in different accounts, may be aggregated
for purposes of determining whether the applicable position limits have been exceeded. Thus, even if we do not intend to exceed applicable
position limits, it is possible that different clients managed by our Adviser and its affiliates may be aggregated for this purpose. Therefore
it is possible that the trading decisions of our Adviser may have to be modified and that positions we hold may have to be liquidated
in order to avoid exceeding such limits. The modification of investment decisions or the elimination of open positions, if it occurs,
may adversely affect our performance.
Performance and Distribution Risk.
We may not be able to achieve operating results that will allow us to make distributions at a specific level or to increase the amount
of these distributions from time to time. We cannot assure you that you will receive distributions at a particular level or at all. Dividends
and distributions on equity securities are not fixed but are declared at the discretion of the issuer’s board of directors. If stock
market volatility declines, the level of premiums from writing covered call options will likely decrease as well. Payments to close-out
written call options will reduce amounts available for distribution from gains earned in respect of call option expiration or close out.
The equity securities in which we invest may not appreciate or may decline in value. Net realized and unrealized gains on the securities
investments will be determined primarily by the direction and movement of the applicable securities markets and the Fund’s holdings.
Any gains that we do realize on the
2024 Annual Report | November
30, 2024
Additional
Information (unaudited) (continued)
disposition of any securities may
not be sufficient to offset losses on other securities or option transactions. A significant decline in the value of the securities in
which we invest may negatively impact our ability to pay distributions or cause you to lose all or a part of your investment.
In addition, the 1940 Act may limit
our ability to make distributions in certain circumstances. Restrictions and provisions in any future credit facilities and our debt securities
may also limit our ability to make distributions. For federal income tax purposes, we are required to distribute substantially all of
our net investment income each year both to reduce our federal income tax liability and to avoid a potential excise tax. If our ability
to make distributions on our common stock is limited, such limitations could, under certain circumstances, impair our ability to maintain
our qualification for taxation as a RIC, which would have adverse consequences for our stockholders.
Operating Results Risk. We
could experience fluctuations in our operating results due to a number of factors, including the return on our investments, the level
of our expenses, variations in and the timing of the recognition of realized and unrealized gains or losses on our investments and written
call options, the level of call premium we receive by writing covered calls, the degree to which we encounter competition in our markets
and general economic conditions. As a result of these factors, results for any period should not be relied upon as being indicative of
performance in future periods.
Portfolio Turnover Risk. We
may, but under normal market conditions do not intend to, engage in frequent and active trading of portfolio securities to achieve our
investment objective. However, annual portfolio turnover as a result of our purchases and sales of equity securities and call options
in connection with our covered call option strategy may exceed 100%, which is higher than many other investment companies and would involve
greater trading costs to us and may result in greater realization of taxable capital gains.
Leverage Risk. Our use of
leverage through the issuance of preferred stock or debt securities, and any borrowings or other transactions involving indebtedness (other
than for temporary or emergency purposes) would be considered “senior securities” for purposes of the 1940 Act and create
risks. Leverage is a speculative technique that may adversely affect common stockholders. If the return on securities acquired with borrowed
funds or other leverage proceeds does not exceed the cost of the leverage, the use of leverage could cause us to lose money. Successful
use of leverage depends on our Adviser’s ability to predict or hedge correctly interest rates and market movements, and there is
no assurance that the use of a leveraging strategy will be successful during any period in which it is used. Because the fee paid to our
Adviser will be calculated on the basis of Managed Assets, the fees will increase when leverage is utilized, giving our Adviser an incentive
to utilize leverage.
Our issuance of senior securities
involves offering expenses and other costs, including interest payments, which are borne indirectly by our common stockholders. Fluctuations
in interest rates could increase interest or distribution payments on our senior securities, and could reduce cash available for distributions
on common stock. Increased operating costs, including the financing cost associated with any leverage, may reduce our total return to
common stockholders.
The 1940 Act and/or the rating agency
guidelines applicable to senior securities impose asset coverage requirements, distribution limitations, voting right requirements (in
the case of the senior equity securities), and restrictions on our portfolio composition and our use of certain investment techniques
and strategies. The terms of any senior securities or other borrowings may impose additional requirements, restrictions and limitations
that are more stringent than those currently required by the 1940 Act, and the guidelines of the rating agencies that rate outstanding
senior securities. These requirements may have an adverse effect on us and may affect our ability to pay distributions on common stock
and preferred stock. To the extent necessary, we currently intend to redeem any senior securities to maintain the required asset coverage.
Doing so may require that we liquidate portfolio securities at a time when it would not otherwise be desirable to do so.
Hedging and Derivatives Risk.
In addition to writing call options as part of the investment strategy, we may invest in derivative instruments for hedging or risk
management purposes. Our use of derivatives could enhance or decrease the cash available to us for payment of distributions or interest,
as the case may be. Derivatives can be illiquid, may disproportionately increase losses and have a potentially large negative impact on
our performance. Derivative transactions, including options on securities and securities indices and other transactions in which we may
engage (such as forward currency transactions, futures contracts and options thereon, and total return swaps), may subject us to increased
risk of principal loss due to unexpected movements in stock prices, changes in stock volatility levels, interest rates and foreign currency
exchange rates and imperfect correlations between our securities holdings and indices upon which derivative transactions are based. We
also will be subject to credit risk with respect to the counterparties to any OTC derivatives contracts we purchased. If a counterparty
becomes bankrupt or otherwise fails to perform its obligations under a derivative contract, we may experience significant delays in obtaining
any recovery under the derivative contract in a bankruptcy or other reorganization proceeding. We may obtain only a limited recovery or
may obtain no recovery in such circumstances. In addition, if the counterparty to a derivative transaction defaults, we would not be able
to use the anticipated net receipts under the derivative to offset our cost of financial leverage.
Interest rate transactions will expose
us to certain risks that differ from the risks associated with our portfolio holdings. There are economic costs of hedging reflected in
the price of interest rate swaps, floors, caps and similar techniques, the costs of which can be significant, particularly when long-term
interest rates are substantially above short-term rates. In addition, our success in using hedging instruments is subject to our Adviser’s
ability to predict correctly changes in the relationships of such hedging instruments to our leverage risk, and there can be no assurance
that our Adviser’s judgment in this respect will be accurate. Consequently, the use of hedging transactions might result in a poorer
overall performance, whether or not adjusted for risk, than if we had not engaged in such transactions. There is no assurance that the
interest rate hedging transactions into which we enter will be effective in reducing our exposure to interest rate risk. Hedging transactions
are subject to correlation risk, which is the risk that payment on our hedging transactions may not correlate exactly with our payment
obligations on senior securities. To the extent there is a decline in interest rates, the value of certain derivatives could decline,
and result in a decline in our net assets
Additional
Information (unaudited) (continued)
Tax Risk. We have elected
to be treated, and intend to qualify each year, as a “regulated investment company” (“RIC”) under the Code. To
maintain our qualification for federal income tax purposes as a RIC under the Code, we must meet certain source-of-income, asset diversification
and annual distribution requirements, as discussed in detail below under “Certain U.S. Federal Income Tax Considerations.”
If for any taxable year we fail to qualify for the special federal income tax treatment afforded to RICs, all of our taxable income will
be subject to federal income tax at regular corporate rates (without any deduction for distributions to our stockholders) and our income
available for distribution will be reduced.
Liquidity Risk. We may invest
in securities of any market capitalization and may be exposed to liquidity risk when trading volume, lack of a market maker, or legal
restrictions impair our ability to sell particular securities or close call option positions at an advantageous price or a timely manner.
We may invest in mid-capitalization and small-capitalization companies, which may be more volatile and more likely than large-capitalization
companies to have narrower product lines, fewer financial resources, less management depth and experience and less competitive strength.
In the event certain securities experience limited trading volumes, the prices of such securities may display abrupt or erratic movements
at times. These securities may be difficult to sell at a favorable price at the times when we believe it is desirable to do so.
Delay in Use of Proceeds Risk.
Although we expect to fully invest the net proceeds of this offering within three to six months after the closing of this offering,
such investments may be delayed if suitable investments are unavailable at the time, if market conditions and volumes of securities are
not favorable at the time or for other reasons. As a result, the proceeds may be invested in money market mutual funds, cash, cash equivalents,
securities issued or guaranteed by the U.S. Government or its instrumentalities or agencies, high quality, short-term money market instruments,
short-term debt securities, certificates of deposit, bankers’ acceptances and other bank obligations, commercial paper or other
liquid debt securities. The three to six month timeframe associated with the anticipated use of proceeds could lower returns and lower
our yield in the first year after the issuance of the common stock.
Restricted Securities Risk. We
may invest up to 30% of our Total Assets in restricted securities that are ineligible for resale under Rule 144A, all of which may be
illiquid securities. Restricted securities (including Rule 144A securities) are less liquid than securities traded in the open market
because of statutory and contractual restrictions on resale. Such securities are, therefore, unlike securities that are traded in the
open market, which can be expected to be sold immediately if the market is adequate. This lack of liquidity may create special risks for
us. However, we could sell such securities in private transactions with a limited number of purchasers or in public offerings under the
1933 Act.
Restricted securities are subject
to statutory and contractual restrictions on their public resale, which may make it more difficult to value them, may limit our ability
to dispose of them and may lower the amount we could realize upon their sale. To enable us to sell our holdings of a restricted security
not registered under the 1933 Act, we may have to cause those securities to be registered. The expenses of registering restricted securities
may be determined at the time we buy the securities. When we must arrange registration because we wish to sell the security, a considerable
period may elapse between the time the decision is made to sell the security and the time the security is registered so that we could
sell it. We would bear the risks of any downward price fluctuation during that period.
Rule 144A Securities Risk. We
may purchase Rule 144A securities. Rule 144A provides an exemption from the registration requirements of the 1933 Act for the resale of
certain restricted securities to qualified institutional buyers, such as us. Securities saleable among qualified institutional buyers
pursuant to Rule 144A will not be counted towards the 30% limitation on restricted securities. An insufficient number of qualified institutional
buyers interested in purchasing Rule 144A-eligible securities held by us, however, could affect adversely the marketability of certain
Rule 144A securities, and we might be unable to dispose of such securities promptly or at reasonable prices.
Anti-Takeover Provisions Risks.
Maryland law and our Articles of Incorporation (“Charter”) and Bylaws include provisions that could delay, defer or prevent
other entities or persons from acquiring control of us, causing us to engage in certain transactions or modifying our structure. These
provisions may be regarded as “anti-takeover” provisions. Such provisions could limit the ability of common stockholders to
sell their shares at a premium over the then-current market prices by discouraging a third party from seeking to obtain control of us.
Management Risk. To the extent
that our Adviser’s assets under management grow, our Adviser may have to hire additional personnel and, to the extent they are unable
to hire or retain qualified individuals, our operations may be adversely affected. There can be no guarantee that the Adviser’s
application of investment techniques, call option strategy and risk analyses in making investment decisions for us will produce the desired
results.
Market Discount Risk. Shares
of closed-end investment companies frequently trade at a discount from net asset value but in some cases have traded above net asset value.
Continued development of alternatives as a vehicle for investing in listed energy infrastructure securities may contribute to reducing
or eliminating any premium or may result in our shares trading at a discount. The risk of the shares of common stock trading at a discount
is a risk separate from the risk of a decline in our net asset value as a result of investment activities. Our net asset value will be
reduced immediately following an offering of our common or preferred stock due to the offering costs for such stock, which are borne entirely
by us. Although we also bear the offering costs of debt securities, such costs are amortized over time and therefore do not impact our
net asset value immediately following an offering.
Whether stockholders will realize
a gain or loss for federal income tax purposes upon the sale of our common stock depends upon whether the market value of the common stock
at the time of sale is above or below the stockholder’s basis in such shares, taking into account transaction costs, and it is not
directly dependent upon our net asset value. Because the market value of our common stock will be determined by factors
2024 Annual Report | November
30, 2024
Additional
Information (unaudited) (continued)
such as the relative demand for and
supply of the shares in the market, general market conditions and other factors beyond our control, we cannot predict whether our common
stock will trade at, below or above net asset value, or at, below or above the public offering price for our common stock.
Tortoise Sustainable and Social
Impact Term Fund
Management Risk. Our ability
to achieve our investment objective is directly related to our Adviser’s and our Subadviser’s investment strategies for the
Fund. The value of your investment in our common shares may vary with the effectiveness of the research and analysis conducted by our
Adviser and our Subadviser and their ability to identify and take advantage of attractive investment opportunities. If the investment
strategies of our Adviser and our Subadviser do not produce the expected results, the value of your investment could be diminished or
even lost entirely, and we could underperform the market or other funds with similar investment objectives.
Asset Allocation Risk. Our
investment performance depends, at least in part, on how the Investment Committee of our Adviser allocates and reallocates our assets
among the various asset classes and security types in which we may invest. Such allocation decisions could cause our investments to be
allocated to asset classes and security types that perform poorly or underperform other asset classes and security types or available
investments.
Non-Diversification Risk. We
are registered as a non-diversified, closed-end management investment company under the 1940 Act. Accordingly, there are no regulatory
limits under the 1940 Act on the number or size of securities that we hold, and we may invest more assets in fewer issuers compared to
a diversified fund. However, in order to qualify as a RIC for federal income tax purposes, we must meet certain requirements
Limited
Term and Tender Offer Risks. We are scheduled to dissolve as of the as of the close of business twelve years from the effective date
of the initial registration statement of the Fund (such date, including any extension, the “Termination Date”). Our investment
policies are not designed to return to common shareholders their original net asset value or purchase price. Our final distribution to
common shareholders on the Termination Date and the amount paid to participating common shareholders upon completion of an eligible tender
offer will be based upon our net asset value at such time. Our Declaration of Trust provides that an eligible tender offer (an “Eligible
Tender Offer”) is a tender offer by the Fund to purchase up to 100% of the then-outstanding common shares of beneficial interest
(“common shares”) of the Fund as of a date within the 12 months preceding the Termination Date. Depending on a variety of
factors, including the performance of our investment portfolio over the period of our operations, the amount distributed to common shareholders
in connection with our termination or paid to participating common shareholders upon completion of an Eligible Tender Offer may be less,
and potentially significantly less, than your original investment. Additionally, given the nature of certain of our investments, the amount
actually distributed upon our termination may be less than our net asset value per share on the Termination Date, and the amount actually
paid upon completion of an Eligible Tender Offer may be less than our net asset value per share on the expiration date of the Eligible
Tender Offer.
Because our assets will be liquidated
in connection with our termination or to pay for common shares tendered in an Eligible Tender Offer, we may be required to sell portfolio
securities when we otherwise would not, including at times when market conditions are not favorable, which may cause us to lose money.
Given the nature of certain of our investments, particularly our direct investments, we may be unable to liquidate certain of our investments
until well after the Termination Date. In this case, we may make one or more additional distributions after the Termination Date of any
cash received from the ultimate liquidation of those investments. This would delay distribution payments, perhaps for an extended period
of time, and there can be no assurance that the total value of the cash distribution made on the Termination Date and such subsequent
distributions, if any, will equal our net asset value on the Termination Date, depending on the ultimate results of such post-Termination
Date asset liquidations. If, as a result of lack of market liquidity or other adverse market conditions, our Board of Directors determines
it is in the best interest of the Fund, we may transfer any portfolio investments that remain unsold on the Termination Date to a liquidating
trust and distribute interests in such liquidating trust to common shareholders as part of our final distribution. Interests in the liquidating
trust are expected to be nontransferable, except by operation of law. There can be no assurance as to the timing of or the value obtained
from the liquidation of any investments transferred to a liquidating trust.
The obligation to terminate on the
Termination Date also may impact adversely the implementation of our investment strategies. There can be no assurance that our Adviser
and our Subadviser will be successful in their efforts to minimize any detrimental effects on our investment performance caused by our
obligation to liquidate our investment portfolio and distribute all of our liquidated net assets to common shareholders of record on the
Termination Date. In particular, our Adviser and our Subadviser may face difficulties exiting our direct investments on or prior to the
Termination Date at favorable prices, if at all. In addition, as we approach the Termination Date, we may invest the proceeds of sold,
matured or called securities in money market mutual funds, cash, cash equivalents, securities issued or guaranteed by the U.S. government
or its instrumentalities or agencies, high quality, short-term money market instruments, short-term debt securities, certificates of deposit,
bankers’ acceptances and other bank obligations, commercial paper or other liquid debt securities, which may adversely affect our
investment performance. In the course of the liquidation, we must continue to satisfy the asset diversification requirements to qualify
as a RIC for federal income tax purposes, which may also have a negative effect on our investment performance. If we fail to comply with
these requirements, we may be liable for federal income tax in the year of the liquidation. Moreover, rather than reinvesting the proceeds
of sold, matured or called securities, we may distribute the proceeds in one or more liquidating distributions prior to the final liquidation,
which may cause fixed expenses to increase when expressed as a percentage of our total assets.
Additional
Information (unaudited) (continued)
If we conduct an Eligible Tender
Offer, we anticipate that funds to pay the aggregate purchase price of common shares accepted for purchase pursuant to the tender offer
will be first derived from any cash on hand and then from the proceeds from the sale of portfolio investments. In addition, we may be
required to dispose of portfolio investments in connection with any reduction in our outstanding leverage necessary in order to maintain
our desired leverage ratios following an Eligible Tender Offer. The risks related to the disposition of portfolio investments in connection
with our termination also would be present in connection with the disposition of portfolio investments in connection with an Eligible
Tender Offer. It is likely that during the pendency of an Eligible Tender Offer, and possibly for a time thereafter, we will hold a greater
than normal percentage of our total assets in money market mutual funds, cash, cash equivalents, securities issued or guaranteed by the
U.S. government or its instrumentalities or agencies, high quality, short-term money market instruments, short-term debt securities, certificates
of deposit, bankers’ acceptances and other bank obligations, commercial paper or other liquid debt securities, which may adversely
affect our investment performance. If our tax basis for the portfolio investments sold is less than the sale proceeds, we will recognize
capital gains, which we will be required to distribute to common shareholders. In addition, our purchase of tendered common shares pursuant
to an Eligible Tender Offer will have tax consequences for tendering common shareholders and may have tax consequences for non-tendering
common shareholders. The purchase of common shares pursuant to an Eligible Tender Offer will have the effect of increasing the proportionate
interest in the Fund of non-tendering common shareholders. All shareholders remaining after an Eligible Tender Offer will be subject to
proportionately higher expenses due to the reduction in our total assets resulting from payment for the tendered common shares. Such reduction
in our total assets also may result in less investment flexibility, reduced diversification and greater volatility for the Fund, and may
have an adverse effect on our investment performance.
We are not required to conduct an
Eligible Tender Offer. Our Declaration of Trust provides that, following an Eligible Tender Offer, the Fund must have at least $100 million
of net assets to ensure our continued viability (the “Termination Threshold”). If we conduct an Eligible Tender Offer, there
can be no assurance that the number of tendered common shares would not result in our net assets totaling less than the Termination Threshold,
in which case the Eligible Tender Offer will be terminated, no common shares will be repurchased pursuant to the Eligible Tender Offer
and we will terminate on the Termination Date subject to permitted extensions. Following the completion of an Eligible Tender Offer in
which the number of tendered common shares would result in our net assets totaling greater than the Termination Threshold, our Board of
Directors may eliminate the Termination Date upon the affirmative vote of a majority of our Board of Directors and without a vote of our
shareholders. Thereafter, we will have a perpetual existence. Our Adviser may have a conflict of interest in recommending to our Board
of Directors that the Termination Date be eliminated and we have a perpetual existence. We are not required to conduct additional tender
offers following an Eligible Tender Offer and conversion to perpetual existence. Therefore, remaining common shareholders may not have
another opportunity to participate in a tender offer. Shares of closed-end management investment companies frequently trade at a discount
from their net asset value, and as a result remaining common shareholders may only be able to sell their common shares at a discount to
net asset value
Essential Asset-Based Investing Risks. Our focus on essential asset-based investments means that our performance
will be closely tied to the performance of issuers or projects in essential asset sectors such as the education, housing, healthcare,
social and human services, power, water, energy, infrastructure, basic materials, industrial, transportation and telecommunications sectors
and the fiscal and financial health of issuers of municipal securities funding essential asset projects. The concentration of our investments
in these sectors may present more risk than if we were broadly diversified over numerous industries and sectors of the economy. A downturn
in one or more of these sectors would have a greater impact on us than on a fund that does not focus on essential asset-based investments.
The performance of the securities of issuers in multiple essential asset sectors may react similarly to certain market, economic and other
factors. This correlation may be higher during periods of market stress, and there may be times when the performance of securities of
issuers in multiple essential asset sectors lags the performance of the market as a whole. There can be no assurance that the allocation
of our assets among securities of issuers across the range of essential asset sectors will provide our common shareholders with any of
the benefits typically associated with sector diversification.
In addition, our portfolio will be
subject to sector specific risks of the energy and energy infrastructure sector, sustainable infrastructure sector and social infrastructure
sector. Accordingly, we expect that the performance of our investment portfolio will be closely tied to the performance of these sectors.
Risks inherent in the businesses of such companies may include:
| • | Operating Risk. Energy and infrastructure companies
are subject to many operating risks, including equipment failure causing outages; structural, maintenance, impairment and safety problems;
transmission or transportation constraints, inoperability or inefficiencies; dependence on a specified fuel source; changes in electricity
and fuel usage; availability of competitively priced alternative energy sources; changes in generation efficiency and market heat rates;
lack of sufficient capital to maintain facilities; significant capital expenditures to keep older assets operating efficiently; seasonality;
changes in supply and demand for energy; catastrophic and/or weather-related events such as spills, leaks, well blowouts, uncontrollable
flows, ruptures, fires, explosions, floods, earthquakes, hurricanes, discharges of toxic gases and similar occurrences; storage, handling,
disposal and decommissioning costs; and environmental compliance. |
The energy and infrastructure sectors
are cyclical and from time to time may experience a shortage of drilling rigs, equipment, supplies or qualified personnel. A company may
not be able to successfully and timely complete capital improvements to existing or other capital projects, which could subject the company
to additional costs and/or the write-off of its investment in the project or improvement. The marketability of oil and gas production
depends in large part on the availability, proximity and capacity of pipeline systems owned by third parties. Oil and gas properties are
subject to royalty interests, liens and other burdens, encumbrances, easements or restrictions, all of which could impact the production
of a particular energy company. Oil and gas companies operate in a highly competitive and cyclical industry, with intense price competition.
A significant portion of their revenues may depend on a relatively small number of customers, including governmental entities and utilities.
2024 Annual Report | November
30, 2024
Additional
Information (unaudited) (continued)
Energy companies engaged in interstate
pipeline transportation of natural gas, refined petroleum products and other products are subject to federal regulation with respect to
the tariff rates these companies may charge for pipeline transportation services. An adverse determination with respect to the tariff
rates of an energy company could have a detrimental effect on its business. Clean energy-related investments are subject to many of the
same operating risks that apply to traditional energy companies, as described above. Such companies can also be negatively affected by
lower energy output resulting from variable inputs, mechanical breakdowns, faulty technology, competitive electricity markets or changing
laws that mandate the use of renewable energy sources by electric utilities. In addition, companies that engage in energy efficiency projects
may be unable to protect their intellectual property or face declines in the demand for their services due to changing governmental policies
or budgets, among other things.
Recently imposed tariffs on imports
could affect a number of energy sectors, including oil, gas, solar and wind sectors by increasing operating costs.
| • | Construction Risk. To the extent we invest in projects
that involve significant construction, including but not limited to clean energy-related investments, such projects are subject to construction
risk. Construction delays may adversely affect companies that generate power from clean sources. The ability of these projects to generate
revenues will often depend upon their successful completion of the construction and operation of generating assets. Capital equipment
for renewable energy projects needs to be manufactured, shipped to project sites, installed and tested on a timely basis. In addition,
on-site roads, substations, interconnection facilities and other infrastructure all need to be either built or purchased and installed
by the operating companies of these projects. Construction phases may not be completed or may be substantially delayed, as a result of
inclement weather, labor disruptions, technical complications or other reasons, and material cost over-runs may be incurred, which may
result in such projects being unable to earn positive income, which could negatively impact the market values of our Direct Investments
in clean energy-related issuers. |
| • | Regulatory Risk. Energy and infrastructure companies,
including sustainable and social infrastructure companies, are subject to regulation by governmental authorities in various jurisdictions
and may be adversely affected by the imposition of special tariffs and changes in tax laws, regulatory policies and accounting standards.
Regulation exists in multiple aspects of their operations, including reports and permits concerning exploration, drilling and production;
how facilities are constructed, maintained and operated; how wells are spaced; the unitization and pooling of properties; environmental
and safety controls, including emissions release, the reclamation and abandonment of wells and facility sites, remediation, protection
of endangered species and the discharge and disposition of waste materials; offshore oil and gas operations; and the prices they may
charge for the oil and gas produced or transported under federal and state leases and other products and services. Stricter laws, regulations
or enforcement policies could be enacted in the future which may increase compliance costs and may adversely affect the financial performance
of such companies. Additionally, future legislation may make significant changes to U.S. federal income tax laws, including the elimination
of certain U.S. federal income tax benefits currently available to oil and gas exploration and production companies. The use of methods
such as hydraulic fracturing may be subject to new or different regulation in the future. Any new state or federal regulations that may
be imposed on hydraulic fracturing could result in additional permitting and disclosure requirements (including of substances used in
the fracturing process) and in additional operating restrictions. The imposition of various conditions and restrictions on drilling and
completion operations could lead to operational delays and increased costs and, moreover, could delay or effectively prevent the development
of oil and gas from formations that would not be economically viable without the use of hydraulic fracturing. |
The market for electricity generation
projects is influenced by U.S. federal, state and local government regulations and policies concerning the electric utility industry,
as well as policies promulgated by electric utilities. Customer purchases of, or further investment in the research and development of,
clean energy technologies could be deterred by these regulations and policies, which could result in a significant reduction in the potential
demand for clean energy project development and investments. For example, without certain major incentive programs and or the regulatory
mandated exception for clean energy systems, utility customers are often charged interconnection or stand by fees for putting distributed
power generation on the electric utility network. These fees could increase the cost to customers of using clean energy and make it less
desirable.
| • | Environmental Risk. Energy and infrastructure company
activities, including sustainable and social infrastructure company activities, are subject to stringent environmental laws and regulation
by many federal, state and local authorities, international treaties and foreign governmental authorities. Failure to comply with such
laws and regulations or to obtain any necessary environmental permits pursuant to such laws and regulations could result in fines or
other sanctions. Congress and other domestic and foreign governmental authorities have either considered or implemented various laws
and regulations to restrict or tax certain emissions, particularly those involving air and water emissions. Existing environmental regulations
could be revised or reinterpreted, new laws and regulations could be adopted or become applicable, and future changes in environmental
laws and regulations could occur, which could impose significant additional costs. Energy companies have made and will likely continue
to make significant capital and other expenditures to comply with these and other environmental laws and regulations. There can be no
assurance that such companies would be able to recover all or any increased environmental costs from their customers. In addition, energy
companies may be responsible for environmentally-related liabilities, including any on-site liabilities associated with the environmental
condition of facilities that it has acquired, leased or developed, or liabilities from associated activities, regardless of when the
liabilities arose and whether they are known or unknown. |
Additional
Information (unaudited) (continued)
| • | Climate Change Regulation Risk. Climate change regulation
could result in increased operations and capital costs for the companies in which we invest. Voluntary initiatives and mandatory controls
have been adopted or are being discussed both in the United States and worldwide to reduce emissions of “greenhouse gases”
such as carbon dioxide, a by-product of burning fossil fuels, which some scientists and policymakers believe contribute to global climate
change. These measures and future measures could result in increased costs to certain companies in which we invest and could impact the
demand and prices for fossil fuels. |
| • | Government Incentives Risk. The reduction or elimination
of government economic incentives could impede growth of certain essential asset issuers including in particular clean energy companies.
Because a significant portion of the revenues to the clean energy-related issuers in which we expect to invest are expected to involve
the market for the international and domestic electricity grids, the reduction or elimination of government and economic incentives may
adversely affect the growth of this market or result in increased price competition. |
| • | Renewable Energy Risk. Renewable energy companies
are dependent upon factors such as available solar resource, wind conditions, weather conditions and power generating equipment performance
that may significantly impact the performance of such companies. Solar, wind and weather conditions generally have natural variations
from season to season and from year to year and may also change permanently because of climate change or other factors. Solar and wind
energy is highly dependent on weather conditions and, in particular, on available solar and wind conditions. Moreover, power generating
equipment used generally by renewable energy companies is accompanied by the attendant costs of maintaining such equipment while in use
and subject to risks of obsolescence associated with emerging and disruptive new technologies. |
| • | Gas Risk. Gas transmission companies and gas distribution
companies are undergoing significant changes. Many companies have diversified into oil and gas exploration and development, making returns
more sensitive to energy prices. Gas utility companies have been adversely affected by disruptions in the oil industry and have also
been affected by increased concentration and competition. In certain jurisdictions, acquisitions and dispositions in this industry might
require regulatory approvals and be subject to significant regulatory requirements. Obtaining any such approvals and complying with any
such regulatory requirements may be costly and/or time-consuming to obtain. For example, in the United States, interstate transmission
companies are regulated by the Federal Energy Regulatory Commission (“FERC”), so certain of the Fund’s acquisitions
and dispositions may be subject to FERC approval under the U.S. Federal Power Act, as amended. |
| • | Commodity Price Volatility Risk. The volatility of
energy commodity prices can significantly affect energy companies due to the impact of prices on the volume of commodities developed,
produced, gathered and processed. In addition, the performance of clean energy-related investments may be affected by changes in the
market price of electricity. |
Historically, commodity prices have
been cyclical and exhibited significant volatility, which may adversely impact the market prices, operations, cash flows and financial
performance of our investments in the energy sector. Commodity prices fluctuate for several reasons, including changes in global and domestic
energy market, general economic conditions, consumer demand, price and level of foreign imports, the impact of weather on demand, levels
of domestic and worldwide supply, levels of production and imports, domestic and foreign governmental regulation, political instability,
acts of war and terrorism, the success and costs of resource development, conservation and environmental protection efforts, competition
from other sources, taxation and the availability of local, intrastate and interstate transportation systems.
| • | Supply and Demand Risk. A decrease in the exploration,
production or development of natural gas, natural gas liquids, crude oil or refined petroleum products, or a decrease in the volume of
such commodities, may adversely impact the financial performance and profitability of energy companies. Production declines and volume
decreases could be caused by various factors, including changes in commodity prices, oversupply, depletion of resources, declines in
estimates of proved reserves, catastrophic events affecting production, labor difficulties, political events, production variance from
expectations, Organization of the Petroleum Exporting Countries (“OPEC”) actions, environmental proceedings, increased regulations,
equipment failures and unexpected maintenance problems or outages, inability to obtain necessary permits or carry out new construction
or acquisitions, unanticipated expenses, import supply disruption, increased competition from alternative energy sources and other events.
Reductions in or prolonged periods of low prices for natural gas and crude oil can cause a given reservoir to become uneconomic for continued
production earlier than it would if prices were higher. |
A sustained decline in or varying
demand for such commodities could also adversely affect the financial performance of energy companies. Factors that could lead to a decline
in demand include economic recession or other adverse economic conditions, political and economic conditions in other natural resource
producing countries including embargoes, hostilities in the Middle East, military campaigns and terrorism, OPEC actions, higher fuel taxes
or governmental regulations, increases in fuel economy, consumer shifts to the use of alternative fuel sources, exchange rates and changes
in commodity prices or weather.
| • | Water Risk. Water supply utilities are companies that
collect, purify, distribute and sell water. In the United States and around the world the industry is highly fragmented because most
of the supplies are owned by local authorities. Companies in this industry are generally mature and are experiencing little or no per
capita volume growth. Water supply utilities are subject to the risk of existing or future environmental contamination, including, among
others, soil and groundwater contamination as well as the delivery of contaminated water, as a result of the spillage of hazardous materials
or other pollutants. Water supply utilities are also subject to the risk of increased costs, which may result from a number of factors,
including fluctuations in water availability or costs associated with desalination. |
2024 Annual Report | November
30, 2024
Additional
Information (unaudited) (continued)
| • | Public Infrastructure Risks. We may invest in public
infrastructure projects that constitute significant strategic value to public or governmental bodies. Such assets may have a national
or regional profile and may have monopolistic or oligopolistic characteristics. The very nature of these assets could create additional
risks not common in other industry sectors. Given the national or regional profile and/or irreplaceable nature of certain strategic assets,
such assets may constitute a higher risk target for terrorist acts or political actions, such as expropriation, which may negatively
affect the operations, revenue, profitability or contractual relationships of investments. For example, in response to public pressure
and/or lobbying efforts by specific interest groups, government entities may put pressure on these investments to reduce toll rates,
limit or abandon planned rate increases and/or exempt certain classes of users from tolls. Given the essential nature of the services
provided by certain public infrastructure, there is also a higher probability that if an owner of such assets fails to make such services
available, users of such services may incur significant damage and may be unable to replace the supply or mitigate any such damage, thereby
heightening the risks of third-party claims. These assets are also impacted by the interests of local communities and stakeholders, which
may affect the operation of such assets. Certain of these communities may have or develop interests or objectives which are different
from, or even in conflict with, the owners of such assets. |
| • | Education Risks. Education facilities may be impacted
by risks beyond their operating and financial performance, including being adversely impacted by changes in the political environment,
public sentiment or regulation. This could cause a reduction or loss in funding from local, state and federal governments. Additionally,
certain education facilities (such as charter schools) are also operated pursuant to charters granted by various state or other regulatory
authorities and are dependent upon compliance with the terms of such charters in order to obtain funding from local, state and federal
governments and we can be adversely affected by a facility’s failure to comply with its charter, an adverse audit or review, or
non-renewal or revocation of a charter. |
Equity Securities
Equity Securities Risk, Including
Common Stock Risk. Market prices of common stocks and other equity securities may be affected by macroeconomic and other factors affecting
the stock market in general, including changes in financial or political conditions that may affect particular industries or the economy
in general and changes in investor sentiment. Prices of equity securities of individual issuers also can be affected by fundamentals unique
to the issuer, including changes, or perceived changes, in the issuer’s business, financial condition or prospects, and may fall
to zero in the event of the issuer’s bankruptcy. Equity security prices have historically experienced periods of significant volatility,
particularly during recessions or other periods of financial stress, and can be expected to experience significant volatility in the future.
The equity securities we hold may undergo sudden, unpredictable drops in price or long periods of price decline. There can be no assurance
that the level of dividends paid with respect to the dividend paying equity securities in which we invest will be maintained. In addition,
by writing covered call options on a portion of the listed equity securities in our investment portfolio, the capital appreciation potential
of such securities will be limited.
The performance of certain of the
equity securities in which we invest, including certain common stocks and the preferred equities and MLPs in which we invest, may be sensitive
to changes in market interest rates and, accordingly, may be more highly correlated than the broader equity markets with the performance
of debt securities, including the debt securities in which we invest. Accordingly, there can be no assurance that the allocation of our
assets among equity and debt securities will provide our common shareholders with any of the benefits typically associated with asset
class diversification.
Small- and Mid-Capitalization
Company Risk. Investing in equity securities of small-capitalization and mid-capitalization companies may involve greater risks than
investing in equity securities of larger, more established companies. Small-capitalization and mid-capitalization companies generally
have limited product lines, markets and financial resources. Their equity securities may trade less frequently and in more limited volumes
than the equity securities of larger, more established companies. Also, small-capitalization and mid-capitalization companies are typically
subject to greater changes in earnings and business prospects than larger companies. As a result, the market prices of their equity securities
may experience greater volatility and may decline more than those of large-capitalization companies in market downturns.
Preferred Equity Risk. The
right of a holder of an issuer’s preferred equity to distributions, dividends and liquidation proceeds is junior to the rights of
the issuer’s creditors, including holders of debt securities. Market prices of preferred equities may be subject to factors that
affect debt and equity securities, including changes in market interest rates and changes, or perceived changes, in the issuer’s
creditworthiness. Holders of preferred equity may suffer a loss of value if distribution or dividend rates are reduced or distributions
or dividends are not paid. Under normal conditions, holders of preferred equity usually do not have voting rights with respect to the
issuer. The ability of holders of preferred equity to participate in the issuer’s growth may be limited.
MLP Risks. An investment in
MLP securities involves some risks that differ from the risks involved in an investment in the common stock of a corporation, including
governance risk, tax risk, and cash flow risk. Governance risk involves the risks associated with the ownership structure of MLPs. MLPs
are also subject to tax risk, which is the risk that MLPs might lose their partnership status for tax purposes. Cash flow risk is the
risk that MLPs will not make distributions to holders (including us) at anticipated levels or that such distributions will not have the
expected tax character. As a result, there could be a material reduction in our cash flow and there could be a material decrease in the
value of our common shares.
Additional
Information (unaudited) (continued)
Debt Securities
Debt Securities Risks. Investments
in debt securities are generally subject to credit risk, extension risk, interest rate risk, prepayment risk and spread risk:
| • | Credit Risk. Credit risk is the risk that the market
value of debt securities may decline if the issuer or the borrower, or a guarantor, defaults or otherwise becomes unable or unwilling,
or is perceived to be unable or unwilling, to honor its financial obligations, such as making timely payments of principal or interest.
We could lose money if the issuer of or borrower under, or a guarantor of, a debt security defaults or is unable or unwilling to make
timely principal or interest payments. The lower quality or unrated securities in which we invest may present increased credit risk as
compared to higher rated securities, including the possibility of default or bankruptcy. |
| • | Extension Risk. During periods of rising market interest
rates, it becomes more expensive for a borrower to refinance its existing debt obligations. During such periods, repayments of debt securities
may occur more slowly than anticipated by the market because the issuer or borrower will prefer to pay interest at a lower rate. This
may cause the market prices of such debt securities to decline. |
| • | Interest Rate Risk. The market prices of debt securities
typically decline in the event of increases in market interest rates, which are currently near historically low levels. Changes in government
policy may cause market interest rates to rise, which may result in periods of market volatility or harm our performance and net asset
value. Declines in market interest rates also may increase prepayments of debt securities, which, in turn, would increase prepayment
risk. Debt securities with longer maturities tend to be more sensitive to changes in market interest rates, typically making their prices
more volatile than securities with shorter maturities. The Federal Reserve recently raised the federal funds rate several times, and
has indicated that it may continue to do so. Therefore, there is a risk that interest rates will rise, which will likely drive down bond
prices. |
| • | Prepayment, Call or Reinvestment Risk. Many issuers
and borrowers have a right to prepay their debt securities prior to the stated maturity date. If market interest rates fall, an issuer
or borrower may exercise this right in order to refinance its debt obligations at a lower rate. In that event, a holder of the issuer’s
or borrower’s debt securities will not benefit from the rise in market price that normally accompanies a decline in market interest
rates. Reinvestment risk is the risk that, upon the sale or repayment (at maturity or otherwise) of debt securities we hold, we will
be required to reinvest the proceeds in debt securities paying lower interest rates than the debt securities that were sold or repaid.
In this event, our distribution rate may decline. A decline in the income we receive from our investments is likely to have a negative
effect on our market price, net asset value and/or overall return. |
| • | Spread Risk. Wider credit spreads and decreasing market
values typically represent a deterioration of a debt security’s credit soundness and a perceived greater likelihood or risk of
default by the issuer. High Yield Securities Risks. High yield debt securities, commonly referred to as “junk” bonds, are
debt securities rated below investment grade (i.e., BB+/Ba1 or lower) or unrated securities that our Adviser or Subadviser deems to be
of comparable quality. These securities may be subject to greater levels of credit and liquidity risk than debt securities rated investment
grade. In addition, high yield debt securities generally have greater price fluctuations, are less liquid and are more likely to experience
a default than higher rated debt securities. High yield debt securities are considered predominately speculative with respect to the
issuer’s continuing ability to make principal and interest payments. High yield debt securities are especially subject to adverse
changes in general economic conditions and in the industries in which the issuers are engaged, to changes in the financial condition
of the issuers and to price fluctuations in response to changes in interest rates. |
During recessions, other periods
of financial stress or periods of rising interest rates, highly leveraged issuers may experience financial stress that could adversely
affect their ability to make payments of interest and principal and increase the possibility of default. The market prices of high yield
debt securities have historically been subject to significant, rapid declines, reflecting an expectation that many issuers of such securities
might experience financial difficulties. In these events, the yields on high yield debt securities rise dramatically, reflecting the risk
that holders of such securities could lose a substantial portion of the value of their investment as a result of the issuers’ financial
restructuring or default. It can be expected that similar market price declines will occur in the future. The market for high yield debt
securities generally is thinner and less active than that for higher rated securities, which may limit our ability to sell such securities
at fair value in response to changes in the economy or financial markets. Adverse publicity and investor perceptions, whether or not based
on fundamental analysis, also may decrease the market prices and liquidity of high yield debt securities, especially in a thinly traded
market. Changes by NRSROs in their rating of a debt security may affect the market price of such security. Analysis of the creditworthiness
of issuers of high yield debt securities may be more complex than for issuers of higher-quality debt securities, and our ability to achieve
our investment objective may, to the extent we invest in high yield debt securities, be more dependent upon our Adviser’s credit
analysis than would be the case if we were investing in higher-quality debt securities.
The corporate debt securities in
which we invest generally will be high yield debt securities. Because the performance of high yield corporate debt securities, especially
during periods of market stress, may be affected by changes, or perceived changes, in the issuer’s business, financial condition
or prospects, the performance of our investments in high yield corporate debt securities may be correlated with the performance of equity
securities, including the equity securities in which we invest. Accordingly, there can be no assurance that the allocation of our assets
among equity and debt securities will provide our common shareholders with any of the benefits typically associated with asset class diversification.
2024 Annual Report | November
30, 2024
Additional
Information (unaudited) (continued)
Defaulted Securities Risks. Defaulted
securities are speculative and involve substantial risks in addition to the risks of investing in high yield securities or unrated securities
of comparable quality that have not defaulted. We generally will not receive interest payments on the defaulted securities and there is
a substantial risk that principal will not be repaid. We may incur additional expenses to the extent we are required to seek recovery
upon a default in the payment of principal of or interest on our portfolio holdings. In any reorganization or liquidation proceeding relating
to a defaulted security, we may lose the value of our entire investment or may be required to accept cash or securities with a value less
than our original investment. Defaulted securities and any securities received in exchange for defaulted securities may be subject to
restrictions on resale.
Bank Loan and Loan Participation
Risks. Investing in bank loans involves risks that are additional to and different from those relating to investing in other types
of debt securities. Any specific collateral used to secure a bank loan may decline in value or become illiquid, which would adversely
affect the loan’s value. In the event of a borrower’s bankruptcy or other default, we could experience delays or limitations
with respect to our ability to realize the benefits of the collateral securing a bank loan, and there can be no assurance regarding the
value that may be obtained upon the sale of collateral. No active trading market may exist for certain bank loans or loan participations,
which may impair our ability to realize full value in the event we need to sell a loan or loan participation and make it difficult for
us to value the bank loans and loan participations in which we invest. Adverse market conditions may impair the liquidity of some actively
traded bank loans and loan participations. To the extent that a secondary market does exist for certain bank loans and loan participations,
the market may be subject to irregular trading activity and wide bid/ask spreads, which may result in limited liquidity and pricing transparency.
In addition, bank loans and loan participations may be subject to restrictions on sales or assignment and generally are subject to extended
settlement periods that may be longer than seven days.
Subordinated loans are lower in priority
of payment than senior loans. Accordingly, they are typically lower rated and subject to greater risk that the cash flow of the borrower
and the collateral securing the loan, if any, may be insufficient to meet scheduled payments after giving effect to the borrower’s
senior debt obligations. Subordinated loans generally have greater price volatility than senior loans and may be less liquid. We may not
be able to unilaterally enforce all rights and remedies under a bank loan and with regard to any associated collateral. If we purchase
a loan participation, we generally will have no direct right to enforce compliance by the borrower with the terms of the loan agreement,
and we may not directly benefit from the collateral securing the underlying debt obligation. As a result, we would be exposed to the credit
risk of both the borrower under the bank loan and the lender selling the participation.
There is typically less available
information about most bank loans than is the case for many other types of debt instruments. Bank loans may not be deemed to be “securities”
for purposes of the federal securities laws, and bank loan investors may not have the protections of the anti-fraud provisions of the
federal securities laws and must rely instead on contractual provisions in loan agreements and applicable common-law fraud protections.
Municipal-Related Securities Risks.
The yields on, and market prices of, municipal-related securities are dependent on a variety of factors, including general conditions
of the municipal securities market, the size of a particular offering, the maturity of the obligation and the rating of the particular
issue. The ability of issuers of municipal-related securities to make timely payments of interest and repayments of principal may be diminished
during general economic downturns including in respect of potential reallocations of cost burdens among federal, state and local governments
or among parties involved with operating and managing our issuers. In addition, laws enacted in the future by Congress or state legislatures
or referenda could extend the time for payment of principal and/or interest, or impose other constraints on enforcement of such obligations
or on the ability of municipalities to levy taxes.
Issuers of municipal-related securities
might seek protection under the bankruptcy laws. In the event of bankruptcy of such an issuer, we could experience delays in collecting
principal and interest and we may not be able to collect all principal and interest to which we are entitled.
The availability of information in
the municipal-related securities market is less than in other markets, increasing the difficulty of evaluating and valuing securities.
As a result, our investment performance may be more dependent on the analytical abilities of our Adviser. The municipal-related securities
we hold may be secured by payments to be made by private entities, and changes in market conditions affecting such securities, including
the downgrade of a private entity obligated to make such payments, could have a negative impact on the value of our investments, the municipal-related
securities market generally or our performance. We may invest in municipal-related securities that are unsecured. While such unsecured
investments may benefit from the same or similar financial and other covenants available to indebtedness ranking ahead of the investments
and may benefit from cross-default provisions and security over an issuer’s assets, some or all of such terms may not be part of
particular investments. Moreover, our ability to influence an issuer’s affairs, especially during periods of financial distress
or following an insolvency, is likely to be substantially less than that of senior creditors. For example, under typical subordination
terms, senior creditors are able to block the acceleration of the debt or the exercise by debt holders of other rights they may have as
creditors. Accordingly, we may not be able to take steps to protect our investments in a timely manner or at all and there can be no assurance
that our rate of return objectives overall or any particular investment will be achieved. The municipal-related securities market is a
highly fragmented market that is very technically driven and it is expected that there will be regional variations in economic conditions
or supply-demand fundamentals. Because the Fund expects to invest less than 50% of its total assets in tax-exempt municipal-related securities,
the Fund does not expect to be eligible to pay “exempt interest dividends” to shareholders and interest on municipal-related
securities will be taxable to shareholders of the Fund when received as a distribution from the Fund.
Additional
Information (unaudited) (continued)
In addition, our investments may
be more sensitive to adverse economic, business and/or political developments if our investment portfolio includes a substantial portion
of its assets in the securities of similar or related projects and/or types municipal-related securities (for example only, revenue bonds,
general obligation bonds or private activity bonds) as such events may adversely affect a specific industry or local political and economic
conditions, leading to declines in the creditworthiness and value of our investments. The secondary market for certain municipal-related
securities, particularly below investment grade municipal-related securities, tends to be less well-developed or liquid than many other
securities markets, which may adversely affect our ability to sell our investments at attractive prices.
Municipal leases and certificates
of participation involve special risks not normally associated with general obligation or revenue bonds. Leases and installment purchase
or conditional sale contracts (which typically provide for title to the leased asset to pass eventually to the governmental issuer) are
typically utilized as a means for governmental issuers to acquire property and equipment without meeting constitutional and statutory
requirements for the issuance of debt. The debt issuance limitations are deemed to be inapplicable because of the inclusion in many leases
or contracts of “non-appropriation” clauses that relieve the governmental issuer of any obligation to make future payments
under the lease or contract unless money is appropriated for such purpose by the appropriate legislative body on a yearly or other periodic
basis. In addition, such leases or contracts may be subject to the temporary abatement of payments in the event the governmental issuer
is prevented from maintaining occupancy of the leased premises or utilizing the leased equipment. Although the obligations may be secured
by the leased equipment or facilities, the disposition of the property in the event of non-appropriation or foreclosure might prove difficult,
time consuming and costly, and may result in a delay in recovering or the failure to fully recover our original investment. In the event
of non-appropriation, an issuer would be in default, and taking ownership of the assets may be a remedy available to us, although we do
not anticipate that such a remedy would normally be pursued. Certificates of participation, which represent interests in unmanaged pools
of municipal leases or installment contracts, involve the same risks as the underlying municipal leases. In addition, we may be dependent
upon the municipal authority issuing the certificates of participation to exercise remedies with respect to the underlying securities.
Certificates of participation also entail a risk of default or bankruptcy, both of the issuer of the municipal lease and also the municipal
agency issuing the certificate of participation.
The municipal-related securities
in which we invest generally will be directly originated municipal securities. Directly originated securities represent obligations structured
directly by a single purchaser, or a limited number of institutional purchasers, and the issuer, and are typically not rated by credit
rating agencies. We expect that the directly originated municipal-related securities in which we invest generally will be deemed by our
Adviser to be of comparable quality to securities rated below investment grade and that such securities will belong to relatively small
issues. We expect that the directly originated municipal-related securities in which we invest will have limited trading markets and therefore
will tend to be less liquid than municipal securities rated investment grade or issued by traditional municipal issuers. This may make
it difficult for us to value the municipal-related securities in which we invest. In addition, we will likely be able to sell such municipal-related
securities only in private transactions with another investor or group of investors, and there can be no assurance that we will be able
to successfully arrange such transactions if and when we desire to sell any of our municipal related securities or, if successfully arranged,
that we will be able to obtain favorable values upon the sale of our municipal-related securities in such transactions.
Additional risks for investing in
municipal securities depending on the types of each securities include:
| • | Municipal Note Risks. Municipal notes are shorter
term municipal debt obligations that typically provide interim financing in anticipation of tax collection, bond sales or revenue receipts.
To the extent there is a shortfall in the anticipated proceeds, the notes may not be fully repaid by an issuer and our returns would
be adversely affected. |
| • | Private Activity Bond Risks. Private activity bonds
are, in most cases, tax-exempt securities issued by states, municipalities or public authorities to provide funds, typically through
a loan or lease arrangement, to a private entity for the purpose of financing construction or improvement of a facility to be used by
the entity. Such bonds are secured typically by revenues derived from loan repayments or lease payments due from the entity, which may
or may not be guaranteed by a parent entity or otherwise secured. Private activity securities generally are not secured by a pledge of
the taxing power of the issuer of such bonds. Repayment of such securities generally depends on the revenues of a private entity and
may be subject to additional risk of non-payment. |
| • | General Obligation Bond Risks. General obligation
bonds are secured by the issuer’s pledge of its full faith, credit and taxing power for the payment of principal and interest.
Timely payments by the issuer and the repayment of principal when due depend on its credit quality, ability to raise tax revenues and
ability to maintain an adequate tax base. The taxing power of any governmental entity may be limited, however, by provisions of its state
constitution or laws, and an entity’s creditworthiness will depend on many factors, including, for example only, potential erosion
of its tax base due to population declines, natural disasters, declines in the state’s industrial base or inability to attract
new industries, economic limits on the ability to tax without eroding the tax base, state legislative proposals or voter initiatives
to limit ad valorem real property taxes and the extent to which the entity relies on federal or state aid, access to capital markets
or other factors beyond the state’s or entity’s control. |
| • | Revenue Bond Risks. Revenue bonds are payable only
from the revenues derived from a particular facility or class of facilities or, in certain cases, from the proceeds of a special excise
tax or other specific revenue source (for example, payments from the user of the facility being financed) and accordingly, the timely
payment of interest and the repayment of principal in accordance with the terms of the revenue or special obligation bond depends on
the economic viability of such facility or such revenue source. |
| • | Moral Obligation Bond Risks. Moral obligation bonds
are typically issued by special purpose public authorities. If an issuer of moral obligation bonds is unable to meet its obligations,
the repayment of such bonds becomes a moral commitment but not a legal obligation of the state or municipality that created the special
purpose public authority that issued the bonds. |
2024 Annual Report | November
30, 2024
Additional
Information (unaudited) (continued)
| • | Municipal Commercial Paper Risks. Municipal commercial
paper is typically unsecured and issued to meet short-term financing needs. The lack of security presents some risk of loss to us since,
in the event of an issuer’s bankruptcy, unsecured creditors are repaid only after the secured creditors out of the assets, if any,
that remain. |
| • | Municipal Lease Obligation Risks. Certificates of
participation issued by government authorities or entities to finance the acquisition or construction of equipment, land and/or facilities
represent participations in a lease, an installment purchase contract or a conditional sales contract relating to such equipment, land
or facilities and as with debt obligations, are subject to the risk of non-payment. |
| • | Zero-Coupon Securities Risks. Interest on zero-coupon
bonds is not paid on a current basis and accordingly, the values of such securities are subject to greater fluctuations than are the
value of securities that distribute income regularly and may be more speculative than such bonds. Further, the values of zero coupon
bonds may be highly volatile during periods when interest rates rise or fall. |
| • | Tender Option Bond Risks. Investments in tender option
bond transactions expose us to counterparty risk and leverage risk, as well as the risk of loss of principal. |
| • | Variable Rate Demand Obligation Risks. If the bank
or financial institution that is the counterparty on a VRDO is unable to pay, upon demand or at maturity, we may lose money. |
| • | Financial Futures Risks. Trading in financial futures
contracts may tend to be less liquid than trading in other futures contracts. The trading of futures contracts also is subject to certain
market risks, such as inadequate trading activity, which could at times make it difficult or impossible to liquidate existing positions. |
| • | Insured Municipal Bond Risks. Although municipal bond
insurance is expected to protect us against losses caused by a bond issuer’s failure to make interest or principal payments, such
insurance does not protect us or our investors against losses caused by declines in a bond’s market value. Further, we cannot be
certain that any insurance company will make these payments. In addition, if we purchase the insurance, we will bear any related premiums
and other related costs, which will reduce our returns. |
| • | Participation Note Risks. Because a participation
note is an obligation of the issuer, rather than a direct investment in shares of the underlying security or basket of securities, we
may suffer losses potentially equal to the full value of the participation note if the issuer fails to perform its obligations. |
| • | Pay-in-Kind Note Risks. An issuer’s ability
to repay the principal of an investment in pay-in-kind notes may be dependent upon a liquidity event or the long-term success of such
issuer, the occurrence of which is uncertain. |
Operating and Financial Risks
of Issuers and Impact of Other Issuers. One of the fundamental risks associated with our investments is credit risk, which is the
risk that an issuer will be unable to make principal and interest payments on its outstanding debt obligations when due and the related
risk that the value of a debt security may decline because of concerns about the issuer’s ability or willingness to make such payments.
Because we may invest our assets in high yield securities or unrated securities of comparable quality, our credit risks are greater than
those of funds that buy only investment grade securities. Investments in inverse floaters will increase our credit risk. Our return would
be adversely impacted if an issuer of debt securities in which we invest becomes unable to make such payments when due. Issuers in which
we invest could deteriorate as a result of, among other factors, adverse developments in their businesses, changes in the competitive
environment or an economic downturn. As a result, issuers that we expect to be stable may operate, or expect to operate, at a loss or
have significant variations in operating results, may require substantial additional capital to support their operations or to maintain
their competitive position or may otherwise have a weak financial condition or be experiencing financial distress. In addition, we and
other investment funds sponsored by our Adviser have made (and/or will in the future make) investments in issuers that have operations
and assets in many jurisdictions. It is possible that the activities of one issuer may have adverse consequences on one or more other
issuers (including our issuers), even in cases where the issuers are held by different Tortoise investment funds and have no other connection
to each other.
Risks of Investments in Less Established
Issuers. Although from time to time we will seek to make investments in respect of established issuers, we have not established any
minimum size for the issuers in which we may invest and are expected to make investments in smaller, less established issuers. For example,
such issuers may have shorter operating histories on which to judge future performance and, if operating, may have negative cash flow.
In the case of start-up enterprises, such issuers may not have significant or any operating revenues. Less established issuers tend to
have smaller capitalizations and fewer resources (including cash) and, therefore, often are more vulnerable to funding shortfalls and
financial failure. In addition, less mature issuers could be deemed to be more susceptible to irregular accounting or other fraudulent
practices. In the event of fraud by any issuer in which we invest, we may suffer a partial or total loss of capital invested in that issuer.
There can be no assurance that any such losses will be offset by gains (if any) realized on the Fund’s other investments.
U.S. Government Obligation Risks.
While U.S. Treasury obligations are backed by the “full faith and credit” of the U.S. government, such securities are
nonetheless subject to credit risk (i.e., the risk that the U.S. government may be, or be perceived to be, unable or unwilling to honor
its financial obligations, such as making payments). Securities issued or guaranteed by federal agencies or authorities and U.S. government-sponsored
instrumentalities or enterprises may or may not be backed by the full faith and credit of the U.S. government. Other Investment Risks
Additional
Information (unaudited) (continued)
Liquidity Risk. Our Direct
Investments will be highly illiquid, and we will likely be able to sell such securities only in private transactions with another investor
or group of investors, and there can be no assurance that we will be able to successfully arrange such transactions if and when we desire
to sell any of our Direct Investments or, if successfully arranged, that we will be able to obtain favorable values upon the sale of our
Direct Investments in such transactions. In addition, our investments in debt securities may expose us to liquidity risk. The corporate
debt securities in which we invest generally will be high yield debt securities, and these securities have historically been less liquid
than securities rated investment grade, especially during periods of market stress. We expect that the directly originated municipal securities
in which we invest will have limited trading markets and therefore will tend to be less liquid than municipal securities rated investment
grade or issued by traditional municipal issuers.
With respect to our investments in
listed equity securities, we may invest in securities of any market capitalization, including small- and mid-capitalization companies,
and may be exposed to liquidity risk when trading volume, lack of a market maker, or legal restrictions impair our ability to sell particular
securities or close call option positions at an advantageous price or a timely manner. We may invest in mid-capitalization and small-capitalization
companies, which may be more volatile and more likely than large-capitalization companies to have narrower product lines, fewer financial
resources, less management depth and experience and less competitive strength. In the event certain securities experience limited trading
volumes, the prices of such securities may display abrupt or erratic movements at times. These securities may be difficult to sell at
a favorable price at the times when we believe it is desirable to do so.
Private Company Securities Risk.
Our investments in private companies may be subject to higher risk than investments in securities of public companies. Little public
information may exist about many of the issuers of these securities, and we will be required to rely on the ability of our Adviser and
Subadviser to obtain adequate information to evaluate the potential risks and returns involved in investing in these issuers. If our Adviser
or Subadviser is unable to obtain all material information about the issuers of these securities, it may be difficult to make a fully
informed investment decision, and we may lose some or all of our investment in these securities. These factors could subject us to greater
risk than investments in securities of public companies and negatively affect our investment returns, which could negatively impact the
dividends paid to you and the value of your investment. In addition, we will likely be able to sell our investments in private companies
only in private transactions with another investor or group of investors, and there can be no assurance that we will be able to successfully
arrange such transactions if and when we desire to sell any of our investments in private companies or, if successfully arranged, that
we will be able to obtain favorable values upon the sale of our investments in private companies in such transactions.
Restricted Securities Risk, including
Rule 144A Securities Risk. Restricted securities are less liquid than securities traded in the open market because of statutory and
contractual restrictions on resale. Such securities are, therefore, unlike securities that are traded in the open market, which can be
expected to be sold immediately if the market is adequate. This lack of liquidity may create special risks for us.
Restricted securities are subject
to statutory and contractual restrictions on their public resale, which may make it more difficult to value them, may limit our ability
to dispose of them and may lower the amount we could realize upon their sale. To enable us to sell our holdings of a restricted security
not registered under the Securities Act, we may have to cause those securities to be registered. The expenses of registering restricted
securities may be determined at the time we buy the securities. When we must arrange registration because we wish to sell the security,
a considerable period may elapse between the time the decision is made to sell the security and the time the security is registered so
that we could sell it. We would bear the risks of any downward price fluctuation during that period.
Rule 144A provides an exemption from
the registration requirements of the Securities Act for the resale of certain restricted securities to qualified institutional buyers,
such as us. However, an insufficient number of qualified institutional buyers interested in purchasing the Rule 144A-eligible securities
that we hold could affect adversely the marketability of certain Rule 144A securities, and we might be unable to dispose of such securities
promptly or at reasonable prices.
Non-U.S. Securities Risks. Investments
in securities of non-U.S. issuers (including Canadian issuers) involve risks not ordinarily associated with investments in securities
and instruments of U.S. issuers. For example, non-U.S. companies are not generally subject to uniform accounting, auditing and financial
standards and requirements comparable to those applicable to U.S. companies. Non-U.S. securities exchanges, brokers and companies may
be subject to less government supervision and regulation than exists in the U.S. Dividend and interest income may be subject to withholding
and other non-U.S. taxes, which may adversely affect the net return on such investments. Because we intend to limit our investments in
securities issued by non-U.S. issuers (including Canadian issuers) to no more than 30% of our total assets, we will not be able to pass
through to our shareholders any foreign income tax credits as a result of any foreign income taxes we pay. There may be difficulty in
obtaining or enforcing a court judgment abroad. In addition, it may be difficult to effect repatriation of capital invested in certain
countries. With respect to certain countries, there are also risks of expropriation, confiscatory taxation, political or social instability
or diplomatic developments that could affect the Fund’s assets held in non-U.S. countries. There may be less publicly available
information about a non-U.S. company than there is regarding a U.S. company. Non-U.S. securities markets may have substantially less volume
than U.S. securities markets and some non-U.S. company securities are less liquid than securities of otherwise comparable U.S. companies.
Non-U.S. markets also have different clearance and settlement procedures that could cause the Fund to encounter difficulties in purchasing
and selling securities on such markets and may result in the Fund missing attractive investment opportunities or experiencing a loss.
In addition, a portfolio that includes securities issued by non-U.S. issuers can expect to have a higher expense ratio because of the
increased transaction costs in non-U.S. markets
2024 Annual Report | November
30, 2024
Additional
Information (unaudited) (continued)
and the increased costs of maintaining
the custody of such non-U.S. securities. When investing in securities issued by non-U.S. issuers, there is also the risk that the market
price of such an investment, measured in U.S. dollars, will decrease because of unfavorable changes in currency exchange rates. We do
not currently intend to hedge our exposure to non-U.S. currencies.
Investments in companies domiciled
in the United Kingdom (“UK”), or that otherwise have significant ties to the UK, are subject to Brexit risk. Brexit risk is
the risk that the exit of the UK from the European Union occurs in a disruptive manner. Potential effects of a disruptive Brexit include,
but are not limited to, adverse effects on supply chains and labor markets, the potential for new taxes to be imposed on goods crossing
borders, declining real estate markets and a weakening of the pound sterling. Emerging Market Securities Risks. Investments in securities
of non-U.S. issuers located in emerging markets involve all of the risks generally applicable to investments in securities of non-U.S.
issuers. These risks are heightened with respect to investments in emerging market securities. In addition, investments in emerging market
securities are subject to a number of risks, including risks related to economic structures that are less diverse and mature than those
of developed countries; less stable political systems and less developed legal systems; national policies that may restrict foreign investment;
wide fluctuations in the value of investments, possibly as a result of significant currency exchange rate fluctuations; smaller securities
markets making investments less liquid; and special custody arrangements.
Terrorism and Cybersecurity Risks.
Essential asset issuers are subject to disruption as a result of terrorist activities and other geopolitical events, including upheaval
in the Middle East or other energy-producing regions. Cyber hacking could also cause significant disruption and harm to essential asset
issuers. The U.S. government has issued warnings that certain essential assets, specifically those related to energy infrastructure, including
exploration and production facilities, pipelines and transmission and distribution facilities, might be specific targets of terrorist
activity. Additionally, digital and network technologies (collectively, “cyber networks”) might be at risk of cyberattacks
that could potentially seek unauthorized access to digital systems for purposes such as misappropriating sensitive information, corrupting
data or causing operational disruption. Cyberattacks might potentially be carried out by persons using techniques that could range from
efforts to electronically circumvent network security or overwhelm websites to intelligence gathering and social engineering functions
aimed at obtaining information necessary to gain access.
Covered Call Risks. We cannot
guarantee that our covered call option overlay strategy will be effective. There are several risks associated with transactions in options
on securities, including:
| • | There are significant differences between the securities
and options markets that could result in an imperfect correlation between these markets, causing a given covered call option transaction
not to achieve its objectives. A decision as to whether, when and how to use covered calls (or other options) involves the exercise of
skill and judgment, and even a well-conceived transaction may be unsuccessful because of market behavior or unexpected events. |
| • | The use of options may require us to sell portfolio securities
at inopportune times or for prices other than current market values, may limit the amount of appreciation we can realize on an investment
or may cause us to hold a security we might otherwise sell. As the writer of a covered call option, we forego, during the option’s
life, the opportunity to profit from increases in the market value of the security covering the call option above the exercise price
of the call option, but retain the risk of loss should the price of the underlying security decline. Although such loss would be offset
in part by the option premium received, in a situation in which the price of a particular stock on which we have written a covered call
option declines rapidly and materially or in which prices in general on all or a substantial portion of the stocks on which we have written
covered call options decline rapidly and materially, we could sustain material depreciation or loss to the extent we do not sell the
underlying securities (which may require us to terminate, offset or otherwise cover our option position as well). |
| • | There can be no assurance that a liquid market will exist
when we seek to close out an option position. If we were unable to close out a covered call option that we had written on a security,
we would not be able to sell the underlying security unless the option expired without exercise. Reasons for the absence of a liquid
secondary market for exchange-traded options may include, but are not limited to, the following: (1) there may be insufficient trading
interest; (2) restrictions may be imposed by an exchange on opening transactions or closing transactions or both; (3) trading halts,
suspensions or other restrictions may be imposed with respect to particular classes or series of options; (4) unusual or unforeseen circumstances
may interrupt normal operations on an exchange; (5) the trading facilities may not be adequate to handle current trading volume; or (6)
the relevant exchange could discontinue the trading of options. In addition, our ability to terminate OTC options may be more limited
than with exchange-traded options and may involve the risk that counterparties participating in such transactions will not fulfill their
obligations. |
| • | The principal factors affecting the market value of an option
include supply and demand, interest rates, the current market price of the underlying security in relation to the exercise price of the
option, the dividend or distribution yield of the underlying security, the actual or perceived volatility of the underlying security
and the time remaining until the expiration date. Any of the foregoing could impact or cause to vary over time the amount of income we
are able to generate through our covered call option overlay strategy. |
| • | The number of covered call options we can write is limited
by the number of shares of the corresponding common stock we hold. Furthermore, our covered call option transactions may be subject to
limitations established by each of the exchanges, boards of trade or other trading facilities on which such options are traded. |
Additional
Information (unaudited) (continued)
| • | If we fail to maintain any required asset coverage ratios
in connection with any use by us of leverage, we may be required to redeem or prepay some or all of our leverage instruments. Such redemption
or prepayment would likely result in our seeking to terminate early all or a portion of any option transaction. Early termination of
an option could result in a termination payment by or to us. Hedging and Derivatives Risks. In addition to writing call options as part
of our investment strategy, we may invest in derivative instruments for hedging or risk management purposes, and for short-term purposes
such as maintaining market exposure pending investment of the proceeds of this offering or transitioning our portfolio between different
asset classes. Our use of derivatives could enhance or decrease the cash available to us for payment of distributions or interest, as
the case may be. Derivatives can be illiquid, may disproportionately increase losses and have a potentially large negative impact on
our performance. Derivative transactions, including options on securities and securities indices and other transactions in which we may
engage (such as forward currency transactions, futures contracts and options thereon and total return swaps), may subject us to increased
risk of principal loss due to unexpected movements in stock prices, changes in stock volatility levels, interest rates and foreign currency
exchange rates and imperfect correlations between our securities holdings and indices upon which derivative transactions are based. We
also will be subject to credit risk with respect to the counterparties to any OTC derivatives contracts we enter into. |
Interest rate transactions will expose
us to certain risks that differ from the risks associated with our portfolio holdings. There are economic costs of hedging reflected in
the price of interest rate swaps, floors, caps and similar techniques, the costs of which can be significant, particularly when long-term
interest rates are substantially above short-term rates. In addition, our success in using hedging instruments is subject to our Adviser’s
ability to predict correctly changes in the relationships of such hedging instruments to our leverage risk, and there can be no assurance
that our Adviser’s judgment in this respect will be accurate. Consequently, the use of hedging transactions might result in a poorer
overall performance, whether or not adjusted for risk, than if we had not engaged in such transactions. There is no assurance that the
interest rate hedging transactions into which we enter will be effective in reducing our exposure to interest rate risk. Hedging transactions
are subject to correlation risk, which is the risk that payment on our hedging transactions may not correlate exactly with our payment
obligations on senior securities. To the extent there is a decline in interest rates, the market value of certain derivatives could decline
and result in a decline in our net assets.
Counterparty Risk. The risk
exists that a counterparty to a derivatives contract or other transaction in a financial instrument held by us or by a special purpose
or structured vehicle in which we invest may become insolvent or otherwise fail to perform its obligations, including making payments
to us, due to financial difficulties. We may obtain no or limited recovery in a bankruptcy or other reorganizational proceedings, and
any recovery may be significantly delayed. Transactions that we enter into may involve counterparties in the financial services sector
and, as a result, events affecting the financial services sector may cause our share value to fluctuate.
In the event of a counterparty’s
(or its affiliate’s) insolvency, our ability to exercise remedies, such as the termination of transactions, netting of obligations
and realization on collateral, could be stayed or eliminated under new special resolution regimes adopted in the United States, the European
Union and various other jurisdictions. Such regimes generally provide government authorities with broad authority to intervene when a
financial institution is experiencing financial difficulty. In particular, the regulatory authorities could reduce, eliminate or convert
to equity the liabilities us of a counterparty subject to such proceedings in the European Union (sometimes referred to as a “bail
in”).
Operational Risks
Distribution Risks. We may
not be able to achieve operating results that will allow us to make distributions at a specific level or to increase the amount of these
distributions from time to time. We cannot assure you that you will receive distributions at a particular level or at all. Dividends and
distributions on equity securities are not fixed but are declared at the discretion of the issuer’s board of directors. If stock
market volatility declines, the level of premiums from writing covered call options will likely decrease as well. Payments to close-out
written call options will reduce amounts available for distribution from gains earned in respect of call option expiration or close out.
A significant decline in the value of the securities in which we invest may negatively impact our ability to pay distributions or cause
you to lose all or a part of your investment.
In addition, the 1940 Act may limit
our ability to make distributions in certain circumstances. Restrictions and provisions in any future credit facilities and our debt securities
also may limit our ability to make distributions. For federal income tax purposes, we are required to distribute substantially all of
our net investment income each year to maintain our status as a RIC, to reduce our federal income tax liability and to avoid a potential
excise tax. If our ability to make distributions on our common shares is limited, such limitations could, under certain circumstances,
impair our ability to maintain our qualification for taxation as a RIC or result in our having an income or excise tax liability, which
would have adverse consequences for our shareholders.
Operating Results Risk. We
could experience fluctuations in our operating results due to a number of factors, including the return on our investments, the level
of our expenses, variations in and the timing of the recognition of realized and unrealized gains or losses on our investments and written
call options, the level of call premium we receive by writing covered calls, the degree to which we encounter competition in our markets
and general economic conditions. As a result of these factors, results for any period should not be relied upon as being indicative of
performance in future periods.
Market Discount Risk. Shares
of closed-end investment companies frequently trade at a discount from net asset value. Continued development of alternative vehicles
for investing in essential asset companies may contribute to reducing or eliminating any premium or may result in our common shares trading
at a discount. The risk that our common shares may trade at a discount is separate from the risk of a decline in our net asset value as
a result of investment activities.
2024 Annual Report | November
30, 2024
Additional
Information (unaudited) (continued)
Whether shareholders will realize
a gain or loss for federal income tax purposes upon the sale of their common shares depends upon whether the market value of the common
shares at the time of sale is above or below the shareholder’s basis in such common shares, taking into account transaction costs,
and it is not directly dependent upon our net asset value. Because the market price of our common shares will be determined by factors
such as the relative demand for and supply of the shares in the market, general market conditions and other factors beyond our control,
we cannot predict whether our common shares will trade at, below or above net asset value, or at, below or above the public offering price
for our common shares.
Portfolio Turnover Risk. At
times, particularly during our initial twelve months of operation, our portfolio turnover may be higher. High portfolio turnover involves
greater transaction costs to us and may result in greater realization of capital gains, including short-term capital gains.
Valuation Risks. Our Direct
Investments will typically consist of securities for which a liquid trading market does not exist. The fair value of these securities
may not be readily determinable. We will value these securities in accordance with valuation procedures adopted by our Board of Directors.
Our Board of Directors may use the services of an independent valuation firm to review the fair value of certain securities prepared by
our Adviser. The types of factors that may be considered in fair value pricing of our investments include, as applicable, the nature and
realizable value of any collateral, the issuer’s ability to make payments, the markets in which the issuer does business, comparison
to publicly traded companies, discounted cash flow and other relevant factors. Because such valuations, and particularly valuations of
non-traded securities and private companies, are inherently uncertain, they may fluctuate over short periods of time and may be based
on estimates. The determination of fair value by our Board of Directors may differ materially from the values that would have been used
if a liquid trading market for these securities existed. Our net asset value could be adversely affected if the determinations regarding
the fair value of our investments were materially higher than the values that we ultimately realize upon the disposition of such securities.
Tax Risk. We have elected
to be treated, and intend to qualify each year, as a “regulated investment company” (“RIC”) under the Code. To
maintain our qualification for federal income tax purposes as a RIC under the Code, we must meet certain source-of-income, asset diversification
and annual distribution requirements, as discussed in detail below under “Certain U.S. Federal Income Tax Considerations.”
If for any taxable year we fail to qualify for the special federal income tax treatment afforded to RICs, all of our taxable income will
be subject to federal income tax at regular corporate rates (without any deduction for distributions to our stockholders) and our income
available for distribution will be reduced.
Leverage Risks. Our use of
leverage through the issuance of preferred shares or debt securities, and any borrowings or other transactions involving indebtedness
(other than for temporary or emergency purposes), would be considered “senior securities” for purposes of the 1940 Act and
create risks. Leverage is a speculative technique that may adversely affect common shareholders. If the return on investments acquired
with borrowed funds or other leverage proceeds does not exceed the cost of the leverage, the use of leverage could cause us to lose money.
Successful use of leverage depends on our Adviser’s ability to predict or hedge correctly interest rates and market movements, and
there is no assurance that the use of a leveraging strategy will be successful during any period in which it is used. Because the fee
paid to our Adviser and Subadviser will be calculated on the basis of Managed Assets, the fees will increase when leverage is utilized,
giving our Adviser an incentive to utilize leverage.
Our issuance of senior securities
involves offering expenses and other costs, including interest payments, that are borne indirectly by our common shareholders. Fluctuations
in interest rates could increase interest or distribution payments on our senior securities and could reduce cash available for distributions
on common shares. Increased operating costs, including the financing cost associated with any leverage, may reduce our total return to
common shareholders.
The 1940 Act and/or the rating agency
guidelines applicable to senior securities impose asset coverage requirements, distribution limitations, voting right requirements (in
the case of the senior equity securities) and restrictions on our portfolio composition and our use of certain investment techniques and
strategies. The terms of any senior securities or other borrowings may impose additional requirements, restrictions and limitations that
are more stringent than those currently required by the 1940 Act, and the guidelines of the rating agencies that rate outstanding senior
securities. These requirements may have an adverse effect on us and may affect our ability to pay distributions on common shares and preferred
shares. To the extent necessary, we currently intend to redeem any senior securities to maintain the required asset coverage. Doing so
may require that we liquidate portfolio securities at a time when it would not otherwise be desirable to do so.
Capital Markets Risks. In
the event of an economic downturn or increased financial stress, the cost of raising capital in the debt and equity capital markets may
increase, and the ability to raise capital may be limited. In particular, concerns about the general stability of financial markets and
specifically the solvency of lending counterparties may impact the cost of raising capital from the credit markets through increased interest
rates, tighter lending standards, difficulties in refinancing debt on existing terms or at all and reduced, or in some cases ceasing to
provide, funding to borrowers. In addition, lending counterparties under existing revolving credit facilities and other debt instruments
may be unwilling or unable to meet their funding obligations. As a result of any of the foregoing, we or the companies in which we invest
may be unable to obtain new debt or equity financing on acceptable terms. If funding is not available when needed, or is available only
on unfavorable terms, we or the companies in which we invest may not be able to meet obligations as they come due. Moreover, without adequate
funding, essential asset companies may be unable to execute their growth strategies, complete future acquisitions, take advantage of other
business opportunities or respond to competitive pressures, any of which could have a material adverse effect on their revenues and results
of operations.
Additional
Information (unaudited) (continued)
Legal, Regulatory and Policy Risks.
Legal and regulatory changes could occur that may adversely affect us, our investments and our ability to pursue our investment strategies
and/or increase the costs of implementing such strategies. Certain changes have already been proposed and additional changes are expected.
New or revised laws or regulations may be imposed by the SEC, the U.S. Commodity Futures Trading Commission (the “CFTC”),
the Internal Revenue Service, the U.S. Federal Reserve or other governmental regulatory authorities or self-regulatory organizations that
could adversely affect us. We also may be adversely affected by changes in the enforcement or interpretation of existing statutes and
rules by governmental regulatory authorities or self-regulatory organizations.
Instability in financial markets
during and following the 2007–2009 global financial crisis led the U.S. government and foreign governments to take a number of unprecedented
actions designed to support certain financial institutions and segments of the financial markets that experienced extreme volatility,
and in some cases a lack of liquidity. While economic and financial conditions in the United States and elsewhere have been recovering
for several years, volatility remains and a perception that conditions remain fragile persists to some extent. Withdrawal of government
support or investor perception that such efforts are not succeeding could adversely affect the market value and liquidity of certain securities.
In the event of future instability
in financial markets, U.S. federal and state governments and foreign governments, their regulatory agencies or self-regulatory organizations
may take additional actions that affect the regulation of the securities in which we invest, or the issuers of such securities, in ways
that are unforeseeable and on an “emergency” basis with little or no notice, with the consequence that some market participants’
ability to continue to implement certain strategies or manage the risk of their outstanding positions may be suddenly and/or substantially
eliminated or otherwise negatively impacted. Given the complexities of the global financial markets and the limited timeframe within which
governments may be required to take action, these interventions may result in confusion and uncertainty, which in itself may be materially
detrimental to the efficient functioning of such markets as well as previously successful investment strategies.
In addition, the securities and futures
markets are subject to comprehensive statutes, regulations and margin requirements. The CFTC, the SEC, the Federal Deposit Insurance Corporation,
other regulators and self-regulatory organizations and exchanges are authorized under these statutes and regulations and otherwise to
take extraordinary actions in the event of market emergencies. We, our Adviser and our Subadviser historically have been eligible for
exemptions from certain regulations. However, there is no assurance that we, our Adviser or our Subadviser will continue to be eligible
for such exemptions.
The Dodd-Frank Wall Street Reform
and Consumer Protection Act of 2010 (the “Dodd-Frank Act”) and related regulatory developments have imposed comprehensive
new regulatory requirements on swaps and swap market participants. The new regulatory framework includes: (1) registration and regulation
of swap dealers and major swap participants; (2) requiring central clearing and execution of standardized swaps; (3) imposing margin requirements
on swap transactions; (4) regulating and monitoring swap transactions through position limits and large trader reporting requirements;
and (5) imposing record keeping and centralized and public reporting requirements, on an anonymous basis, for most swaps. The CFTC is
responsible for the regulation of most swaps and has completed most of its rules implementing the Dodd-Frank Act swap regulations. The
SEC has jurisdiction over a small segment of the market referred to as “security-based swaps,” which includes swaps on single
securities or credits, or narrow-based indices of securities or credits, but has not yet completed its rulemaking. The implementation
of the provisions of the Dodd-Frank Act by the SEC and the CFTC could adversely affect our ability to pursue our investment objective.
The Dodd-Frank Act and the rules promulgated thereunder could, among other things, adversely affect the value of our investments, restrict
our ability to engage in derivative transactions and/or increase the costs of such derivative transactions.
The CFTC and certain futures exchanges
have established limits, referred to as “position limits,” on the maximum net long or net short positions which any person
may hold or control in particular options and futures contracts; those position limits also may apply to certain other derivatives positions
we may wish to take. All positions owned or controlled by the same person or entity, even if in different accounts, may be aggregated
for purposes of determining whether the applicable position limits have been exceeded. Thus, even if we do not intend to exceed applicable
position limits, it is possible that different clients managed by our Adviser, our Subadviser and their affiliates may be aggregated for
this purpose. Therefore it is possible that the trading decisions of our Adviser or our Subadviser may have to be modified and that positions
we hold may have to be liquidated in order to avoid exceeding such limits. The modification of investment decisions or the elimination
of open positions, if it occurs, may adversely affect our performance.
Changes in U.S. social, political,
regulatory and economic conditions or in laws and policies governing foreign trade, manufacturing, development, investment and support
for clean energy initiatives, and any negative sentiments towards the United States as a result of such changes, could adversely affect
the business of the essential asset companies in which we expect to invest. In addition, reduced immigration into the United States of
educated professionals from overseas or negative sentiments towards the United States among non-U.S. employees or prospective employees
could adversely affect the ability of the companies in which we expect to invest to hire and retain highly skilled employees. Any of these
developments could have an adverse effect on the value of our investments.
The impact of continued trade tensions
with China, or an escalation to a trade war, may adversely effect currencies, commodities and individual companies in which we invest.
U.S. companies that source material and goods from China, and those that make large amounts of sales in China would be particularly vulnerable
to an escalation of trade tensions. Uncertainty regarding the outcome of the trade tensions and the potential for a trade war could cause
the dollar to decline against safe haven currencies, such as the Japanese yen and the euro.
2024 Annual Report | November
30, 2024
Additional
Information (unaudited) (continued)
Subsidiary Risks. By investing
in any Subsidiary, we will be indirectly exposed to the risks associated with such Subsidiary’s investments. The instruments that
will be held by any Subsidiary will generally be similar to those that are permitted to be held by the Fund and will be subject to the
same risks that apply to similar investments if held directly by the Fund. The Subsidiaries will not be registered under the 1940 Act,
and, unless otherwise noted, will not be subject to all of the investor protections of the 1940 Act. However, we will wholly own and control
any Subsidiary, and we and any Subsidiary will each be managed by our Adviser or our Subadviser and will share the same portfolio management
teams. Our Board of Directors will have oversight responsibility for the investment activities of the Fund, including its investment in
the Subsidiaries, and our role as sole shareholder of any Subsidiary. Changes in the laws of the United States and/or any jurisdiction
in which a Subsidiary is formed could result in our inability or the inability of the Subsidiaries to operate as expected and could adversely
affect the Fund. For example, changes in U.S. tax laws could affect the U.S. tax treatment of, or consequences of owning, the Fund or
the Subsidiaries, including under the RIC rules.
Segregation and Coverage Risks.
Certain portfolio management techniques, such as, among other things, entering into swap agreements, using reverse repurchase agreements,
futures contracts or other derivative transactions, may be considered senior securities under the 1940 Act unless steps are taken to segregate
our assets or otherwise cover our obligations. To avoid having these instruments considered senior securities, we segregate liquid assets
with a value equal (on a mark-to-market basis) to our obligations under these types of transactions, enter into offsetting transactions
or otherwise cover such transactions. In cases where we do not follow such procedures, such instruments may be considered senior securities
and our use of such transactions will be required to comply with the restrictions on senior securities under the 1940 Act. We may be unable
to use segregated assets for certain other purposes, which could result in us earning a lower return on our portfolio than we might otherwise
earn if we did not have to segregate those assets in respect of or otherwise cover such portfolio positions. To the extent our assets
are segregated or committed as cover, it could limit our investment flexibility. Segregating assets and covering positions will not limit
or offset losses on related positions. Limitations on Transactions with Affiliates Risk. The 1940 Act limits our ability to enter into
certain transactions with certain of our affiliates. As a result of these restrictions, we may be prohibited from buying or selling any
security directly from or to any portfolio company that is considered our affiliate under the 1940 Act. However, we may under certain
circumstances purchase any such portfolio company’s securities in the secondary market, which could create a conflict for our Adviser
or Subadviser between our interests and the interests of the portfolio company, in that the ability of our Adviser or Subadviser, as applicable,
to recommend actions in our best interests might be impaired.
The 1940 Act also prohibits certain
“joint” transactions with certain of our affiliates, including Other Tortoise Accounts, which could include investments in
the same issuer (whether at the same or different times). To the extent there is a joint transaction among us and Other Tortoise Accounts
requiring exemptive relief, we may rely on an exemptive order from the SEC obtained by the Adviser and certain Other Tortoise Accounts
that permits us, among other things, to co-invest with certain other persons, including certain Other Tortoise Accounts, subject to certain
terms and conditions. Such relief may not cover all circumstances and we may be precluded from participating in certain transactions due
to regulatory restrictions on transactions with affiliates. Anti-Takeover Provisions Risks. Our Declaration of Trust and Bylaws include
provisions that could delay, defer or prevent other entities or persons from acquiring control of us, causing us to engage in certain
transactions or modify our structure. These provisions may be regarded as “anti-takeover” provisions. Such provisions could
limit the ability of common shareholders to sell their shares at a premium over the then-current market prices by discouraging a third
party from seeking to obtain control of us.
Office
of the Company
and of the Investment Adviser
Tortoise
Capital Advisors, L.L.C.
5901 College Boulevard, Suite 400
Overland Park, KS 66211
(913) 981-1020
(913) 981-1021 (fax)
www.tortoiseadvisors.com
Board
of Directors of
Tortoise Energy Infrastructure Corp.
Tortoise Midstream Energy Fund, Inc.
Tortoise Pipeline & Energy Fund, Inc.
Tortoise Power and Energy Infrastructure Fund, Inc.
Tortoise Sustainable and Social Impact Term Fund
H.
Kevin Birzer, Chairman
Tortoise Capital Advisors, L.L.C.
Rand
C. Berney
Independent
Conrad
S. Ciccotello
Independent
Alexandra
Herger
Independent
Tortoise
Energy Independence Fund, Inc.
H.
Kevin Birzer, Chairman
Tortoise Capital Advisors, L.L.C.
Conrad
S. Ciccotello
Independent
Alexandra
Herger
Independent
Gabriel
Gliksberg
Independent |
Administrator
U.S.
Bancorp Fund Services, LLC
615 East Michigan St.
Milwaukee, Wis. 53202
Custodian
U.S.
Bank, N.A.
1555 North Rivercenter Drive, Suite 302
Milwaukee, Wis. 53212
Transfer,
Dividend Disbursing
and Reinvestment Agent
Computershare
Trust Company, N.A. /
Computershare Inc.
P.O. Box 30170
College Station, Tex. 77842-3170
(800) 426-5523
www.computershare.com
Legal
Counsel
Husch
Blackwell LLP
4801 Main St.
Kansas City, Mo. 64112
Investor
Relations
(866)
362-9331
info@tortoiseadvisors.com
Stock
Symbols
Listed
NYSE Symbols: TYG, NTG, TTP, NDP, TPZ, TEAF
This
report is for stockholder information. This is not a prospectus intended for use in the purchase or sale of fund shares. Past
performance is no guarantee of future results and your investment may be worth more or less at the time you sell. |

5901 College Boulevard, Suite 400
Overland Park, KS 66211
www.tortoiseadvisors.com
(b) Not applicable.
Item 2. Code of Ethics.
The Registrant has adopted a code of
ethics that applies to the Registrant’s Principal Executive Officer and its Principal Financial Officer. The Registrant has made
only administrative/clerical changes to its code of ethics during the period covered by this report to reflect a change in the name of
the Principal Executive Officer and the Principal Financial
Officer. The Registrant has not granted any waivers from any provisions of this code of ethics during the period covered by this report.
Item 3. Audit Committee Financial Expert.
The Registrant’s Board of Directors has determined that there is
at least one “audit committee financial expert” serving on its audit committee. Mr. Rand Berney is the “audit committee
financial expert” and is considered to be “independent” as each term is defined in Item 3 of Form N-CSR.
Item 4. Principal Accountant Fees and Services.
(a) - (d) The Registrant has engaged its principal
accountant to perform audit services, audit-related services and tax services during the past two fiscal years. “Audit services”
refer to performing an audit of the Registrant's annual financial statements or services that are normally provided by the accountant
in connection with statutory and regulatory filings or engagements for those fiscal years. “Audit-related services”
refer to the assurance and related services by the principal accountant that are reasonably related to the performance of the audit.
“Tax services” refer to professional services rendered by the principal accountant for tax compliance (including preparation
of tax returns), tax advice, and tax planning. The following table details the approximate amounts of aggregate fees billed to the
Registrant for the last two fiscal years for audit fees, audit-related fees, tax fees and other fees by the principal accountant.
| |
FYE 11/30/2024 |
FYE 11/30/2023 |
| Audit Fees |
$98,611 |
$79,710 |
| Audit-Related Fees |
— |
— |
| Tax Fees |
$23,353 |
$22,005 |
| All Other Fees |
— |
— |
(e)(1) The audit committee has adopted pre-approval
policies and procedures that require the audit committee to pre-approve (i) the selection of the Registrant’s independent registered
public accounting firm, (ii) the engagement of the independent registered public accounting firm to provide any non-audit services to
the Registrant, (iii) the engagement of the independent registered public accounting firm to provide any non-audit services to the Adviser
or any entity controlling, controlled by, or under common control with the Adviser that provides ongoing services to the Registrant, if
the engagement relates directly to the operations and financial reporting of the Registrant, and (iv) the fees and other compensation
to be paid to the independent registered public accounting firm. The Chairman of the audit committee may grant the pre-approval of any
engagement of the independent registered public accounting firm for non-audit services of less than $10,000, and such delegated pre-approvals
will be presented to the full audit committee
at its next meeting. Under certain limited circumstances,
pre-approvals are not required under securities law regulations for certain non-audit services below certain de minimis thresholds. Since
the adoption of these policies and procedures, the audit committee has pre-approved all audit and non-audit services provided to the Registrant
by the principal accountant.
(e)(2) None of these services provided by the principal
accountant were approved by the audit committee pursuant to the de minimis exception under Rule 2.01(c)(7)(i)(C) or Rule 2.01(c)(7)(ii)
of Regulation S-X.
(f) All of the principal accountant’s hours
spent on auditing the Registrant’s financial statements were attributed to work performed by full-time permanent employees of the
principal accountant.
(g) In the Registrant’s fiscal years ended November 30, 2024, and
2023, the Adviser was billed approximately $35,300 and $33,850 in fees, respectively, for tax and other non-audit services provided to
the Adviser. In the Registrant’s fiscal year ended November 30, 2024, and fiscal year ended November 30, 2023, the aggregate non-audit fees billed
by the registrant’s accountant for services rendered to the registrant was $23,353 and $22,005, respectively. In the Registrant’s fiscal year ended November 30, 2024, and fiscal year ended November 30, 2023,
the aggregate non-audit fees billed by the registrant’s accountant for services rendered to the registrant, and rendered to the
registrant’s Adviser, and any entity controlling, controlled by, or under common control with the Adviser that provides ongoing
services to the registrant was $58,653 and $55,855, respectively.
(h) The audit committee has considered whether the
principal accountant’s provision of services (other than audit services) to the Registrant, the Adviser or any entity controlling,
controlled by, or under common control with the Adviser that provides services to the Registrant is compatible with maintaining the principal
accountant’s independence in performing audit services.
(i) - (j) Not applicable.
Item 5. Audit Committee of Listed Registrants.
The Registrant has a separately-designated standing
audit committee established in accordance with Section 3(a)(58)(A) of the Securities Exchange Act of 1934, and is comprised of Mr. Rand
C. Berney, Mr. Conrad S. Ciccotello, and Ms. Alexandra A. Herger.
Item 6. Investments.
| (a) | Schedule of Investments is included as part of the report to shareholders filed under Item 1. |
Item 7. Financial Statements and Financial Highlights
for Open-End Management Investment Companies.
Not applicable to closed-end investment companies.
Item 8. Changes in and Disagreements with Accountants
for Open-End Management Investment Companies.
Not applicable to closed-end investment companies.
Item 9. Proxy Disclosures for Open-End Management
Investment Companies.
Not applicable to closed-end investment companies.
Item 10. Remuneration Paid to Directors, Officers,
and Others of Open-End Management Investment Companies.
Not applicable to closed-end investment companies.
Item 11. Statement Regarding Basis for Approval
of Investment Advisory Contract.
A discussion of the material factors and the conclusions with respect to
the board of directors’ approval of the continuation of the Registrant’s investment management agreement is included in the
Registrant’s annual report to stockholders for the year ended November 30, 2024.
Item 12. Disclosure of Proxy Voting Policies
and Procedures for Closed-End Management Investment Companies.
Copies of the proxy voting policies and procedures
of the Registrant and the Adviser are attached hereto as Exhibit 99.VOTEREG and Exhibit 99.VOTEADV, respectively.
Item 13. Portfolio Managers of Closed-End Management Investment Companies.
Unless otherwise indicated, information is presented
as of November 30, 2024.
Portfolio Managers
As of the date of this filing, primary responsibility
for the day-to-day management of the Registrant’s portfolio is the joint responsibility of a team of portfolio managers consisting
of Brian A. Kessens, James R. Mick, Matthew G.P. Sallee, Robert J. Thummel, Jr. Biographical information about each portfolio manager
named above as of the date of this filing is set forth below.
| Name and Address* |
Position(s) Held with Company and Length of Time Served |
Principal Occupation During Past Five Years |
|
Brian A. Kessens |
President since June 2015 |
Managing Director of the Adviser since January 2015 and a member of the Investment Committee of the Adviser since June 30, 2015; Senior Portfolio Manager of the Adviser since February 2019; Portfolio Manager of the Adviser from July 2013 to January 2019; CFA designation since 2006. |
|
James R. Mick |
N/A |
Managing Director of the Adviser since January 2014 and a member of the Investment Committee of the Adviser since June 30, 2015; Portfolio Manager of the Adviser since July 2013; Senior Investment Analyst of the Adviser from June 2012 to July 2013; Investment Analyst of the Adviser from 2011 to June 2012; Research analyst of the Adviser from 2006 to 2011. CFA designation since 2010. |
|
Matthew G.P. Sallee |
Chief Executive Officer since June 2024 |
Managing Director of the Adviser since January 2014 and a member of the Investment Committee of the Adviser since June 30, 2015; Senior Portfolio Manager of the Adviser since February 2019; Portfolio Manager of the Adviser from July 2013 to January 2019; CFA designation since 2009. |
|
Robert J. Thummel, Jr. |
N/A |
Managing Director of the Adviser since January 2014 and a member of the Investment Committee of the Adviser since June 30, 2015; Senior Portfolio Manager of the Adviser since February 2019; Portfolio Manager of the Adviser from July 2013 to January 2019. |
*The address of each portfolio manager is 4901 College
Boulevard, Suite 400, Overland Park, Kansas 66211.
The Adviser also serves as the investment adviser
to Tortoise Energy Infrastructure Corporation, Tortoise Sustainable and Social Impact Term Fund and, until their respective mergers in December 2024, served as investment adviser to Tortoise Midstream Energy Fund, Inc., Tortoise
Energy Independence Fund, Inc., and Tortoise Power and Energy Infrastructure Fund, Inc.
The following
table provides information about the other accounts managed on a day-to-day basis by each of the portfolio managers as of November 30,
2024:
|
Name of Manager |
Number of
Accounts |
Total Assets of
Accounts |
Number of
Accounts
Paying a
Performance
Fee |
Total Assets of
Accounts Paying
a Performance
Fee |
| Brian A. Kessens |
|
|
|
|
| Registered investment companies |
7 |
$5,216,137,457 |
- |
- |
| Other pooled investment vehicles |
2 |
$82,307,429 |
- |
- |
| Other accounts |
336 |
$3,443,033,131 |
8 |
$1,237,221,763 |
| James R. Mick |
|
|
|
|
| Registered investment companies |
7 |
$5,216,137,457 |
- |
- |
| Other pooled investment vehicles |
2 |
$82,307,429 |
- |
- |
| Other accounts |
336 |
$3,443,033,131 |
8 |
$1,237,221,763 |
| Matthew G.P. Sallee |
|
|
|
|
| Registered investment companies |
7 |
$5,216,137,457 |
- |
- |
| Other pooled investment vehicles |
2 |
$82,307,429 |
- |
- |
| Other accounts |
336 |
$3,443,033,131 |
8 |
$1,237,221,763 |
| Robert J. Thummel, Jr. |
|
|
|
|
| Registered investment companies |
7 |
$5,216,137,457 |
- |
- |
| Other pooled investment vehicles |
2 |
$82,307,429 |
- |
- |
| Other accounts |
336 |
$3,443,033,131 |
8 |
$1,237,221,763 |
Material Conflicts of Interest
Conflicts of interest may arise from the fact that
the Adviser and its affiliates carry on substantial investment activities for other clients, in which the Registrant has no interest,
some of which may have investment strategies similar to the Registrant. In addition, conflicts of interest may arise from the fact that
a related person of the Adviser has an interest in a limited liability company client, similar to a general partner interest in a partnership,
for which the Adviser also serves as manager. The Adviser or its affiliates may have financial incentives to favor certain of these accounts
over the Registrant. For example, the Adviser may have an incentive to allocate potentially more favorable investment opportunities to
other funds and clients that pay the Adviser an incentive or performance fee. Performance and incentive fees also create the
incentive to allocate potentially riskier, but potentially better performing, investments to such funds and
other clients in an effort to increase the incentive
fee. The Adviser also may have an incentive to make investments in one fund, having the effect of increasing the value of a
security in the same issuer held by another fund or client, which in turn, may result in an incentive fee being paid to the Adviser by
that other fund or client. Any of the Adviser’s or its affiliates’ proprietary accounts or other customer accounts may compete
with the Registrant for specific trades. The Adviser or its affiliates may give advice and recommend securities to, or buy or sell securities
for, other accounts and customers, which advice or securities recommended may differ from advice given to, or securities recommended or
bought or sold for, the Registrant, even though their investment objectives may be the same as, or similar to, the Registrant’s
objectives. The Adviser has written allocation policies and procedures designed to address potential conflicts of interest. For instance,
when two or more clients advised by the Adviser or its affiliates seek to purchase or sell the same publicly traded securities, the securities
actually purchased or sold will be allocated among the clients on a good faith equitable basis by the Adviser in its discretion and in
accordance with the clients’ various investment objectives and the Adviser’s procedures. In some cases, this system may adversely
affect the price or size of the position the Registrant may obtain or sell. In other cases, the Registrant’s ability to participate
in volume transactions may produce better execution for it. When possible, the Adviser combines all of the trade orders into one or more
block orders, and each account participates at the average unit or share price obtained in a block order. When block orders are only partially
filled, the Adviser considers a number of factors in determining how allocations are made, with the overall goal to allocate in a manner
so that accounts are not preferred or disadvantaged over time. The Adviser also has allocation policies for transactions involving private
placement securities, which are designed to result in a fair and equitable participation in offerings or sales for each participating
client.
As of the date of this filing, the Adviser also serves as investment adviser for one other publicly traded closed-end management investment
company which invests in the energy sector.
The Adviser will evaluate a variety of factors in
determining whether a particular investment opportunity or strategy is appropriate and feasible for the relevant account at a particular
time, including, but not limited to, the following: (1) the nature of the investment opportunity taken in the context of the other investments
at the time; (2) the liquidity of the investment relative to the needs of the particular entity or account; (3) the availability of the
opportunity (i.e., size of obtainable position); (4) the transaction costs involved; and (5) the investment or regulatory limitations
applicable to the particular entity or account. Because these considerations may differ when applied to the Registrant and relevant accounts
under management in the context of any particular investment opportunity, the Registrant’s investment activities, on the one hand,
and other managed accounts, on the other hand, may differ considerably from time to time. In addition, the Registrant’s fees and
expenses will differ from those of the other managed accounts. Accordingly, stockholders should be aware that the Registrant’s future
performance and the future performance of the other accounts of the Adviser may vary.
From time to
time, the Adviser may seed proprietary accounts for the purpose of evaluating a new investment strategy that eventually may be available
to clients through one or more product structures. Such accounts also may serve the purpose of establishing a performance record for the
strategy. The Adviser’s management of accounts with proprietary interests and nonproprietary client accounts may create an incentive
to favor the proprietary accounts in the allocation of investment opportunities, and the timing and aggregation of investments. The Adviser’s
proprietary seed accounts may include long-short strategies, and certain client strategies may permit short sales. A conflict of interest
arises if a security is sold short at the same time as a long position, and continuously short selling in a security may adversely affect
the stock price of the same security held long in client accounts. The Adviser has adopted various policies to mitigate these conflicts,
including policies that require the Adviser to avoid favoring any account, and that prohibit client and proprietary accounts from engaging
in short sales with respect to individual stocks held long in client accounts. The Adviser’s policies also require transactions
in proprietary accounts to be placed after client transactions.
Situations may occur when the Registrant could be
disadvantaged because of the investment activities conducted by the Adviser and its affiliates for their other accounts. Such situations
may be based on, among other things, the following: (1) legal or internal restrictions on the combined size of positions that may be taken
for the Registrant or the other accounts, thereby limiting the size of the Registrant’s position; (2) the difficulty of liquidating
an investment for the Registrant or the other accounts where the market cannot absorb the sale of the combined position; or (3) limits
on co-investing in negotiated transactions under the Investment Company Act of 1940.
The 1940 Act limits our ability to co-invest in negotiated
private placements of securities with our affiliates, including other funds managed by the Adviser. We and our Adviser have received exemptive
relief from the SEC that permits certain co-investment transactions. In this regard, our Adviser has the ability to allocate investment
opportunities of certain negotiated transactions between us, other funds registered under the 1940 Act and other accounts managed by our
Adviser pro rata based on available capital, up to the amount proposed to be invested by each. All accounts generally are required to
participate on the same terms. Pursuant to the exemptive order, our Adviser will be required to provide the board of directors of each
participating registered fund with certain information concerning the relevant investment. A majority (as defined in section 57(o)
of the 1940 Act) of the directors eligible to consider the co-investment transaction of each participating registered fund must approve
such registered fund’s participation in the co-investment transaction.
To the extent that the Adviser sources and structures
private investments, certain employees of the Adviser may become aware of actions planned by such companies, such as acquisitions, which
may not be announced to the public. It is possible that the Registrant could be precluded from investing in or selling securities
of or related to companies about which the Adviser has material, non-public information; however, it is the Adviser’s intention
to ensure that any material, non-public information available to certain employees of the Adviser is not shared with the employees responsible
for the purchase and sale of publicly traded company securities or to confirm prior to receipt of any material non-public information
that the information will shortly be made public. The Registrant’s investment opportunities also may be limited by affiliations
of the Adviser or its affiliates with energy infrastructure companies.
The Adviser and its principals, officers, employees,
and affiliates may buy and sell securities or other investments for their own accounts and may have actual or potential conflicts of interest
with respect to investments made on the Registrant’s behalf. As a result of differing trading and investment strategies
or constraints, positions may be taken by principals, officers, employees, and affiliates of the Adviser that are the same as, different
from, or made at a different time than positions taken for the Registrant. Further, the Adviser may at some time in the future,
manage additional investment funds with the same investment objective as the Registrant’s.
Compensation
None of Messrs. Kessens,
Mick, Sallee, or Thummel receives any direct compensation from the Registrant or any other of the managed accounts reflected in the table
above. All such accounts are managed by the Adviser. Each of Messrs. Kessens, Mick, Sallee, and Thummel has entered into an employment
agreement with the Adviser. Under these employment-related contracts, they receive base compensation and are eligible for an annual discretionary
cash bonus based on the Adviser’s earnings and the satisfaction of certain other conditions. Additional benefits received by Messrs. Kessens, Mick, Sallee, and Thummel are normal and customary employee benefits generally
available to all full-time employees. Each of Messrs. Kessens,
Mick, Sallee, Thummel owns
an equity interest in Tortoise Parent Holdco LLC, that indirectly wholly owns the Adviser, and each thus benefits from increases in the net income
of the organization.
Securities Owned in the Registrant by Portfolio
Managers
The following table provides information about the
dollar range of equity securities in the Registrant beneficially owned by each of the portfolio managers as of November 30, 2024:
| Portfolio Manager |
Aggregate Dollar Range of
Holdings in the Registrant |
| |
|
| Brian A. Kessens |
$10,001 - $50,000 |
| James R. Mick |
$10,001 - $50,000 |
| Matthew G.P. Sallee |
$10,001 - $50,000 |
| Robert J. Thummel, Jr. |
$1 - $10,000 |
Item 14. Purchases of Equity Securities by Closed-End
Management Investment Company and Affiliated Purchasers.
| Period |
(a)
Total Number of
Shares (or Units)
Purchased |
(b)
Average Price Paid
per Share (or Unit) |
(c)
Total Number of
Shares (or Units)
Purchased as Part of
Publicly Announced
Plans or Programs |
(d)
Maximum Number (or
Approximate Dollar
Value) of Shares (or
Units) that May Yet
Be Purchased Under
the Plans or Programs |
Month #1
6/1/24-6/30/24 |
0 |
$0 |
0 |
$0 |
Month #2
7/1/24-7/31/24 |
0 |
$0 |
0 |
$0 |
Month #3
8/1/24-8/31/24 |
0 |
$0 |
0 |
$0 |
Month #4
9/1/24-9/30/24 |
0 |
$0 |
0 |
$0 |
Month #5
10/1/24-10/31/24 |
0 |
$0 |
0 |
$0 |
Month #6
11/1/24-11/30/24 |
0 |
$0 |
0 |
$0 |
| Total |
0 |
$0 |
0 |
$0 |
Item 15. Submission of Matters to a Vote of Security Holders.
None.
Item 16. Controls and Procedures.
(a)
The Registrant’s Chief Executive Officer, and its Principal Financial Officer and Treasurer have concluded that the
Registrant's disclosure controls and procedures (as defined in Rule 30a-3(c) under the Investment Company Act of 1940, as amended
(the “1940 Act”) (17 CFR 270.30a-3(c))) are
effective, as of a date within 90 days of the filing date of this report that includes the disclosure required by this paragraph,
based on the evaluation of these controls and procedures required by Rule 30a-3(b) under the 1940 Act (17
CFR 270.30a-3(b)) and Rules 13a-15(b) or 15d-15(b) under the Securities Exchange Act of 1934, as
amended (the “Exchange Act”) (17 CFR 240.13a-15(b) or 240.15d-15(b)).
(b) There were no changes in the Registrant’s internal control over financial reporting (as defined in Rule 30a-3(d) under the 1940 Act (17 CFR 270.30a-3(d)) that occurred during the period covered by this report that have materially affected, or are reasonably likely to materially affect, the Registrant’s internal control over financial reporting.
Item 17. Disclosure of Securities Lending Activities
For Closed-End Management Investment Companies.
The Registrant does not participate in securities
lending activities.
Item 18. Recovery of Erroneously Awarded Compensation.
Not applicable.
Item 19. Exhibits.
(a)(1) Any code of ethics or amendment thereto, that is the subject of the disclosure required by Item 2, to the extent that the Registrant intends to satisfy Item 2 requirements through filing of an exhibit. Filed herewith.
(2) Any policy required
by the listing standards adopted pursuant to Rule 10D-1 under the Securities Exchange Act of 1934 (the “Exchange Act”) by
the registered national securities exchange or registered national securities association upon which the Registrant's securities are
listed.
Not applicable - no officers of the Registrant are compensated by the Registrant.
(3) A separate certification for each principal executive and principal financial officer of the Registrant as required by Rule 30a-2(a) under the Investment Company Act of 1940 (the “Act”). Filed herewith.
(4) Any written solicitation to purchase
securities under Rule 23c-1 under the Act sent or given during the period covered by the report by or on behalf of the Registrant to
10 or more persons. None.
(5) Change in the
Registrant's independent public accountant.
Not applicable.
(b) Certifications required by Rule 30a-2(b) under the Act, Rule 13a-14(b) or Rule 15d-14(b) under the Exchange Act, and Section 1350 of Chapter 63 of Title 18 of the United States Code. Furnished herewith.
(c) Notices to the Registrant’s common shareholders in accordance with an order under Section 6(c) of the 1940 Act granting an exemption from Section 19(b) of the 1940 Act and Rule 19b-1 under the 1940 Act, dated September 12, 20111
1 The Registrant is relying on exemptive relief from the
Securities and Exchange Commission permitting it to make periodic distributions of long-term capital gains with respect to its outstanding
common shares as frequently as twelve times each year. This relief is conditioned, in part, on Registrant making the disclosures to the
holders of the Registrant’s common shares, in addition to the information required by Section 19(a) of the 1940 Act and Rule 19a-1
thereunder. The Registrant is likewise obligated to file with the Commission the information contained in any such notice to shareholders
and, in that regard, has attached hereto copies of each such notice made during the period.
SIGNATURES
Pursuant to the requirements of the Securities Exchange Act of 1934 and the Investment Company Act of 1940, the Registrant has duly caused
this report to be signed on its behalf by the undersigned, thereunto duly authorized.
| (Registrant) |
Tortoise Pipeline & Energy Fund, Inc. |
| |
|
| By (Signature and Title) |
/s/ Matthew G.P. Sallee |
| |
Matthew G.P. Sallee, Chief Executive Officer |
Date February 7, 2025
Pursuant to the requirements of the Securities Exchange Act of 1934 and the Investment Company Act of 1940, this report has been signed
below by the following persons on behalf of the Registrant and in the capacities and on the dates indicated.
| By (Signature and Title) |
/s/ Matthew G.P. Sallee |
| |
Matthew G.P. Sallee, Chief Executive Officer |
Date February 7, 2025
| By (Signature and Title) |
/s/ Sean Wickliffe |
| |
Sean Wickliffe, Principal Financial Officer and Treasurer |
Date February 7, 2025
EX-99.CERT
CERTIFICATIONS
I, Matthew G.P. Sallee, certify that:
1. I have reviewed this report on Form N-CSR of Tortoise Pipeline &
Energy Fund, Inc.;
2. Based on my knowledge, this report does not contain any untrue
statement of a material fact or omit to state a material fact necessary to make the statements made, in light of the circumstances under
which such statements were made, not misleading with respect to the period covered by this report;
3. Based on my knowledge, the financial statements, and other financial
information included in this report, fairly present in all material respects the financial condition, results of operations, changes in
net assets, and cash flows (if the financial statements are required to include a statement of cash flows) of the registrant as of, and
for, the periods presented in this report;
4. The registrant's other certifying officer(s) and I are responsible
for establishing and maintaining disclosure controls and procedures (as defined in Rule 30a-3(c) under the Investment Company Act of 1940)
and internal control over financial reporting (as defined in Rule 30a-3(d) under the Investment Company Act of 1940) for the registrant
and have:
(a) Designed such disclosure controls and procedures, or caused
such disclosure controls and procedures to be designed under our supervision, to ensure that material information relating to the registrant,
including its consolidated subsidiaries, is made known to us by others within those entities, particularly during the period in which
this report is being prepared;
(b) Designed such internal control over financial reporting,
or caused such internal control over financial reporting to be designed under our supervision, to provide reasonable assurance regarding
the reliability of financial reporting and the preparation of financial statements for external purposes in accordance with generally
accepted accounting principles;
(c) Evaluated the effectiveness of the registrant's disclosure
controls and procedures and presented in this report our conclusions about the effectiveness of the disclosure controls and procedures,
as of a date within 90 days prior to the filing date of this report based on such evaluation; and
(d) Disclosed in this report any change in the registrant’s
internal control over financial reporting that occurred during the period covered by this report that has materially affected, or is reasonably
likely to materially affect, the registrant’s internal control over financial reporting; and
5. The registrant's other certifying officer(s) and I have disclosed
to the registrant's auditors and the audit committee of the registrant's board of directors (or persons performing the equivalent functions):
(a) All significant deficiencies and material weaknesses in
the design or operation of internal control over financial reporting which are reasonably likely to adversely affect the registrant's
ability to record, process, summarize, and report financial information; and
(b) Any fraud, whether or not material, that involves management
or other employees who have a significant role in the registrant's internal control over financial reporting.
| Date: February 7, 2025 |
|
/s/ Matthew G.P. Sallee |
|
| |
|
Matthew G.P. Sallee
Chief Executive Officer |
|
EX-99.CERT
CERTIFICATIONS
I, Sean Wickliffe, certify that:
1. I have reviewed this report on Form N-CSR of Tortoise Pipeline &
Energy Fund, Inc.;
2. Based on my knowledge, this report does not contain any untrue
statement of a material fact or omit to state a material fact necessary to make the statements made, in light of the circumstances under
which such statements were made, not misleading with respect to the period covered by this report;
3. Based on my knowledge, the financial statements, and other financial
information included in this report, fairly present in all material respects the financial condition, results of operations, changes in
net assets, and cash flows (if the financial statements are required to include a statement of cash flows) of the registrant as of, and
for, the periods presented in this report;
4. The registrant's other certifying officer(s) and I are responsible
for establishing and maintaining disclosure controls and procedures (as defined in Rule 30a-3(c) under the Investment Company Act of 1940)
and internal control over financial reporting (as defined in Rule 30a-3(d) under the Investment Company Act of 1940) for the registrant
and have:
(a) Designed such disclosure controls and procedures, or caused
such disclosure controls and procedures to be designed under our supervision, to ensure that material information relating to the registrant,
including its consolidated subsidiaries, is made known to us by others within those entities, particularly during the period in which
this report is being prepared;
(b) Designed such internal control over financial reporting,
or caused such internal control over financial reporting to be designed under our supervision, to provide reasonable assurance regarding
the reliability of financial reporting and the preparation of financial statements for external purposes in accordance with generally
accepted accounting principles;
(c) Evaluated the effectiveness of the registrant's disclosure
controls and procedures and presented in this report our conclusions about the effectiveness of the disclosure controls and procedures,
as of a date within 90 days prior to the filing date of this report based on such evaluation; and
(d) Disclosed in this report any change in the registrant’s
internal control over financial reporting that occurred during the period covered by this report that has materially affected, or is reasonably
likely to materially affect, the registrant’s internal control over financial reporting; and
5. The registrant's other certifying officer(s) and I have disclosed
to the registrant's auditors and the audit committee of the registrant's board of directors (or persons performing the equivalent functions):
(a) All significant deficiencies and material weaknesses in
the design or operation of internal control over financial reporting which are reasonably likely to adversely affect the registrant's
ability to record, process, summarize, and report financial information; and
(b) Any fraud, whether or not material, that involves management
or other employees who have a significant role in the registrant's internal control over financial reporting.
| Date: February 7, 2025 |
|
/s/ Sean Wickliffe |
|
| |
|
Sean Wickliffe
Principal Financial Officer and Treasurer |
|
EX-99.906CERT
Certification Pursuant to Section 906 of the
Sarbanes-Oxley Act
Pursuant to Section 906 of the Sarbanes-Oxley Act of 2002, the undersigned
officer of Tortoise Pipeline & Energy Fund, Inc. does hereby certify, to such officer’s knowledge, that the report on Form N-CSR
of Tortoise Pipeline & Energy Fund, Inc. for the year ended November 30, 2024 fully complies with the requirements of Section 13(a)
or 15(d) of the Securities Exchange Act of 1934, as applicable, and that the information contained in the Form N-CSR fairly presents,
in all material respects, the financial condition and results of operations of Tortoise Pipeline & Energy Fund, Inc. for the stated
period.
| /s/ Matthew G.P. Sallee |
|
| Matthew G.P. Sallee |
|
| Chief Executive Officer |
|
| Tortoise Pipeline & Energy Fund, Inc. |
|
| |
|
| Dated: February 7, 2024 |
|
| |
|
| /s/ Sean Wickliffe |
|
| Sean Wickliffe |
|
| Principal Financial Officer and Treasurer |
|
| Tortoise Pipeline & Energy Fund, Inc. |
|
| |
|
| Dated: February 7, 2024 |
|
This certification is being furnished pursuant to Item 13(b) of Form
N-CSR and Section 906 of the Sarbanes-Oxley Act of 2002 and shall not be deemed filed by Tortoise Pipeline & Energy Fund, Inc. for
purposes of Section 18 of the Securities Exchange Act of 1934.
EX-99.CODE
ETH
TORTOISE PIPELINE & ENERGY FUND, INC.
CODE OF
ETHICS FOR principal executive officer and
PRINCIPAL FINANCIAL OFFICER (“Officer code”)
Tortoise Pipeline & Energy Fund, Inc. (the “Company”) requires
the Principal Executive Officer, Principal Financial Officer or other Company Officer performing similar functions as set forth in Exhibit A
(“Covered Officers”) to maintain the highest ethical and legal standards while performing their duties and responsibilities
to the Company, with particular emphasis on those duties that relate to the preparation and reporting of financial information of the
Company. The following overriding principles govern the conduct of Covered Officers:
| · | Covered Officers shall act with honesty
and integrity, avoiding actual or apparent conflicts of interest between personal and professional relationships and shall promptly report
any potential conflicts. |
| · | Covered Officers shall not use their
personal influence or personal relationships improperly to influence investment decisions or financial reporting by the Company whereby
the Covered Officer would benefit personally to the detriment of the Company or take action, or fail to take action, for the individual
personal benefit of the Covered Officer rather than the benefit of the Company. |
| · | Covered Officers shall promote full,
fair, accurate, timely and understandable disclosure in reports and documents that the Company files with, or submits to, the Securities
and Exchange Commission (“SEC”) and in other public communications made by the Company and that are within the Covered Officer’s
responsibility. |
| · | Covered Officers shall promote compliance
with applicable laws and governmental rules and regulations. |
| · | Covered Officers shall promptly report
violations of this Code. |
Covered Officers are reminded
of their obligations under the code of ethics of the Company and Tortoise Capital Advisors, LLC adopted under Rule 17j-l of the Investment
Company Act of 1940, as amended (the “1940 Act”). The obligations under that code apply independently of this Officer Code
and are not a part of this Officer Code.
Overview. Each Covered
Officer should adhere to a high standard of business ethics and should be sensitive to and seek to avoid situations that may give rise
to actual as well as apparent conflicts of interest. A “conflict of interest” occurs when a Covered Officer’s other
interests interfere with the interests of, or his or her service to, the Company. For example, a conflict of interest would arise if a
Covered Officer, or a member of his or her family, receives improper personal benefits as a result of his or her position with the Company.
Certain conflicts of interest
arise out of the relationships between Covered Officers and the Company and already are subject to conflict of interest provisions in
the 1940 Act and the Investment Advisers Act of 1940, as amended (the “Advisers Act”). For example, Covered Officers may not
individually engage in certain transactions (such as the purchase or sale of securities or other property) with the Company because of
their status as “affiliated persons” of the Company. The Company and its investment adviser have adopted compliance programs
and procedures designed to prevent, or identify and correct, violations of these provisions. This Officer Code does not, and is not intended
to, duplicate or replace these programs and procedures, and such conflicts fall outside of the parameters of this Officer Code.
Although typically not presenting
an opportunity for improper personal benefit, conflicts arise from, or as a result of, the contractual relationships between the Company
and the investment adviser of which the Covered Officers are also officers or employees. As a result, this Officer Code recognizes that
Covered Officers will, in the normal course of their duties (whether formally for the Company or for the investment adviser, or for both),
be involved in establishing policies and implementing decisions that will have different effects on the adviser and the Company. The participation
of the Covered Officers in such activities is inherent in the contractual relationship between the Company and the investment adviser
and is consistent with the performance by the Covered Officers of their duties as officers of the Company. Thus, if performed in conformity
with the provisions of the 1940 Act and the Advisers Act, such activities will be deemed to have been handled ethically.
Other conflicts of interest
are covered by this Officer Code, even if such conflicts of interest are not subject to provisions in the 1940 Act and the Advisers Act.
The following list provides examples of conflicts of interest under this Officer Code, but Covered Officers should keep in mind that these
examples are not exhaustive.
Disclosure of Potential
Conflicts. Each Covered Officer shall provide prompt and full disclosure to the Code Compliance Officer (as defined below), in writing,
prior to entering into any material transaction or relationship which may reasonably be expected to give rise to a conflict (other than
conflicts arising from the advisory relationship). This includes, but is not limited to, the following:
| · | service as a director, officer, partner, consultant or in any other key role with any company with which
the Company has current or prospective business dealings; |
| · | the receipt by a Covered Officer and
his or her family members of any gifts from any company with which the Company has current or prospective business dealings if it influences
or gives the appearance of influencing the recipient; |
| · | the receipt of customary business
amenities from any company with which the Company has current or prospective business dealings unless such amenity is business-related,
reasonable in cost, appropriate as to time and place, and neither so frequent nor so costly as to raise any question of impropriety; |
| · | any ownership by a Covered Officer
and his or her family members of significant financial interest in any company with which the Company has current or prospective business
dealings, other than its investment adviser, principal underwriter, transfer agent or any affiliated person thereof; and |
| · | a direct or indirect financial interest
in commissions, transaction charges or spreads paid by the Company for effecting portfolio transactions or for selling or redeeming shares
other than an interest arising from the Covered Officer’s employment, such as compensation or equity ownership. |
| DISCLOSURE AND COMPLIANCE |
| · | Each Covered Officer should familiarize
himself or herself with the disclosure requirements generally applicable to the Company. |
| · | Each Covered Officer should, to the
extent appropriate within his or her area of responsibility, consult with other officers and employees of the Company and the adviser
or its affiliates with the goal of promoting full, fair, accurate, timely and understandable disclosure in such reports and documents
the Company files with, or submits to, the SEC. |
| · | Each Covered Officer should not knowingly
misrepresent, or cause others to misrepresent, facts about the Company to others, whether within or outside the Company, including to
the trustees and auditors of the Company, and to governmental regulators and self-regulatory organizations. |
| · | It is the responsibility of each Covered
Officer to promote compliance with the standards and restrictions imposed by laws, rules and regulations applicable to the Company. |
| REPORTING AND ACCOUNTABILITY |
| · | Upon adoption of the Officer Code
(or thereafter as applicable, upon becoming a Covered Officer), each Covered Officer shall affirm in writing to the Code Compliance Officer
that he or she has received, read and understands the Officer Code. Annually thereafter each Covered Officer shall affirm that he or she
has complied with the requirements of the Officer Code. |
| · | Each Covered Officer shall notify
the Code Compliance Officer promptly if he or she knows of any violation of this Officer Code. Failure to do so is itself a violation
of this Officer Code. |
| · | A Covered Officer must not retaliate
against any officer or employee of the Company or its affiliated persons for reports of potential violations that are made in good faith. |
| · | The provisions of this Officer Code,
other than amendments to Exhibit A, and any waivers, including implicit waivers, shall be disclosed in accordance with SEC rules
and regulations. |
Except as described below,
the Code Compliance Officer is responsible for applying this Officer Code to specific situations in which questions may arise and has
the authority to interpret this Officer Code in any particular situation. The Directors of the Company hereby designate the Company’s
Chief Compliance Officer as the Code Compliance Officer. The Code Compliance Officer (or his designee) shall take all action he considers
appropriate to investigate any actual or potential conflicts or violations reported to him.
Any matters that the Code
Compliance Officer believes are a conflict or violation will be reported to the Audit Committee, which shall determine sanctions or other
appropriate action. No Covered Officer who is a member of such committee may participate in any determination under this Officer Code.
The Audit Committee shall be responsible for reviewing any requests for waivers from the provisions of this Officer Code. Any violations
of this Officer Code, any waivers granted from the Officer Code and any potential conflicts and their resolution shall be reported to
the Directors of the Company at the next regular meeting.
Any amendments to this Officer
Code, other than amendments to Exhibit A and clerical or administrative corrections, must be approved or ratified by a majority vote
of the Directors, including a majority of independent Directors.
All reports and records prepared
or maintained pursuant to this Officer Code will be considered confidential and shall be maintained and protected accordingly. Except
as otherwise required by law or this Officer Code, such matters shall not be disclosed to anyone other than the Directors, counsel to
the Company and the investment adviser of the Company.
The Officer Code is intended
solely for the internal use by the Company and does not constitute an admission, by or on behalf of the Company, as to any fact, circumstance
or legal conclusion.
* * * * *
Exhibit A
Persons Covered by this Code of Ethics
| Name |
|
Title |
| |
|
|
|
Matthew Sallee
Sean Wickliffe |
|
Principal Executive Officer
Principal Financial Officer |
Exhibit A amended effective June 3, 2024
EX-99.19A

Tortoise Capital
Pipeline &
Energy Fund, Inc. (NYSE: TTP)
Section 19(a) Notification of Sources of Distribution
| Distribution Period |
August 2024 |
| Distribution Amount per Share |
$0.59 |
The following table sets forth the estimated amounts of the current distribution,
payable Aug. 30, 2024, and the cumulative distribution paid this fiscal year to date from the following sources: net investment income,
net realized short-term capital gains, net realized long-term capital gains and return of capital. All amounts are expressed per common
share.
Tortoise Pipeline & Energy Fund, Inc.
Estimated Sources of Distributions
| | |
($) Current
Distribution | |
% Breakdown
of the Current
Distribution | |
($) Total Cumulative
Distributions for the
Fiscal Year to Date | |
% Breakdown of the
Total Cumulative
Distributions for the
Fiscal Year to Date |
| Net Investment Income | |
| 0.1007 | | |
| 17% | | |
| 0.3573 | | |
| 20% | |
| Net Realized Short-Term Capital Gains | |
| 0.0000 | | |
| 0% | | |
| 0.0000 | | |
| 0% | |
| Net Realized Long-Term Capital Gains | |
| 0.0000 | | |
| 0% | | |
| 0.0000 | | |
| 0% | |
| Return of Capital | |
| 0.4893 | | |
| 83% | | |
| 1.4127 | | |
| 80% | |
| Total (per common share) | |
| 0.5900 | | |
| 100% | | |
| 1.7700 | | |
| 100% | |
| | |
| | | |
| | | |
| | | |
| | |
Average annual total return (in relation to NAV) for the five years ending
on July 31, 2024 |
| -0.56% | |
Annualized current distribution rate expressed as a percentage of NAV as
of July 31, 2024 | |
| 5.61% | |
| | |
| | | |
| | | |
| | | |
| | |
Cumulative total return (in relation to NAV) for the fiscal year through
July 31, 2024 | |
| 26.09% | |
Cumulative fiscal year distributions as a percentage of NAV as of July 31,
2024 | |
| 4.21% | |
You should not draw any conclusions about TTP's investment performance from
the amount of this distribution or from the terms of TTP’s distribution policy.
TTP estimates that it has distributed more than its income and net realized
capital gains; therefore, a portion of your distribution may be a return of capital. A return of capital may occur, for example, when
some or all of the money that you invested in TTP is paid back to you. A return of capital distribution does not necessarily reflect TTP’s
investment performance and should not be confused with "yield" or "income."
The amounts and sources of distributions reported are only estimates and
are not being provided for tax reporting purposes. The actual amounts and sources of the amounts for tax reporting purposes will depend
upon TTP's investment experience during the remainder of its fiscal year and may be subject to changes based on tax regulations. TTP will
send you a Form 1099-DIV for the calendar year that will tell you how to report these distributions for federal income tax purposes.
TTP is a
non-diversified, closed-end management investment company that seeks to obtain a high level of total return with an emphasis on
current distributions. TTP invests primarily in equity securities of pipeline companies that transport natural gas, natural gas
liquids (NGLs), crude oil and refined products and, to a lesser extent, in other energy infrastructure companies. For more
information, visit TTP's website at cef.tortoiseadvisors.com or call (866) 362-9331.
6363 College Boulevard, Suite
100A, Overland Park, KS 66211 | Main 1-913-981-1020 | Fax 1-913-981-1021 | www.TortoiseAdvisors.com

Tortoise
Capital
Pipeline &
Energy Fund, Inc. (NYSE: TTP)
Section 19(a) Notification of Sources of Distribution
| Distribution
Period |
November
2024 |
| Distribution
Amount per Share |
$0.59 |
The following table sets forth the estimated amounts of the current distribution,
paid on Nov. 29, 2024, and the cumulative distributions paid this fiscal year to date from the following sources: net investment income,
net realized short-term capital gains, net realized long-term capital gains and return of capital. All amounts are expressed per common
share.
Tortoise Pipeline & Energy Fund, Inc.
Estimated Sources of Distributions
| | |
($) Current
Distribution | |
% Breakdown of
the Current
Distribution | |
($) Total Cumulative
Distributions for the
Fiscal Year to Date | |
% Breakdown of the
Total Cumulative
Distributions for the
Fiscal Year to Date |
| Net Investment Income | |
| 0.0915 | | |
| 16% | | |
| 0.4492 | | |
| 19% | |
| Net Realized Short-Term Capital Gains | |
| 0.0000 | | |
| 0% | | |
| 0.0000 | | |
| 0% | |
| Net Realized Long-Term Capital Gains | |
| 0.0000 | | |
| 0% | | |
| 0.0000 | | |
| 0% | |
| Return of Capital | |
| 0.4985 | | |
| 84% | | |
| 1.9108 | | |
| 81% | |
| Total (per common share) | |
| 0.1050 | | |
| 100% | | |
| 2.3600 | | |
| 100% | |
| | |
| | | |
| | | |
| | | |
| | |
| Average annual total return (in relation to NAV) for the five years ending
on October 31, 2024 | |
| 3.30% | |
| Annualized current distribution rate expressed as a percentage of NAV as
of October 31, 2024 | |
| 5.15% | |
| | |
| | | |
| | | |
| | | |
| | |
| Cumulative total return (in relation to NAV) for the fiscal year through
October 31, 2024 | |
| 39.34% | |
| Cumulative fiscal year distributions as a percentage of NAV as of October
31, 2024 | |
| 5.15% | |
You should not draw any conclusions about TTP's investment performance from
the amount of this distribution or from the terms of TTP’s distribution policy.
TTP estimates that it has distributed more than its income and net realized
capital gains; therefore, a portion of your distribution may be a return of capital. A return of capital may occur, for example, when
some or all of the money that you invested in TTP is paid back to you. A return of capital distribution does not necessarily reflect TTP’s
investment performance and should not be confused with "yield" or "income."
The amounts and sources of distributions reported are only estimates and
are not being provided for tax reporting purposes. The actual amounts and sources of the amounts for tax reporting purposes will depend
upon TTP’s investment experience during the remainder of its fiscal year and may be subject to changes based on tax regulations. TTP will
send you a Form 1099-DIV for the calendar year that will tell you how to report these distributions for federal income tax purposes.
TTP is a non-diversified,
closed-end management investment company that seeks to obtain a high level of total return with an emphasis on current distributions.
TTP invests primarily in equity securities of pipeline companies that transport natural gas, natural gas liquids (NGLs), crude oil and
refined products and, to a lesser extent, in other energy infrastructure companies. For more information, visit TTP's website at cef.tortoiseadvisors.com
or call (866) 362-9331.
6363 College Boulevard, Suite
100A, Overland Park, KS 66211 | Main 1-913-981-1020 | Fax 1-913-981-1021 | www.TortoiseAdvisors.com
EX-99.VOTEREG
PROXY VOTING
POLICIES AND PROCEDURES
Each investment company
listed on Exhibit A hereto (each referred to as the “Company”) has adopted and implemented the following policies and procedures,
which it believes are reasonably designed to ensure that proxies are voted in the best interests of the Company and its shareholders.
In pursuing this policy, proxies should be voted in a manner that is intended to maximize shareholder value and all conflicts of interests
should be resolved exclusively in favor of the Company.
The Company hereby delegates
responsibility for voting proxies for which it is entitled to vote to Tortoise Capital Advisors, L.L.C. (the “Adviser”) and
the Adviser hereby accepts such delegation and agrees to vote proxies in accordance with these Policies and Procedures. The Adviser may
delegate its responsibilities under these Policies and Procedures to a third party, including any sub-adviser to the Adviser with respect
to the Company (a “Sub-Adviser”), provided that no such delegation shall relieve the Adviser of its responsibilities hereunder
and the Adviser shall retain final authority and fiduciary responsibility for such proxy voting.
| 3. | Proxy Voting Guidelines |
| a. | The Adviser utilizes Glass Lewis to provide independent research on corporate governance, proxy and corporate
responsibility issues. The Adviser reviews these voting recommendations and proxies are generally voted in accordance with such recommendations.
The Adviser has adopted Glass Lewis’ proxy voting guidelines, which are applied to all Adviser proxy votes at the time proxy votes
are submitted. The Adviser will consider additional information that may become available regarding a particular proposal. This additional
information may include an issuer’s or a shareholder proponent’s subsequently filed additional definitive proxy materials.
Proxies are generally voted in accordance with the Adviser’s proxy voting guidelines; however, the Adviser may opt to override the
guidelines if it is decided to be the best interest of its clients, including the Company and its shareholders. |
| b. | The Chief Executive Officer or their designee is responsible for monitoring Company actions and ensuring
that proxies are voted in a timely manner. None of the Company, the Adviser or any Sub-Adviser is responsible for voting proxies it does
not receive, but will make reasonable efforts to obtain missing proxies. |
| c. | The Chief Executive Officer, or their designee, shall implement procedures to identify and monitor potential
conflicts of interest that could affect the proxy voting process, including (i) significant client relationships of the Adviser; (ii)
other potential material business relationships of the Adviser or the Company; and (iii) material personal and family relationships. |
| d. | In the absence of contrary instructions received from the applicable Investment Committee of the Adviser,
or a Managing Director of the Adviser designated by the Investment Committee, or any Sub-Adviser to whom proxy voting responsibilities
have been delegated, all proxies will be voted in accordance with the Guidelines referenced in Exhibit B. |
| e. | The Company, the Adviser, or any Sub-Adviser to whom proxy voting responsibilities have been delegated,
may determine not to vote a particular proxy, if the costs and burdens exceed the benefits of voting (e.g., when securities are subject
to loan or to share blocking restrictions). |
| f. | In certain limited circumstances, particularly in the area of structured finance, the Adviser may enter
into voting agreements or other contractual obligations that govern the voting of shares or other interests and, in such cases, will vote
any shares or other interests by proxy in accordance with such agreement or obligation. In addition, where the Adviser or Sub-Adviser
determines that there are unusual costs and/or difficulties associated with voting a particular security, which more typically might be
the case with respect to securities of non-U.S. issuers, the Adviser or Sub-Adviser reserves the right not to vote a security by proxy
unless it determines that the potential benefits of voting the security exceed the expected cost. Other factors that may influence the
Adviser’s or Sub-Adviser’s determination not to vote a debt or equity security include if: (1) the effect on the applicable
client’s economic interests or the value of the account’s holding is insignificant in relation to the client’s account
as a whole; (2) the cost of voting the security outweighs the possible benefit to the applicable client, including, without limitation,
situations where a jurisdiction imposes share blocking restrictions which may affect the ability of the account managers to effect trades
in the related security; or (3) the Adviser or Sub-Adviser otherwise determines that it is consistent with it’s fiduciary obligations
not to vote the security. |
The Adviser shall use commercially
reasonable efforts to determine whether a potential conflict may exist, and a potential conflict shall be deemed to exist only if one
or more of the members of the applicable Investment Committee or any portfolio manager of the Adviser or any Sub-Adviser actually knew
or should have known of the conflict. The Company is sensitive to conflicts of interest that may arise in the proxy decision-making process
and has identified the following potential conflicts of interest:
| · | A principal of the Company or any person involved in the proxy decision-making process currently serves
on the Board of the portfolio company. |
| · | An immediate family member of a principal of the Company or any person involved in the proxy decision-making
process currently serves as a director or executive officer of the portfolio company. |
| · | The Company, any venture capital fund managed by the Adviser or any Sub-Adviser, or any affiliate holds
a significant ownership interest in the portfolio company. |
This list is not intended
to be exclusive. All employees are obligated to disclose any potential conflict to the Chief Compliance Officer.
If a material conflict
is identified, including a conflict of interest between the Company’s stockholders on the one hand, and the Adviser, any Sub-Adviser,
the Company’s principal underwriters, or any of the Company’s affiliated persons, on the other hand, Company management may
(i) disclose the potential conflict to the Board of Directors and obtain consent; (ii) establish an ethical wall or other informational
barriers between the person(s) that are involved in the conflict and the persons making the voting decisions, (iii) abstain from voting
the proxies, or (iv) use an independent third party recommendation. The Adviser will document the rationale for any proxy voted contrary
to the proxy voting guidelines. Such information will be maintained as part of the recordkeeping requirements.
The Chief Compliance Officer
or designee will periodically perform a due diligence review of Glass Lewis to help ensure that any and all conflicts have been disclosed
to the Company.
| a. | The Adviser shall submit a report at the next regularly scheduled meeting, but no less frequently than
annually to the Board regarding any issues arising under the Policy, including any issues arising under these Policies and Procedures
since the last report to the Board and the resolution of such issues, including information about conflicts. |
| b. | The Adviser shall submit a report at the next regularly scheduled meeting, but no less frequently than
annually, identifying any recommended changes in practices. |
The Chief Executive Officer
is responsible for ensuring maintenance of the following records:
| · | proxy voting policies and procedures; |
| · | proxy statements (provided, however, that the Company may rely on the Securities and Exchange Commission’s
EDGAR system if the Company filed its proxy statements via EDGAR or may rely on a third party as long as the third party has provided
the Company with an undertaking to provide a copy of the proxy statement promptly upon request); |
| · | records of votes cast; and |
| · | any records prepared by the Company that were material to a proxy voting decision or that memorialized
a decision. |
* * * * *
Adopted December 12, 2003; Revised May 21, 2010; Revised
May 28, 2014; Revised effective March 24, 2022; Revised effective June 13, 2023
Exhibit A
Tortoise
Energy Infrastructure Corporation (“TYG”)
Tortoise
Power and Energy Infrastructure Fund, Inc. (“TPZ”)
Tortoise
Midstream Energy Fund, Inc. (“NTG”)
Tortoise
Pipeline & Energy Fund, Inc. (“TTP”)
Tortoise
Energy Independence Fund, Inc. (“NDP”)
Ecofin Sustainable and Social Impact Term Fund (“TEAF”)
Exhibit B
Glass Lewis standard guidelines for
the various relevant local markets, including the U.S., are available upon request.
Amended effective as of June 13, 2023
EX-99.VOTEADV
tortoise Capital Advisors,
L.L.C.
(THE “adviser”)
PROXY VOTING
POLICIES AND PROCEDURES
Unless a client is a registered
investment company under the Investment Company Act of 1940 or a client requests the Adviser to do so in writing, the Adviser does not
vote proxy materials for its clients. In the event the Adviser receives any proxies intended for clients who have not delegated proxy
voting responsibilities to the Adviser, the Adviser will promptly forward such proxies to the client for the client to vote. When requested
by the client, the Adviser may provide advice to the client regarding proposals submitted to the client for voting. In the event an employee
determines that the Adviser has a conflict of interest due to, for example, a relationship with a company or an affiliate of a company,
or for any other reason which could influence the advice given, the employee will advise the Chief Compliance Officer who will advise
the applicable Investment Committee, and the Investment Committee will decide which of the procedures set forth in Section 3 below the
Adviser will use.
In cases in which the client
is a registered investment company under the Investment Company Act of 1940 or in cases where the client has delegated proxy voting responsibility
and authority to the Adviser, the Adviser has adopted and implemented the following policies and procedures, which it believes are reasonably
designed to ensure that proxies are voted in the best interests of its clients. In pursuing this policy, proxies should be voted in a
manner that is intended to maximize value to the client. In situations where Adviser accepts such delegation and agrees to vote proxies,
Adviser will do so in accordance with these Policies and Procedures. The Adviser may delegate its responsibilities under these Policies
and Procedures to a third party, provided that no such delegation shall relieve the Adviser of its responsibilities hereunder and the
Adviser shall retain final authority and fiduciary responsibility for such proxy voting. If there are any differences between these policies
and procedures and the proxy voting policies and procedures adopted by a registered investment company client, the policies and procedures
of the registered investment company client will supersede these policies and procedures.
| 2. | Proxy Voting Guidelines |
| a. | The Adviser utilizes Glass Lewis to provide independent research on corporate governance, proxy and corporate
responsibility issues. The Adviser reviews these voting recommendations and proxies are generally voted in accordance with such recommendations. |
| b. | The Adviser has adopted Glass Lewis’ proxy voting guidelines, which are applied to all Adviser proxy
votes at the time proxy votes are submitted. The Adviser will consider additional information that may become available regarding a particular
proposal. This additional information may include an issuer’s or a shareholder proponent’s subsequently filed additional definitive
proxy materials. |
| c. | Proxies are generally voted in accordance with the Adviser’s proxy voting guidelines; however, the
Adviser may opt to override the guidelines if it is decided to be the best interest of its clients. |
| d. | The applicable Investment Committee of the Adviser, or a Managing Director of the Adviser designated by
the Investment Committee as listed on Exhibit A hereto (the “Designated Managing Director”), is responsible for monitoring
the Adviser’s proxy voting actions and ensuring proxies are voted in a timely manner. The Adviser is not responsible for voting
proxies it does not receive, but will make reasonable efforts to obtain missing proxies. |
| e. | The applicable Investment Committee of the Adviser, or the Designated Managing Director, shall implement
procedures to identify and monitor potential conflicts of interest that could affect the proxy voting process, including (i) significant
client relationships; (ii) other potential material business relationships; and (iii) material personal and family relationships. |
| f. | In the absence of contrary instructions received from the applicable Investment Committee of the Adviser,
or the Designated Managing Director, all proxies will be voted in in accordance with the Guidelines referenced in Exhibit B. |
| g. | The Adviser may determine not to vote a particular proxy, if the costs and burdens exceed the benefits
of voting (e.g., when securities are subject to loan or to share blocking restrictions). |
The Adviser shall use commercially
reasonable efforts to determine whether a potential conflict may exist, and a potential conflict shall be deemed to exist only if one
or more of the members of the applicable Investment Committee of the Adviser actually knew or should have known of the conflict. The Adviser
is sensitive to conflicts of interest that may arise in the proxy decision-making process and has identified the following potential conflicts
of interest:
| · | A principal of the Adviser or any person involved in the proxy decision-making process currently serves
on the Board of the portfolio company. |
| · | An immediate family member of a principal of the Adviser or any person involved in the proxy decision-making
process currently serves as a director or executive officer of the portfolio company. |
| · | The Adviser, any venture capital fund managed by the Adviser, or any affiliate holds a significant ownership
interest in the portfolio company. |
This list is not intended
to be exclusive. All employees are obligated to disclose any potential conflict to the Adviser’s Chief Compliance Officer.
If a material conflict
is identified, Adviser management may (i) disclose the potential conflict to the client and obtain consent; (ii) establish an ethical
wall or other informational barriers between the person(s) that are involved in the conflict and the persons making the voting decisions,
(iii) abstain from voting the proxies; or (iv) forward the proxies to clients so the clients may vote the proxies themselves, or (v) use
an independent third party recommendation. The Adviser will document the rationale for any proxy voted contrary to the proxy voting guidelines.
Such information will be maintained as part of the recordkeeping requirements.
The CCO or designee will
periodically perform a due diligence review of Glass Lewis to help ensure that any and all conflicts have been disclosed to the Adviser,
The applicable Investment
Committee of the Adviser, or personnel of the Adviser designated by the Investment Committee as listed on Exhibit A hereto, are responsible
for maintaining the following records:
| · | proxy voting policies and procedures; |
| · | proxy statements (provided, however, that the Adviser may rely on the Securities and Exchange Commission’s
EDGAR system if the issuer filed its proxy statements via EDGAR or may rely on a third party as long as the third party has provided the
Adviser with an undertaking to provide a copy of the proxy statement promptly upon request); |
| · | records of votes cast and abstentions; and |
| · | any records prepared by the Adviser that were material to a proxy voting decision or that memorialized
a decision. |
| · | A copy of each written client request for information on how the Adviser voted proxies on behalf of the
requesting client, and a copy of any written response by the Adviser to any (written or oral) client request for information on how the
Adviser voted proxies on behalf of the requesting client. |
Revised effective as of June
13, 2023
Exhibit A
Managing Director of
the Adviser Designated by Investment Committee (“Designated Managing Director”)
Each of the following
is a “Designated Managing Director” and may act individually as such for purposes of these Proxy Voting Policies and Procedures
Brian Kessens
James Mick
Matt Sallee
Rob Thummel
Any other individual
designated by one or more of the Designated Managing Directors
Designees for Electronic
Voting of Proxies
SMA Operations team
Any other individual
designated by one or more of the Designated Managing Directors
Designated Personnel
for Record Keeping
Chief Compliance Officer,
or his or her designee
SMA Operations team
Exhibit
A amended effective as of April 4, 2024
Exhibit B
Glass Lewis standard guidelines for
the various relevant local markets, including the U.S., are available upon request.
Exhibit B amended effective
as of June 13, 2023
v3.25.0.1
N-2 - $ / shares
|
12 Months Ended |
|
Nov. 30, 2024 |
Nov. 30, 2023 |
Nov. 30, 2022 |
Nov. 30, 2021 |
Nov. 30, 2020 |
Nov. 30, 2019 |
| Prospectus [Line Items] |
|
|
|
|
|
|
| Document Period End Date |
Nov. 30, 2024
|
|
|
|
|
|
| Cover [Abstract] |
|
|
|
|
|
|
| Entity Central Index Key |
0001526329
|
|
|
|
|
|
| Amendment Flag |
false
|
|
|
|
|
|
| Entity Inv Company Type |
N-2
|
|
|
|
|
|
| Document Type |
N-CSR
|
|
|
|
|
|
| Entity Registrant Name |
Tortoise Pipeline & Energy Fund, Inc.
|
|
|
|
|
|
| Financial Highlights [Abstract] |
|
|
|
|
|
|
| Senior Securities [Table Text Block] |
9. Senior Notes
TYG, NTG and TTP each have issued private senior notes
(collectively, the “Notes”), which are unsecured obligations and, upon liquidation, dissolution or winding up of a Fund, will
rank: (1) senior to all of the Fund’s outstanding preferred shares, if any; (2) senior to all of the Fund’s outstanding common
shares; (3) on parity with any unsecured creditors of the Fund and any unsecured senior securities representing indebtedness of the Fund
and (4) junior to any secured creditors of the Fund. Holders of the Notes are entitled to receive periodic cash interest payments until
maturity. The Notes are not listed on any exchange or automated quotation system.
The Notes are redeemable in certain circumstances at the
option of a Fund, subject to payment of any applicable make-whole amounts or early redemption premiums. The Notes for a Fund are also
subject to a mandatory redemption if the Fund fails to meet asset coverage ratios required under the 1940 Act or the rating agency guidelines
if such failure is not waived or cured. At November 30, 2024, each of TYG, NTG and TTP were in compliance with asset coverage covenants
and basic maintenance covenants for its senior notes.
Details of each Fund’s outstanding Notes, including
estimated fair value, as of November 30, 2024, are included below. The estimated fair value of each series of fixed-rate Notes was calculated,
for disclosure purposes, by discounting future cash flows by a rate equal to the current U.S. Treasury rate with an equivalent maturity
date, plus either 1) the spread between the interest rate on recently issued debt and the U.S. Treasury rate with a similar maturity date
or 2) if there has not been a recent debt issuance, the spread between the AAA corporate finance debt rate and the U.S. Treasury rate
with an equivalent maturity date plus the spread between the fixed rates of the Notes and the AAA corporate finance debt rate. The estimated
fair value of floating rate Notes approximates the carrying amount because the interest rate fluctuates with changes in interest rates
available in the current market. The estimated fair values in the following tables are Level 2 valuations within the fair value hierarchy.
| TYG: | |
| |
| |
| |
| | |
| |
| Series | |
Maturity Date | |
Interest Rate | |
Payment Frequency | |
Notional Amount | | |
Estimated
Fair Value | |
| Series L | |
December 19, 2024 | |
3.99% | |
Semi-Annual | |
$ | 6,453,333 | | |
$ | 6,562,811 | |
| Series AA | |
June 14, 2025 | |
3.48% | |
Semi-Annual | |
| 3,226,666 | | |
| 3,244,572 | |
| Series NN | |
June 14, 2025 | |
3.20% | |
Semi-Annual | |
| 9,680,000 | | |
| 9,708,778 | |
| Series KK | |
December 18, 2025 | |
3.53% | |
Semi-Annual | |
| 3,226,667 | | |
| 3,218,638 | |
| Series OO | |
April 9, 2026 | |
3.27% | |
Semi-Annual | |
| 9,680,000 | | |
| 9,466,463 | |
| Series PP | |
September 25, 2027 | |
3.33% | |
Semi-Annual | |
| 8,066,667 | | |
| 7,722,349 | |
| Series QQ | |
December 17, 2028 | |
2.50% | |
Semi-Annual | |
| 10,000,000 | | |
| 9,803,367 | |
| | |
| |
| |
| |
$ | 50,333,333 | | |
$ | 49,726,978 | |
On December 18, 2023, TYG’s Series JJ Notes, with
a notional amount of $6,453,333 and a fixed interest rate of 3.34% were paid in full at maturity.
On January 22, 2024, TYG’s Series T Notes, with a
notional amount of $8,066,667 and a fixed interest rate of 4.16% were paid in full at maturity.
| NTG: | |
| |
| |
| |
| | |
| |
| Series | |
Maturity Date | |
Interest Rate | |
Payment Frequency | |
Notional Amount | | |
Estimated
Fair Value | |
| Series Q | |
October 16, 2025 | |
3.97% | |
Semi-Annual | |
$ | 2,234,292 | | |
$ | 2,217,881 | |
| Series R | |
October 16, 2026 | |
4.02% | |
Semi-Annual | |
| 1,936,386 | | |
| 1,902,960 | |
| Series S | |
December 17, 2028 | |
2.50% | |
Semi-Annual | |
| 25,000,000 | | |
| 22,870,124 | |
| | |
| |
| |
| |
$ | 29,170,678 | | |
$ | 26,990,965 | |
| | |
| |
| |
| |
| | | |
| | |
| TTP: | |
| |
| |
| |
| | | |
| | |
| Series | |
Maturity Date | |
Interest Rate | |
Payment Frequency | |
Notional Amount | | |
Estimated
Fair Value | |
| Series H | |
December 13, 2024 | |
3.97% | |
Semi-Annual | |
$ | 3,942,858 | | |
$ | 4,013,066 | |
|
|
|
|
|
|
| Preferred Stock Liquidating Preference |
$ 25.00
|
|
|
|
|
|
| Senior Securities, Note [Text Block] |
9. Senior Notes
TYG, NTG and TTP each have issued private senior notes
(collectively, the “Notes”), which are unsecured obligations and, upon liquidation, dissolution or winding up of a Fund, will
rank: (1) senior to all of the Fund’s outstanding preferred shares, if any; (2) senior to all of the Fund’s outstanding common
shares; (3) on parity with any unsecured creditors of the Fund and any unsecured senior securities representing indebtedness of the Fund
and (4) junior to any secured creditors of the Fund. Holders of the Notes are entitled to receive periodic cash interest payments until
maturity. The Notes are not listed on any exchange or automated quotation system.
The Notes are redeemable in certain circumstances at the
option of a Fund, subject to payment of any applicable make-whole amounts or early redemption premiums. The Notes for a Fund are also
subject to a mandatory redemption if the Fund fails to meet asset coverage ratios required under the 1940 Act or the rating agency guidelines
if such failure is not waived or cured. At November 30, 2024, each of TYG, NTG and TTP were in compliance with asset coverage covenants
and basic maintenance covenants for its senior notes.
Details of each Fund’s outstanding Notes, including
estimated fair value, as of November 30, 2024, are included below. The estimated fair value of each series of fixed-rate Notes was calculated,
for disclosure purposes, by discounting future cash flows by a rate equal to the current U.S. Treasury rate with an equivalent maturity
date, plus either 1) the spread between the interest rate on recently issued debt and the U.S. Treasury rate with a similar maturity date
or 2) if there has not been a recent debt issuance, the spread between the AAA corporate finance debt rate and the U.S. Treasury rate
with an equivalent maturity date plus the spread between the fixed rates of the Notes and the AAA corporate finance debt rate. The estimated
fair value of floating rate Notes approximates the carrying amount because the interest rate fluctuates with changes in interest rates
available in the current market. The estimated fair values in the following tables are Level 2 valuations within the fair value hierarchy.
| TYG: | |
| |
| |
| |
| | |
| |
| Series | |
Maturity Date | |
Interest Rate | |
Payment Frequency | |
Notional Amount | | |
Estimated
Fair Value | |
| Series L | |
December 19, 2024 | |
3.99% | |
Semi-Annual | |
$ | 6,453,333 | | |
$ | 6,562,811 | |
| Series AA | |
June 14, 2025 | |
3.48% | |
Semi-Annual | |
| 3,226,666 | | |
| 3,244,572 | |
| Series NN | |
June 14, 2025 | |
3.20% | |
Semi-Annual | |
| 9,680,000 | | |
| 9,708,778 | |
| Series KK | |
December 18, 2025 | |
3.53% | |
Semi-Annual | |
| 3,226,667 | | |
| 3,218,638 | |
| Series OO | |
April 9, 2026 | |
3.27% | |
Semi-Annual | |
| 9,680,000 | | |
| 9,466,463 | |
| Series PP | |
September 25, 2027 | |
3.33% | |
Semi-Annual | |
| 8,066,667 | | |
| 7,722,349 | |
| Series QQ | |
December 17, 2028 | |
2.50% | |
Semi-Annual | |
| 10,000,000 | | |
| 9,803,367 | |
| | |
| |
| |
| |
$ | 50,333,333 | | |
$ | 49,726,978 | |
On December 18, 2023, TYG’s Series JJ Notes, with
a notional amount of $6,453,333 and a fixed interest rate of 3.34% were paid in full at maturity.
On January 22, 2024, TYG’s Series T Notes, with a
notional amount of $8,066,667 and a fixed interest rate of 4.16% were paid in full at maturity.
| NTG: | |
| |
| |
| |
| | |
| |
| Series | |
Maturity Date | |
Interest Rate | |
Payment Frequency | |
Notional Amount | | |
Estimated
Fair Value | |
| Series Q | |
October 16, 2025 | |
3.97% | |
Semi-Annual | |
$ | 2,234,292 | | |
$ | 2,217,881 | |
| Series R | |
October 16, 2026 | |
4.02% | |
Semi-Annual | |
| 1,936,386 | | |
| 1,902,960 | |
| Series S | |
December 17, 2028 | |
2.50% | |
Semi-Annual | |
| 25,000,000 | | |
| 22,870,124 | |
| | |
| |
| |
| |
$ | 29,170,678 | | |
$ | 26,990,965 | |
| | |
| |
| |
| |
| | | |
| | |
| TTP: | |
| |
| |
| |
| | | |
| | |
| Series | |
Maturity Date | |
Interest Rate | |
Payment Frequency | |
Notional Amount | | |
Estimated
Fair Value | |
| Series H | |
December 13, 2024 | |
3.97% | |
Semi-Annual | |
$ | 3,942,858 | | |
$ | 4,013,066 | |
|
|
|
|
|
|
| General Description of Registrant [Abstract] |
|
|
|
|
|
|
| Investment Objectives and Practices [Text Block] |
1. General Organization
This report covers the
following companies, each of which is listed on the New York Stock Exchange (“NYSE”): Tortoise Energy Infrastructure Corp.
(“TYG”), Tortoise Midstream Energy Fund, Inc. (“NTG”), Tortoise Pipeline & Energy Fund, Inc. (“TTP”),
Tortoise Energy Independence Fund, Inc. (“NDP”), Tortoise Power and Energy Infrastructure Fund, Inc. (“TPZ”),
and Tortoise Sustainable and Social Impact Term Fund (“TEAF) (formerly, Ecofin Sustainable and Social Impact Term Fund). These
companies are individually referred to as a “Fund” or by their respective NYSE symbols, or collectively as the “Funds”,
and each is a non-diversified, closed-end management investment company under the Investment Company Act of 1940, as amended (the “1940
Act”). Each of TYG, NTG, TTP, NDP and TEAF has a primary investment objective to seek a high level of total return with an emphasis
on current distributions. TPZ has a primary investment objective to provide a high level of current income, with a secondary objective
of capital appreciation.
|
|
|
|
|
|
| Risk Factors [Table Text Block] |
3. Risks and Uncertainties
TYG,
NTG, TTP, NDP and TPZ concentrate their investments in the energy sector. TEAF concentrates its investments in issuers operating in essential
asset sectors. Funds that primarily invest in a particular sector may experience greater volatility than companies investing in a broad
range of industry sectors. A Fund may, for defensive purposes, temporarily invest all or a significant portion of its assets in investment
grade securities, short-term debt securities and cash or cash equivalents. To the extent a Fund uses this strategy, it may not achieve
its investment objective.
|
|
|
|
|
|
| Effects of Leverage [Text Block] |
Leverage
The
fund’s leverage utilization decreased $4.3 million during the six months ended Q4 2024, compared to the six months ended Q2 2024,
and represented 10.5% of total assets at November 30, 2024. At year-end, the fund was in compliance with applicable coverage ratios,
78.8% of the leverage cost was fixed, the weighted-average maturity was less than 1 year and the weighted-average annual rate on leverage
was 4.83%. These rates will vary in the future as a result of changing floating rates, utilization of the fund’s credit facility
and as leverage matures or is redeemed.
Please
see the Financial Statements and Notes to Financial Statements for additional detail regarding critical accounting policies, results
of operations, leverage and other important fund information.
For
further information regarding the fund’s leverage and distributions to stockholders, as well as a discussion of the tax impact
on distributions, please visit www.tortoiseadvisors.com.
|
|
|
|
|
|
| Annual Dividend Payment |
$ (2.36)
|
$ (2.36)
|
$ (2.36)
|
$ (1.06)
|
$ (1.62)
|
|
| Annual Coverage Return Rate [Percent] |
78.80%
|
|
|
|
|
|
| NAV Per Share |
$ 52.70
|
$ 34.58
|
$ 34.73
|
$ 27.96
|
$ 19.97
|
$ 51.88
|
| Latest Premium (Discount) to NAV [Percent] |
(0.70%)
|
|
|
|
|
|
| Capital Stock, Long-Term Debt, and Other Securities [Abstract] |
|
|
|
|
|
|
| Capital Stock [Table Text Block] |
F. Distributions to Stockholders
Distributions to common stockholders
are recorded on the ex-dividend date. The Funds may not declare or pay distributions to its common stockholders if it does not meet asset
coverage ratios required under the 1940 Act or the rating agency guidelines for its debt and preferred stock following such distribution.
The amount of any distributions will be determined by the Board of Directors. The character of distributions to common stockholders made
during the year may differ from their ultimate characterization for federal income tax purposes.
As RICs, TYG, NTG, TTP, NDP, TPZ
and TEAF each intend to make cash distributions of its investment company taxable income and capital gains to common stockholders. In
addition, on an annual basis, TYG, NTG, TTP, NDP, TPZ and TEAF each may distribute additional capital gains in the last calendar quarter
if necessary to meet minimum distribution requirements and thus avoid being subject to excise taxes. Distributions paid to stockholders
in excess of investment company taxable income and net realized gains will be treated as return of capital to stockholders.
Distributions to mandatory redeemable
preferred (“MRP”) stockholders are accrued daily based on applicable distribution rates for each series and paid periodically
according to the terms of the agreements. The Funds may not declare or pay distributions to its preferred stockholders if it does not
meet a 200% asset coverage ratio for its debt or the rating agency basic maintenance amount for the debt following such distribution.
The character of distributions to preferred stockholders made during the year may differ from their ultimate characterization for federal
income tax purposes.
Distributions to stockholders for
the year ended November 30, 2024 were characterized as follows:
| | |
TYG | | |
NTG | | |
TTP | | |
NDP | | |
TPZ | | |
TEAF | |
| | |
Common | | |
Preferred | | |
Common | | |
Preferred | | |
Common | | |
Preferred | | |
Common | | |
Common | | |
Common | |
| Qualified
dividend income | |
| 15 | % | |
| 100 | % | |
| 11 | % | |
| 100 | % | |
| 14 | % | |
| 100 | % | |
| 17 | % | |
| 18 | % | |
| 18 | % |
| Ordinary dividend
income | |
| — | | |
| — | | |
| — | | |
| — | | |
| — | | |
| — | | |
| — | | |
| 9 | % | |
| 31 | % |
| Return of capital | |
| 85 | % | |
| — | | |
| 89 | % | |
| — | | |
| 86 | % | |
| — | | |
| 83 | % | |
| 73 | % | |
| 51 | % |
| Long-term capital
gain | |
| — | | |
| — | | |
| — | | |
| — | | |
| — | | |
| — | | |
| — | | |
| — | | |
| — | |
| * |
For Federal income tax purposes, distributions
of short-term capital gains are included in qualified dividend income. |
|
|
|
|
|
|
| Security Voting Rights [Text Block] |
TYG, NTG and TTP each have issued and outstanding MRP Stock
at November 30, 2024. The MRP Stock has rights determined by the Board of Directors. Except as otherwise indicated in the Funds’
Charter or Bylaws, or as otherwise required by law, the holders of MRP Stock have voting rights equal to the holders of common stock (one
vote per MRP share) and will vote together with the holders of shares of common stock as a single class except on matters affecting only
the holders of preferred stock or the holders of common stock. The 1940 Act requires that the holders of any preferred stock (including
MRP Stock), voting separately as a single class, have the right to elect at least two directors at all times.
|
|
|
|
|
|
| Long Term Debt, Title [Text Block] |
G. Offering and Debt Issuance
Costs
Offering costs related to the issuance
of common stock are charged to additional paid-in capital when the stock is issued. Debt issuance costs related to senior notes and MRP
Stock are deferred and amortized over the period the debt or MRP Stock is outstanding. Offering costs related to the issuance of common
stock in prior years are amortized and included on the statement of operations.
There were no offering or debt issuance
costs recorded during the year December 1, 2023 through November 30, 2024 for TYG, NTG, TTP, NDP, TPZ or TEAF.
|
|
|
|
|
|
| Other Security, Title [Text Block] |
12. Derivative Financial Instruments
The Funds have adopted the disclosure provisions of FASB
Accounting Standard Codification 815, Derivatives and Hedging (“ASC 815”). ASC 815 requires enhanced disclosures about the
Funds’ use of and accounting for derivative instruments and the effect of derivative instruments on the Funds’ results of
operations and financial position. Tabular disclosure regarding derivative fair value and gain/loss by contract type (e.g., interest rate
contracts, foreign exchange contracts, credit contracts, etc.) is required and derivatives accounted for as hedging instruments under
ASC 815 must be disclosed separately from those that do not qualify for hedge accounting. Even though the Funds may use derivatives in
an attempt to achieve an economic hedge, the Funds’ derivatives are not accounted for as hedging instruments under ASC 815 because
investment companies account for their derivatives at fair value and record any changes in fair value in current period earnings.
Forward Currency Contracts
TEAF may invest in derivative instruments for hedging or
risk management purposes, and for short-term purposes such as maintaining market exposure pending investment of the proceeds of an offering
or transitioning its portfolio between different asset classes. The Fund’s use of derivatives could enhance or decrease the cash
available to the Fund for payment of distributions or interest, as the case may be. Derivatives can be illiquid, may disproportionately
increase losses and have a potentially large negative impact on the Fund’s performance. Derivative transactions, including options
on securities and securities indices and other transactions in which the Fund may engage (such as forward currency transactions, futures
contracts and options thereon and total return swaps), may subject the Fund to increased risk of principal loss due to unexpected movements
in stock prices, changes in stock volatility levels, interest rates and foreign currency exchange rates and imperfect
correlations between the Fund’s securities holdings
and indices upon which derivative transactions are based. The Fund also will be subject to credit risk with respect to the counterparties
to any OTC derivatives contracts the Fund enters into.
As of November 30, 2024, TEAF held no forward currency
contracts.
Interest Rate Swap Contracts
TYG may enter into interest rate swap contracts in an attempt
to protect it from increasing interest expense on its leverage resulting from increasing interest rates. A decline in interest rates may
result in a decline in the value of the swap contracts, which may result in a decline in the net assets of TYG. At the time the interest
rate swap contracts reach their scheduled termination, there is a risk that TYG will not be able to obtain a replacement transaction,
or that the terms of the replacement would not be as favorable as on the expiring transaction. In addition, if TYG is required to terminate
any swap contract early due to a decline in net assets below a threshold amount or failing to maintain a required 300% asset coverage
of the liquidation value of the outstanding debt, then TYG could be required to make a payment to the extent of any net unrealized depreciation
of the terminated swaps, in addition to redeeming all or some of its outstanding debt. TYG segregates a portion of its assets as collateral
for the amount of any net liability of its interest rate swap contracts.
TYG may be subject to credit risk on the interest rate
swap contracts if the counterparty should fail to perform under the terms of the interest rate swap contracts. The amount of credit risk
is limited to the net appreciation of the interest rate swap contracts, if any, as no collateral is pledged by the counterparty. In addition,
if the counterparty to the interest rate swap contracts defaults, the Fund would incur a loss in the amount of the receivable and would
not receive amounts due from the counterparty to offset the interest payments on the Fund’s leverage. As of November 30, 2024, TYG
held no interest rate swap contracts.
Written Call Options
Transactions in written option contracts for TEAF for the
period from December 1, 2023 through November 30, 2024 are as follows:
| | |
TEAF | |
| | |
Number of
Contracts | | |
Premium | |
| Options outstanding at November 30, 2023 | |
| 1,000 | | |
$ | 34,025 | |
| Options written | |
| 245 | | |
| 17,983 | |
| Options closed* | |
| — | | |
| — | |
| Options exercised | |
| (1,000 | ) | |
| (34,025 | ) |
| Options expired | |
| (245 | ) | |
| (17,983 | ) |
| Options outstanding at November 30, 2024 | |
| — | | |
$ | — | |
There were no written option contracts in TYG, NTG, TTP
and NDP during the period December 1, 2023 through November 30, 2024. As of November 30, 2024, TEAF held no written options contracts.
The following table presents the effect of derivatives
on the Statements of Operations for the year ended November 30, 2024:
Derivatives not accounted for
as hedging instruments under ASC 815 | |
Location of Gains (Losses)
on Derivatives | |
Net Realized
Gain (Loss) on
Derivatives | | |
Net Change
in Unrealized
Appreciation
(Depreciation)
of Derivatives | |
| TEAF: Written equity call options | |
Options | |
$ | 17,983 | | |
$ | 12,781 | |
|
|
|
|
|
|
| Outstanding Security, Authorized [Shares] |
100,000,000
|
|
|
|
|
|
| Outstanding Security, Held [Shares] |
2,010,566
|
|
|
|
|
|
| X |
- ReferencesReference 1: http://www.xbrl.org/2003/role/presentationRef
-Publisher SEC
-Name Form N-2
-Section Item 8
-Subsection 3
-Paragraph b
-Subparagraph 2
| Name: |
cef_AnnualCoverageReturnRatePercent |
| Namespace Prefix: |
cef_ |
| Data Type: |
dtr-types:percentItemType |
| Balance Type: |
na |
| Period Type: |
duration |
|
| X |
- ReferencesReference 1: http://www.xbrl.org/2003/role/presentationRef
-Publisher SEC
-Name Form N-2
-Section Item 8
-Subsection 3
-Paragraph b
-Subparagraph 1
| Name: |
cef_AnnualDividendPayment |
| Namespace Prefix: |
cef_ |
| Data Type: |
dtr-types:perShareItemType |
| Balance Type: |
na |
| Period Type: |
duration |
|
| X |
- ReferencesReference 1: http://www.xbrl.org/2003/role/presentationRef
-Publisher SEC
-Name Form N-2
-Section Item 10
| Name: |
cef_CapitalStockLongTermDebtAndOtherSecuritiesAbstract |
| Namespace Prefix: |
cef_ |
| Data Type: |
xbrli:stringItemType |
| Balance Type: |
na |
| Period Type: |
duration |
|
| X |
- ReferencesReference 1: http://www.xbrl.org/2003/role/presentationRef
-Publisher SEC
-Name Form N-2
-Section Item 10
-Subsection 1
-Paragraph a
| Name: |
cef_CapitalStockTableTextBlock |
| Namespace Prefix: |
cef_ |
| Data Type: |
dtr-types:textBlockItemType |
| Balance Type: |
na |
| Period Type: |
duration |
|
| X |
- ReferencesReference 1: http://www.xbrl.org/2003/role/presentationRef
-Publisher SEC
-Name Form N-2
-Section Item 8
-Subsection 3
-Paragraph b
| Name: |
cef_EffectsOfLeverageTextBlock |
| Namespace Prefix: |
cef_ |
| Data Type: |
dtr-types:textBlockItemType |
| Balance Type: |
na |
| Period Type: |
duration |
|
| X |
- ReferencesReference 1: http://www.xbrl.org/2003/role/presentationRef
-Publisher SEC
-Name Form N-2
-Section Item 4
| Name: |
cef_FinancialHighlightsAbstract |
| Namespace Prefix: |
cef_ |
| Data Type: |
xbrli:stringItemType |
| Balance Type: |
na |
| Period Type: |
duration |
|
| X |
- ReferencesReference 1: http://www.xbrl.org/2003/role/presentationRef
-Publisher SEC
-Name Form N-2
-Section Item 8
| Name: |
cef_GeneralDescriptionOfRegistrantAbstract |
| Namespace Prefix: |
cef_ |
| Data Type: |
xbrli:stringItemType |
| Balance Type: |
na |
| Period Type: |
duration |
|
| X |
- ReferencesReference 1: http://www.xbrl.org/2003/role/presentationRef
-Publisher SEC
-Name Form N-2
-Section Item 8
-Subsection 2
-Paragraph b, d
| Name: |
cef_InvestmentObjectivesAndPracticesTextBlock |
| Namespace Prefix: |
cef_ |
| Data Type: |
dtr-types:textBlockItemType |
| Balance Type: |
na |
| Period Type: |
duration |
|
| X |
- ReferencesReference 1: http://www.xbrl.org/2003/role/presentationRef
-Publisher SEC
-Name Form N-2
-Section Item 8
-Subsection 5
-Paragraph c
| Name: |
cef_LatestPremiumDiscountToNavPercent |
| Namespace Prefix: |
cef_ |
| Data Type: |
dtr-types:percentItemType |
| Balance Type: |
na |
| Period Type: |
duration |
|
| X |
- ReferencesReference 1: http://www.xbrl.org/2003/role/presentationRef
-Publisher SEC
-Name Form N-2
-Section Item 10
-Subsection 2
| Name: |
cef_LongTermDebtTitleTextBlock |
| Namespace Prefix: |
cef_ |
| Data Type: |
dtr-types:textBlockItemType |
| Balance Type: |
na |
| Period Type: |
duration |
|
| X |
- ReferencesReference 1: http://www.xbrl.org/2003/role/presentationRef
-Publisher SEC
-Name Form N-2
-Section Item 10
-Subsection 3
| Name: |
cef_OtherSecurityTitleTextBlock |
| Namespace Prefix: |
cef_ |
| Data Type: |
dtr-types:textBlockItemType |
| Balance Type: |
na |
| Period Type: |
duration |
|
| X |
- ReferencesReference 1: http://www.xbrl.org/2003/role/presentationRef
-Publisher SEC
-Name Form N-2
-Section Item 10
-Subsection 5
-Paragraph 2
| Name: |
cef_OutstandingSecurityAuthorizedShares |
| Namespace Prefix: |
cef_ |
| Data Type: |
xbrli:sharesItemType |
| Balance Type: |
na |
| Period Type: |
duration |
|
| X |
- ReferencesReference 1: http://www.xbrl.org/2003/role/presentationRef
-Publisher SEC
-Name Form N-2
-Section Item 10
-Subsection 5
-Paragraph 3
| Name: |
cef_OutstandingSecurityHeldShares |
| Namespace Prefix: |
cef_ |
| Data Type: |
xbrli:sharesItemType |
| Balance Type: |
na |
| Period Type: |
duration |
|
| X |
- ReferencesReference 1: http://www.xbrl.org/2003/role/presentationRef
-Publisher SEC
-Name Form N-2
| Name: |
cef_ProspectusLineItems |
| Namespace Prefix: |
cef_ |
| Data Type: |
xbrli:stringItemType |
| Balance Type: |
na |
| Period Type: |
duration |
|
| X |
- ReferencesReference 1: http://www.xbrl.org/2003/role/presentationRef
-Publisher SEC
-Name Form N-2
-Section Item 8
-Subsection 3
-Paragraph a
| Name: |
cef_RiskFactorsTableTextBlock |
| Namespace Prefix: |
cef_ |
| Data Type: |
dtr-types:textBlockItemType |
| Balance Type: |
na |
| Period Type: |
duration |
|
| X |
- ReferencesReference 1: http://www.xbrl.org/2003/role/presentationRef
-Publisher SEC
-Name Form N-2
-Section Item 10
-Subsection 1
-Paragraph a
-Subparagraph 2
| Name: |
cef_SecurityVotingRightsTextBlock |
| Namespace Prefix: |
cef_ |
| Data Type: |
dtr-types:textBlockItemType |
| Balance Type: |
na |
| Period Type: |
duration |
|
| X |
- ReferencesReference 1: http://www.xbrl.org/2003/role/presentationRef
-Publisher SEC
-Name Form N-2
-Section Item 4
-Subsection 3
-Paragraph Instruction 1
Reference 2: http://www.xbrl.org/2003/role/presentationRef
-Publisher SEC
-Name Form N-2
-Section Item 4
-Subsection 1
-Paragraph Instruction 2
| Name: |
cef_SeniorSecuritiesNoteTextBlock |
| Namespace Prefix: |
cef_ |
| Data Type: |
dtr-types:textBlockItemType |
| Balance Type: |
na |
| Period Type: |
duration |
|
| X |
- ReferencesReference 1: http://www.xbrl.org/2003/role/presentationRef
-Publisher SEC
-Name Form N-2
-Section Item 4
-Subsection 3
| Name: |
cef_SeniorSecuritiesTableTextBlock |
| Namespace Prefix: |
cef_ |
| Data Type: |
dtr-types:textBlockItemType |
| Balance Type: |
na |
| Period Type: |
duration |
|
| X |
- DefinitionBoolean flag that is true when the XBRL content amends previously-filed or accepted submission.
| Name: |
dei_AmendmentFlag |
| Namespace Prefix: |
dei_ |
| Data Type: |
xbrli:booleanItemType |
| Balance Type: |
na |
| Period Type: |
duration |
|
| X |
- DefinitionFor the EDGAR submission types of Form 8-K: the date of the report, the date of the earliest event reported; for the EDGAR submission types of Form N-1A: the filing date; for all other submission types: the end of the reporting or transition period. The format of the date is YYYY-MM-DD.
| Name: |
dei_DocumentPeriodEndDate |
| Namespace Prefix: |
dei_ |
| Data Type: |
xbrli:dateItemType |
| Balance Type: |
na |
| Period Type: |
duration |
|
| X |
- DefinitionThe type of document being provided (such as 10-K, 10-Q, 485BPOS, etc). The document type is limited to the same value as the supporting SEC submission type, or the word 'Other'.
| Name: |
dei_DocumentType |
| Namespace Prefix: |
dei_ |
| Data Type: |
dei:submissionTypeItemType |
| Balance Type: |
na |
| Period Type: |
duration |
|
| X |
- DefinitionA unique 10-digit SEC-issued value to identify entities that have filed disclosures with the SEC. It is commonly abbreviated as CIK. Reference 1: http://www.xbrl.org/2003/role/presentationRef
-Publisher SEC
-Name Exchange Act
-Number 240
-Section 12
-Subsection b-2
| Name: |
dei_EntityCentralIndexKey |
| Namespace Prefix: |
dei_ |
| Data Type: |
dei:centralIndexKeyItemType |
| Balance Type: |
na |
| Period Type: |
duration |
|
| X |
- DefinitionOne of: N-1A (Mutual Fund), N-1 (Open-End Separate Account with No Variable Annuities), N-2 (Closed-End Investment Company), N-3 (Separate Account Registered as Open-End Management Investment Company), N-4 (Variable Annuity UIT Separate Account), N-5 (Small Business Investment Company), N-6 (Variable Life UIT Separate Account), S-1 or S-3 (Face Amount Certificate Company), S-6 (UIT, Non-Insurance Product). Reference 1: http://www.xbrl.org/2003/role/presentationRef
-Publisher SEC
-Name Regulation S-T
-Number 232
-Section 313
| Name: |
dei_EntityInvCompanyType |
| Namespace Prefix: |
dei_ |
| Data Type: |
dei:invCompanyType |
| Balance Type: |
na |
| Period Type: |
duration |
|
| X |
- DefinitionThe exact name of the entity filing the report as specified in its charter, which is required by forms filed with the SEC. Reference 1: http://www.xbrl.org/2003/role/presentationRef
-Publisher SEC
-Name Exchange Act
-Number 240
-Section 12
-Subsection b-2
| Name: |
dei_EntityRegistrantName |
| Namespace Prefix: |
dei_ |
| Data Type: |
xbrli:normalizedStringItemType |
| Balance Type: |
na |
| Period Type: |
duration |
|
| X |
- DefinitionNet asset value per share or per unit of investments in certain entities that calculate net asset value per share. Includes, but is not limited to, by unit, membership interest, or other ownership interest. Investment includes, but is not limited to, investment in certain hedge funds, venture capital funds, private equity funds, real estate partnerships or funds. Excludes fair value disclosure. Reference 1: http://www.xbrl.org/2003/role/exampleRef
-Topic 946
-SubTopic 830
-Name Accounting Standards Codification
-Section 55
-Paragraph 12
-Publisher FASB
-URI https://asc.fasb.org/1943274/2147479168/946-830-55-12
Reference 2: http://www.xbrl.org/2003/role/disclosureRef
-Topic 946
-SubTopic 210
-Name Accounting Standards Codification
-Section 45
-Paragraph 4
-Publisher FASB
-URI https://asc.fasb.org/1943274/2147477796/946-210-45-4
Reference 3: http://www.xbrl.org/2003/role/disclosureRef
-Topic 946
-SubTopic 205
-Name Accounting Standards Codification
-Section 50
-Paragraph 7
-Subparagraph (a)
-Publisher FASB
-URI https://asc.fasb.org/1943274/2147478494/946-205-50-7
Reference 4: http://www.xbrl.org/2003/role/disclosureRef
-Topic 946
-SubTopic 205
-Name Accounting Standards Codification
-Section 50
-Paragraph 7
-Subparagraph (h)
-Publisher FASB
-URI https://asc.fasb.org/1943274/2147478494/946-205-50-7
Reference 5: http://www.xbrl.org/2003/role/disclosureRef
-Topic 946
-SubTopic 505
-Name Accounting Standards Codification
-Section 50
-Paragraph 1
-Publisher FASB
-URI https://asc.fasb.org/1943274/2147478448/946-505-50-1
Reference 6: http://www.xbrl.org/2003/role/disclosureRef
-Topic 946
-SubTopic 210
-Name Accounting Standards Codification
-Section S99
-Paragraph 1
-Subparagraph (SX 210.6-04(19))
-Publisher FASB
-URI https://asc.fasb.org/1943274/2147479170/946-210-S99-1
Reference 7: http://www.xbrl.org/2003/role/disclosureRef
-Topic 946
-SubTopic 210
-Name Accounting Standards Codification
-Section S99
-Paragraph 2
-Subparagraph (SX 210.6-05(4))
-Publisher FASB
-URI https://asc.fasb.org/1943274/2147479170/946-210-S99-2
| Name: |
us-gaap_NetAssetValuePerShare |
| Namespace Prefix: |
us-gaap_ |
| Data Type: |
dtr-types:perShareItemType |
| Balance Type: |
na |
| Period Type: |
instant |
|
| X |
- DefinitionThe per share liquidation preference (or restrictions) of nonredeemable preferred stock (or preferred stock redeemable solely at the option of the issuer) that has a preference in involuntary liquidation considerably in excess of the par or stated value of the shares. The liquidation preference is the difference between the preference in liquidation and the par or stated values of the share. Reference 1: http://fasb.org/us-gaap/role/ref/legacyRef
-Topic 210
-SubTopic 10
-Name Accounting Standards Codification
-Section S99
-Paragraph 1
-Subparagraph (SX 210.5-02(28))
-Publisher FASB
-URI https://asc.fasb.org/1943274/2147480566/210-10-S99-1
Reference 2: http://www.xbrl.org/2009/role/commonPracticeRef
-Topic 235
-SubTopic 10
-Name Accounting Standards Codification
-Section S99
-Paragraph 1
-Subparagraph (SX 210.4-08(d))
-Publisher FASB
-URI https://asc.fasb.org/1943274/2147480678/235-10-S99-1
Reference 3: http://fasb.org/us-gaap/role/ref/legacyRef
-Name Accounting Standards Codification
-Topic 505
-SubTopic 10
-Section 50
-Paragraph 3
-Publisher FASB
-URI https://asc.fasb.org/1943274/2147481112/505-10-50-3
Reference 4: http://fasb.org/us-gaap/role/ref/legacyRef
-Name Accounting Standards Codification
-Topic 505
-SubTopic 10
-Section 50
-Paragraph 4
-Publisher FASB
-URI https://asc.fasb.org/1943274/2147481112/505-10-50-4
Reference 5: http://www.xbrl.org/2009/role/commonPracticeRef
-Topic 505
-SubTopic 10
-Name Accounting Standards Codification
-Section 50
-Paragraph 13
-Subparagraph (h)
-Publisher FASB
-URI https://asc.fasb.org/1943274/2147481112/505-10-50-13
| Name: |
us-gaap_PreferredStockLiquidationPreference |
| Namespace Prefix: |
us-gaap_ |
| Data Type: |
dtr-types:perShareItemType |
| Balance Type: |
na |
| Period Type: |
instant |
|
Grafico Azioni Tortoise Pipeline and En... (NYSE:TTP)
Storico
Da Gen 2025 a Feb 2025

Grafico Azioni Tortoise Pipeline and En... (NYSE:TTP)
Storico
Da Feb 2024 a Feb 2025

