
Goldshore Announces Inferred Mineral
Resource Estimate of 6.00Moz
Contained Gold at 1.02 g/t Au within 183.6Mt at the Moss Gold
Project
Shear Domain at the Moss Deposit increases
to 3.35Moz at 1.84 g/t Au within 56.5Mt
VANCOUVER, B.C., Canada -- May 8, 2023 -- InvestorsHub
NewsWire -- Goldshore Resources Inc.
(TSXV:
GSHR /
OTCQB: GSHRF / FWB: 8X00)
(“Goldshore” or the “Company”) is
pleased to announce an updated mineral resource estimate (the
“Moss MRE”) for the Moss deposit
(“Moss” or the “Moss Deposit”)
and a maiden mineral resource estimate (the “East
Coldstream MRE” and, together with the Moss MRE, the
“MRE”) for the East Coldstream deposit
(“East Coldstream” or the “East Coldstream
Deposit”), both located at its 100%-owned Moss Gold
Project in Northwest Ontario, Canada (the “Moss Gold
Project” or the “Project”).
- Moss Gold Project global inferred resource grows 44% to
6.00Moz at 1.02 g/t, within 183.6Mt
- Moss MRE grows with 24% more contained
gold ounces and 32% more tonnes from
4.17Moz Au in 121.7Mt (November 2022 mineral resource estimate) to
5.42Moz Au at 1.03 g/t Au within 163.6Mt (open pit
and underground).
- The shear domain has increased in contained metal and
tonnage from the November 2022 mineral resource estimate by 52% and
63%, respectively, to 3.35M oz
Au at 1.84 g/t Au within 56.5Mt
(open pit only).
- There is clear expansion potential over the 8km-long
belt through strike extensions (in both directions) and parallel
shears where gold mineralization has been intersected but
is sparsely drilled.
- East Coldstream MRE introduced at 580Koz at 0.91 g/t Au
in 20.0Mt (open pit and underground).
- Implied stripping ratios are 5.2:1 for Moss and 6.4:1
for East Coldstream.
- This resource increase implied by the Moss Gold Project
demonstrates the scale of the project and
the opportunity for a high-grade open-pit gold
project.
- Work is well underway on studies to support a
preliminary economic assessment (“PEA”) planned for later
this year.
- The Moss Gold Project is host to 29 additional targets
over a 35 km trend, which the Company continues to
evaluate, and prioritize for future drill campaigns.
- The Company has incurred discovery costs of
approximately CAD$10 per ounce of inferred Au resource
(all-in) including acquisition costs and overheads. This can also
be measured as approximately 76 ounces Au per meter
drilled (all-in costs included) in the 78,000 meters
drilled to date.
Summary of the MRE
Open-Pit and Underground Constrained Inferred MRE for
the Moss Deposit and East Coldstream Deposit with an Effective Date
of May 5, 2023:
|
Moss Open Pit
|
|
Inferred Resources
|
Tonnes
|
Grade
|
Contained Metal
|
|
(Domains)
|
(Mt)
|
(g/t Au)
|
(Moz Au)
|
|
Shear
|
56.5
|
1.84
|
3.35
|
|
Intrusion
|
104.5
|
0.55
|
1.83
|
|
Total
|
161.0
|
1.00
|
5.18
|
|
Moss Underground
|
|
Inferred Resources
|
Tonnes
|
Grade
|
Contained Metal
|
|
(Domains)
|
(Mt)
|
(g/t Au)
|
(Moz Au)
|
|
All
|
2.6
|
2.90
|
0.24
|
|
Total
|
2.6
|
2.90
|
0.24
|
|
East Coldstream Open Pit
|
|
Inferred Resources
|
Tonnes
|
Grade
|
Contained Metal
|
|
(Domains)
|
(Mt)
|
(g/t Au
|
(Moz Au)
|
|
All
|
19.8
|
0.89
|
0.57
|
|
Total
|
19.8
|
0.89
|
0.57
|
|
East Coldstream Underground
|
|
Inferred Resources
|
Tonnes
|
Grade
|
Contained Metal
|
|
(Domains)
|
(Mt)
|
(g/t Au
|
(Moz Au)
|
|
All
|
0.2
|
2.24
|
0.01
|
|
Total
|
0.2
|
2.24
|
0.01
|
|
Grand Total
|
183.6
|
1.02
|
6.00
|
Note: Based on a US$1,650 per ounce
gold price and economic cut-off grade of 0.35 g/t Au for open pit
and 2.07 g/t Au and 2.00 g/t Au for underground resources (Moss and
East Coldstream, respectively). Please review “Notes to
Accompany Moss MRE” and “Notes to Accompany East Coldstream MRE”
for additional information.
President and CEO Brett Richards stated: “This announcement
is an important milestone for Goldshore and the Moss Gold
Project. We are pleased with the results of the MRE, as it
illustrates the size, scale, and potential of the Moss Gold Project
that we have been communicating for the past many months. This
important step in the development of the Project will now shift to
commencing a PEA by putting a mining project around the resource
with the goal of understanding the economic outputs.
Today’s MRE is a first step towards understanding a
potential first phase of the Moss Gold Project, as we believe it
represents only a small portion of the mineralization or potential
mineralization on our land package. We still have 29
additional targets to drill test, including several gold targets,
but also 4 interesting base metal and battery mineral
targets.
We will now start to run scenario planning for the PEA with
respect to how we construct a Phase 1 project of a clearly larger
mineral resource, while investigating various leaching
methodologies, including heap leach. When we have a clear
picture of the scope of the PEA, we will guide the market as to
when we believe the results of it will be available to the
market.”
Notes to Accompany Moss MRE
- Numbers have been rounded to reflect the precision of an
inferred mineral resource estimate. Totals may vary due to
rounding.
- Estimation has been completed within the two separate reported
geological domains: a higher-grade shear domain which occurs within
a larger lower-grade intrusive domain; modelling of domain
boundaries has considered both geology and grade.
- Gold cut-off for open pit has been calculated based on a gold
price of US$1,650/oz, mining costs of US$2.70 per tonne, processing
costs of US$12.50 per tonne, and mine-site administration costs of
US$2.50 per tonne processed. Metallurgical recoveries of 92.5% are
based on prior metallurgical test work.
- Gold cut-off for underground MSO shapes have been calculated
based on a gold price of US$1,650/oz, mining costs of US$86.25 per
tonne, processing costs of US$12.50 per tonne, and mine-site
administration costs of US$2.50 per tonne processed. Metallurgical
recoveries of 92.5% are based on prior metallurgical test
work.
- An economic cut-off grade of 0.35 g/t Au was applied to
mineralized rock in the optimized open pit for processing
determination.
- Mineral Resources conform to NI 43-101, and the 2019 CIM
Estimation of Mineral Resources & Mineral Reserves Best
Practice Guidelines and 2014 CIM Definition Standards for Mineral
Resources & Mineral Reserves.
- Neither the qualified person nor the Company are aware of any
environmental, permitting, legal, title, taxation, socio-economic,
marketing, or political factors that might materially affect the
Moss MRE.
- Mineral resources are not mineral reserves as they do not have
demonstrated economic viability. The quantity and grade of reported
inferred resources in the MRE are uncertain in nature and there has
been insufficient exploration to define these inferred resources as
indicated and/or measured resources. The Company will continue
exploration intended to upgrade the inferred mineral resources to
indicated mineral resources.
Notes to Accompany East Coldstream MRE
- Numbers have been rounded to reflect the precision of the
inferred mineral resource estimates. Totals may vary due to
rounding.
- Estimation has been completed within two geological zones: a
strongly altered higher-grade shear zone surrounded by a
lower-grade domain; modelling of domain boundaries has considered
both geology and grade.
- Gold cut-off has been calculated based on a gold price of
US$1,650/oz, mining costs of US$2.70 per tonne, processing costs of
US$12.50 per tonne, and mine-site administration costs of US$2.50
per tonne processed. Metallurgical recoveries of 96.5% are based on
prior metallurgical test work.
- Gold cut-off for underground MSO shapes have been calculated
based on a gold price of US$1,650/oz, mining costs of US$86.25 per
tonne, processing costs of US$12.50 per tonne, and mine-site
administration costs of US$2.50 per tonne processed. Metallurgical
recoveries of 96.5% are based on prior metallurgical test
work.
- An economic cut-off grade of 0.35 g/t Au was applied to
mineralized rock in the optimized open pit for processing
determination.
- Mineral Resources conform to NI 43-101, and the 2019 CIM
Estimation of Mineral Resources & Mineral Reserves Best
Practice Guidelines and 2014 CIM Definition Standards for Mineral
Resources & Mineral Reserves.
- Neither the qualified person nor the Company are aware of any
environmental, permitting, legal, title, taxation, socio-economic,
marketing, or political factors that might materially affect the
East Coldstream MRE.
- Mineral resources are not mineral reserves as they do not have
demonstrated economic viability. The quantity and grade of reported
inferred resources in the East Coldstream MRE are uncertain in
nature and there has been insufficient exploration to define these
inferred resources as Indicated and/or measured resources. The
Company will continue exploration intended to upgrade the inferred
mineral resources to indicated mineral resources.
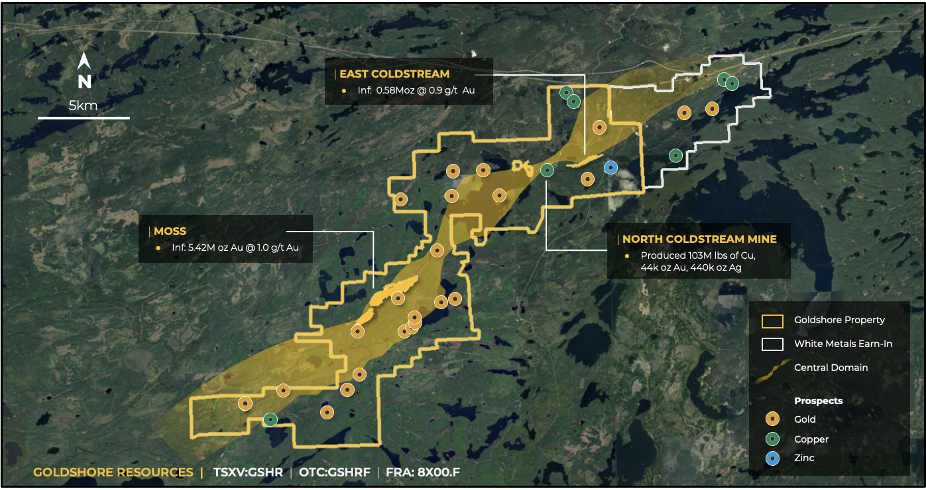
Figure 1: Location of Moss Deposit
and East Coldstream Deposit in the Moss Gold Project
Technical Overview
Details of the MRE will be provided in a technical report with
an effective date of May 5, 2023, prepared in accordance with
National Instrument 43-101 (“NI 43-101”)
standards, which will be filed under the Company’s SEDAR profile
within 45 days of this news release. The MRE was prepared by
independent mining consulting firm CSA Global Canada (“CSA
Global”), a division of ERM Consultants Canada Ltd., in
accordance with the Canadian Institute of Mining, Metallurgy and
Petroleum (“CIM”) Definition Standards on Mineral
Resources and Reserves (2014).
Additional Exploration Potential
The modelled shear and intrusion domains extend to much greater
depth below the optimized open pit constraining the reported Moss
MRE. The shears are also open along strike, beyond the modelled
strike length of 3.6 km. Historical drilling has intercepted gold
mineralization over a total strike length of 8 km, which has been a
focus of Goldshore’s summer soil geochemistry and structural
mapping programs. Furthermore, there remains potential for
additional parallel shears with gold mineralization in historical
drill holes 500 m to the southeast of the Moss Deposit.
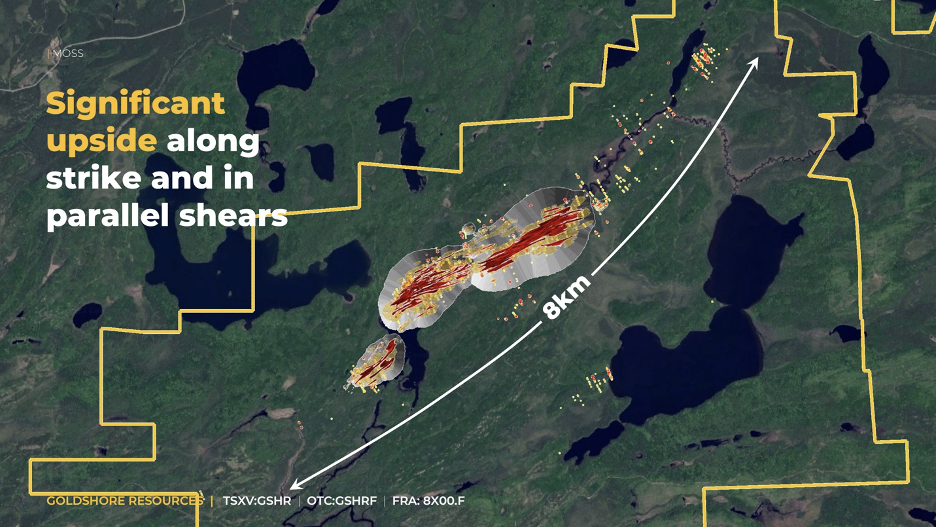
Figure 2: Upside along strike and
through parallel shears at the Moss Deposit
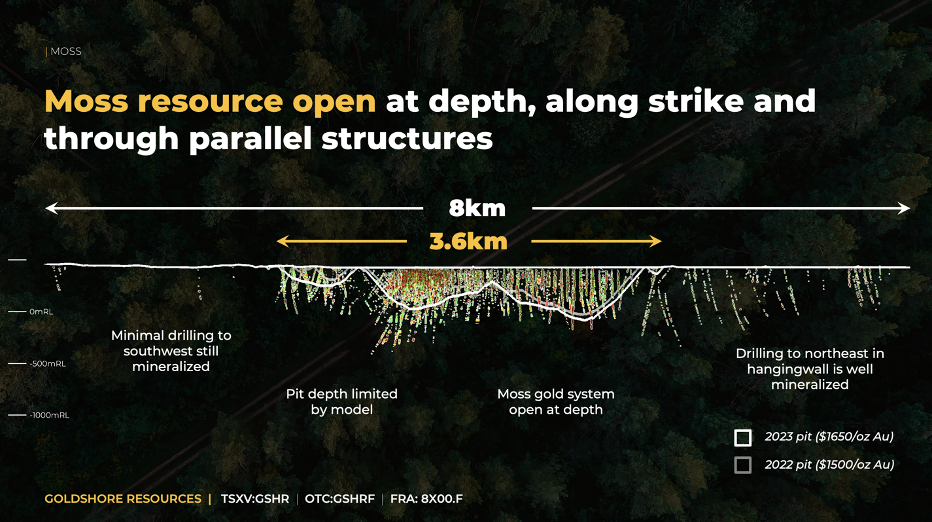
Figure 3: Long section at the Moss
Deposit showing gold mineralization in drillholes along strike and
at depth looking northwest
Moss Deposit Geology and Model
The Moss Deposit is a structurally controlled gold deposit
within the greenstone terrain of the Archean Superior Province.
Mineralization is localized where the major NE-trending Wawiag
Fault Zone cuts a dioritic to granodioritic intrusion complex. The
deposit is defined by a series of anastomosing centimeter- to
meter-scale NE-trending shear zones carrying higher-grade gold
mineralization, and lower-grade gold mineralization associated with
weaker shearing and a more brittle-style deformation and veining in
the intrusion rock mass and adjacent wall rocks between the shear
zones. Mineralization is associated with pyrite, sericite and
chlorite alteration and millimeter- to centimeter-scale irregular
quartz-carbonate veinlets.
Detailed geological logging and multi-element geochemical
analysis of drill core from 120 new holes total 68,802m from the
2021-23 drilling has supported modelling of discrete shear domains
within the larger altered and variably mineralized intrusion
domain, which includes adjacent volcanic wall rocks. The shear
domains have a different higher-grade gold population to the
low-grade intrusion domain and these domains have been estimated
separately using different search parameters. Importantly, this
allows a more accurate representation of the true grade variability
within the deposit than has been achieved in previous
estimates.
CSA Global was provided with the wireframes for resource
estimation by Goldshore. Goldshore modelled the shear zones domain
using a combination of geological features, including core
orientation data, and raw assay values above 1 g/t Au using
explicit digitizing methods in Micromine 3D geological modelling
software. CSA Global modelled the intrusion domain using implicit
modelling techniques in Leapfrog using a cut-off grade of 0.20 g/t
Au in 15-meter downhole composites. Statistical and
geostatistical assessment of 1 m composites confirmed that the
shear domains should be estimated within hard boundaries separating
them from the intrusion domain. Statistical analysis was used to
determine high-grade capping for each shear zone wireframe and
ranged from 30 to 60 g/t Au.
The Moss MRE was estimated with a block size of 9 x 9 x 3 m
utilizing subblocks and constrained within wireframes with a
minimum width of 3 x 3 x 1 m. Gold content was estimated using
ordinary kriging methods using dynamic anisotropy variogram models.
Mineral resources are presented as undiluted and in situ. The
historical underground voids from Noranda’s 1980’s exploration
program have been removed from the geological model.
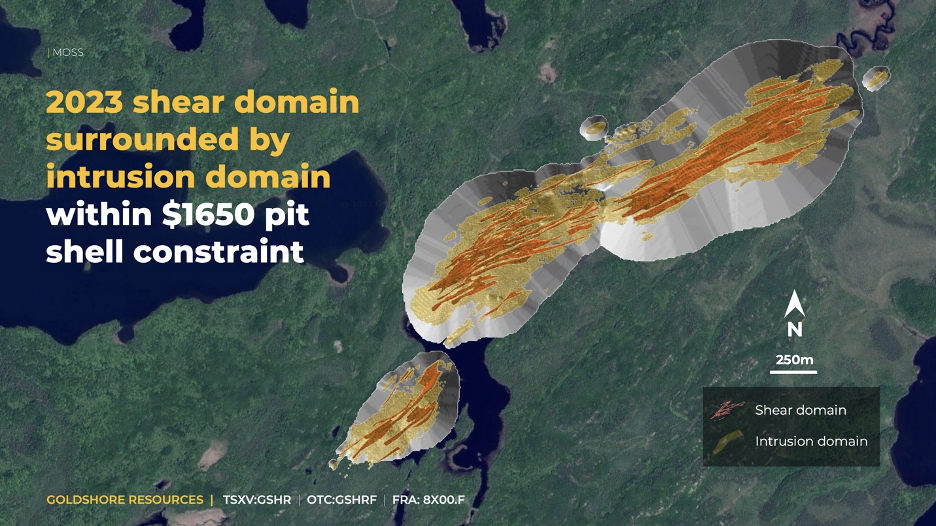
Figure 4: Moss Deposit resource
model within the US$1650 pit shell
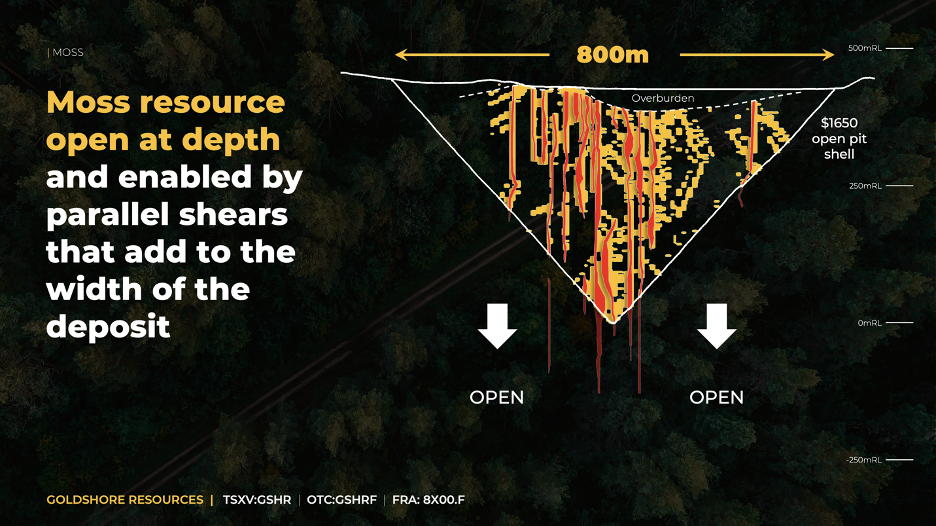
Figure 5: Typical cross section
through the Moss Deposit
East Coldstream Deposit Geology and Model
The East Coldstream Deposit is a structurally controlled gold
deposit located approximately 15 km northeast of the Moss Deposit
within the Moss Gold Project area. The East Coldstream Deposit’s
mineralized zones are located on the south margin of a shear zone
which separates a gabbroic intrusion to the north from a
mafic-intermediate volcanic suite to the south. Mineralization is
found within sheared volcanic units, proximal to sills of quartz
and quartz-feldspar porphyries and distinctive, brick-red syenites.
The mineralized zones show silica, carbonate, and hematite
alteration. Mineralization consists of fine disseminations of
pyrite and lesser chalcopyrite throughout the silica-hematite zones
as well as within quartz-carbonate veinlets. Iron carbonate is
present in areas proximal to strong silicification. The two main
mineralized zones have been cut by a north-south-trending diabase
dike.
Sixteen new drill holes, totaling 7,973 m, were drilled in the
East Coldstream Deposit to gather the required geological
understanding of the deposit. Mineralization was modeled by CSA
Global guided by alteration wireframes provided by Goldshore.
Implicit modelling techniques were utilized in wireframing a
NE-trending shear zones carrying higher-grade gold mineralization
which is subdivided into two parallel domains (Z-2 and Z-4), and
two satellite subparallel lenses (Z-1 and Z-3). A lower grade
wireframe was developed surrounding the shear zone domains
representing mineralization associated with more brittle-style
veining in the felsic to intermediate metavolcanic rocks, gabbros,
and porphyries between the main shear zones.
Exploratory data analysis was used to determine high-grade
capping for composites of two of the shear zones, with top cuts
ranging from 13 to 15 g/t Au. The East Coldstream MRE was estimated
with a block size of 6 x 6 x 6 m utilizing sub-blocks and
constrained within wireframes with a minimum width of 3 x 3 x 3
m. Gold content was estimated using ordinary kriging methods
using dynamic anisotropy and informed by variogram models. Mineral
Resources are presented as undiluted and in situ.
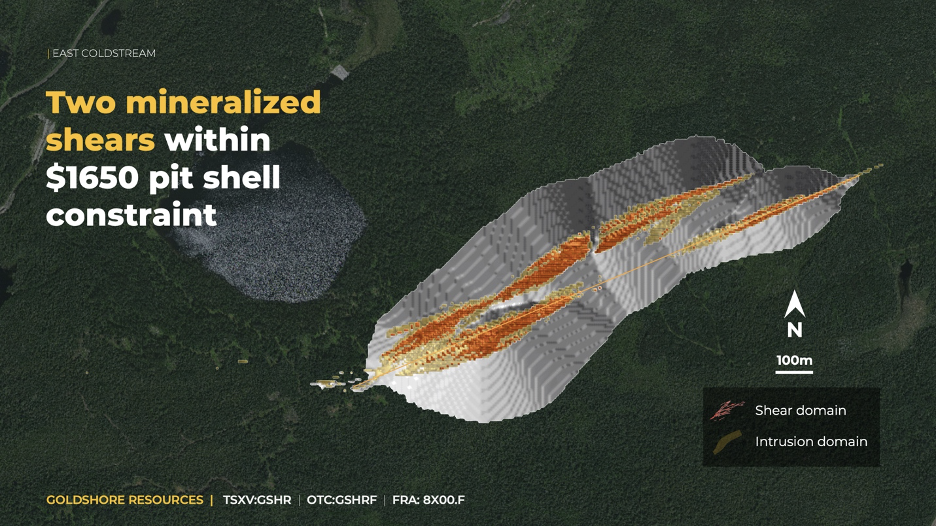
Figure 6: East Coldstream Deposit
resource within the US$1650 open pit shell
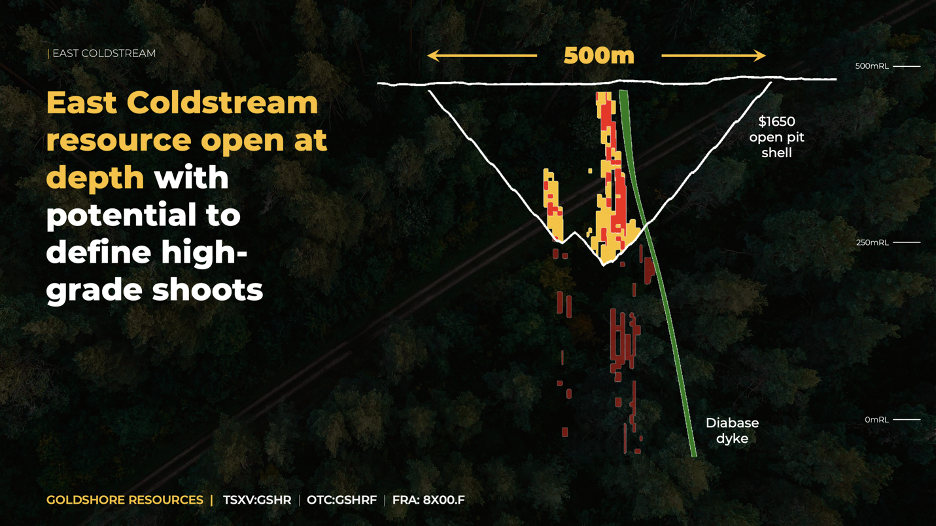
Figure 7: Typical cross section
through East Coldstream Deposit
Drill Hole Data and QA/QC
Procedures
The Moss Deposit has been evaluated by several diamond drill
programs since the 1970s and earlier. The greatest number of drill
holes were completed between 1986 and early 1992 by Tandem/Storimin
and Noranda Inc. (311 drill holes for 86,196 meters). A smaller
drilling program in 2008 served to validate the older data and lead
to the completion of the historical resource estimate by Moss Gold
Mines Ltd. in 2013.
The East Coldstream Deposit has been evaluated by several
diamond drill programs since 1987. Most of the historic drilling
was conducted between 2010 and 2011 by Foundation Resources who
completed total of 66 diamond drillholes in the Coldstream deposit,
totaling 16,988 m.
There are little documented QA/QC procedures or data available
for programs prior to 2008.
The ongoing Goldshore drilling program utilizes full
industry-standard survey control and QAQC programs and is designed
to systematically redrill the deposits and validate as much of the
historical drilling as possible through collar surveys, re-logging,
and re-sampling.
Mineral Resource Classification
The Moss MRE has been classified as an inferred mineral
resource. This resource classification reflects the fact that much
of the drill hole data used for the resource estimate is
historical, and no QA/QC data or reports exist for the majority of
these drill holes. Statistical assessment of historical data and
recent data provided some support for the historical data, but also
included some inconsistencies. Goldshore’s planned program of
infill and confirmatory drilling is expected to support
classification of indicated mineral resource in subsequent mineral
resource updates.
Reasonable Prospects for Eventual Economic
Extraction
To support reasonable prospects for eventual economic extraction
for the MRE, CSA Global used the estimated block model to generate
an optimized open pit using Datamine NPV Scheduler software and the
following assumptions: a gold price of US$1,650/oz, plant recovery
of 92.5% and 96.5% for Moss Deposit and the East Coldstream
Deposit, respectively; processing costs of US$12.50/tonne,
mine-site general and administration costs of US$2.50/tonne
processed, mining costs of US$2.70/tonne moved, and an overall pit
slope angle of 50 degrees. NPV Scheduler Software is widely used by
mining engineers to apply the Lerchs-Grossman algorithm to block
models in order to generate optimized pit shells upon which
economic open pit mine designs may be based.
The MRE is are constrained within the selected optimized pit
shells which reach a maximum depth of approximately 450m and 250m
in the Moss Deposit and East Coldstream Deposit, respectively.
Next Steps
In late 2022, Goldshore commenced an extensive program of
relogging and resampling of all historical drill holes whose
collars have been located and accurately surveyed. Where possible,
these drill holes are also being surveyed using modern downhole
surveying equipment. Resampling of historical drill core is
ongoing, although most core blocks are now illegible rendering
resampling impossible.
Pete Flindell, VP Exploration for Goldshore, said “this MRE
has highlighted the larger scale of gold mineralization on the Moss
Gold Project. It remains conservative in many areas because of the
concerns over historical drill data and we look forward to updating
the quality and quantity of the mineral resource inventory
following a comprehensive infill drill program. In the meantime,
our field programs continue to develop our better exploration
targets with the potential to add significantly to our resource
base. At the same time, we will be working on the PEA, which will
optimize and evaluate the many mining and milling options available
to us. These include a high recovery flotation-regrind-leach mill
process, potential heap leaching of low-grade mineralization and
mining at different scales to maximize gold grades fed to the
mill.”
Qualified Person Statements
Dr. Matthew Field (Pr. Sci. Nat), Manager – Resources at CSA
Global is an independent “qualified person” under NI 43-101 and
responsible for the MRE. Dr. Field has prepared and approved the
scientific and technical information related to the MRE contained
in this news release.
Peter Flindell, P.Geo., MAusIMM, MAIG, Vice President –
Exploration of the Company, and a “qualified person” under NI
43-101 has also reviewed and approved the scientific and technical
information contained in this news release.
About Goldshore
Goldshore is an emerging junior gold development company, and
owns the Moss Gold Project located in Ontario. Wesdome Gold Mines
Ltd. is currently a large shareholder of Goldshore. Supported
by an industry-leading management group, board of directors and
advisory board, Goldshore is positioned to advance the Moss Gold
Project through the next stages of exploration and development.
Neither the TSXV nor its Regulation Services Provider (as
that term is defined in the policies of the TSXV) accepts
responsibility for the adequacy or accuracy of this
release.
For More Information – Please Contact:
Brett A. Richards
President, Chief Executive Officer and Director
Goldshore Resources Inc.
P. +1 604 288
4416
M. +1 905 449 1500
E. brichards@goldshoreresources.com
W. www.goldshoreresources.com
Facebook: GoldShoreRes |
Twitter: GoldShoreRes |
LinkedIn: goldshoreres
Cautionary Note Regarding Forward-Looking
Statements
This news release contains statements that constitute
“forward-looking statements.” Such forward looking statements
involve known and unknown risks, uncertainties and other factors
that may cause the Company’s actual results, performance or
achievements, or developments to differ materially from the
anticipated results, performance or achievements expressed or
implied by such forward-looking statements. Forward looking
statements are statements that are not historical facts and are
generally, but not always, identified by the words “expects,”
“plans,” “anticipates,” “believes,” “intends,” “estimates,”
“projects,” “potential” and similar expressions, or that events or
conditions “will,” “would,” “may,” “could” or “should” occur.
Forward-looking statements in this news release include, among
others, statements relating to expectations regarding the
exploration and development of the Project, the filing of a
technical report supporting the MRE, commencement of a preliminary
economic assessment and prefeasibility study, and other statements
that are not historical facts. By their nature, forward-looking
statements involve known and unknown risks, uncertainties and other
factors which may cause our actual results, performance or
achievements, or other future events, to be materially different
from any future results, performance or achievements expressed or
implied by such forward-looking statements. Such factors and risks
include, among others: the Company may require additional financing
from time to time in order to continue its operations which may not
be available when needed or on acceptable terms and conditions
acceptable; compliance with extensive government regulation;
domestic and foreign laws and regulations could adversely affect
the Company’s business and results of operations; the stock markets
have experienced volatility that often has been unrelated to the
performance of companies and these fluctuations may adversely
affect the price of the Company’s securities, regardless of its
operating performance; the impact of COVID-19; the ongoing military
conflict in Ukraine; and other risk factors outlined in the
Company’s public disclosure documents.
The forward-looking information contained in this news release
represents the expectations of the Company as of the date of this
news release and, accordingly, is subject to change after such
date. Readers should not place undue importance on forward-looking
information and should not rely upon this information as of any
other date. The Company undertakes no obligation to update these
forward-looking statements in the event that management's beliefs,
estimates or opinions, or other factors, should change.
Grafico Azioni Goldshore Resources (QB) (USOTC:GSHRF)
Storico
Da Nov 2024 a Dic 2024

Grafico Azioni Goldshore Resources (QB) (USOTC:GSHRF)
Storico
Da Dic 2023 a Dic 2024
