Commodity Currencies Fall Amid Risk Aversion
30 Maggio 2024 - 6:16AM
RTTF2
The commodity currencies such as Australia, the New Zealand and
the Canadian dollars weakened against their major currencies in the
Asian session on Thursday amid risk aversion, following the broadly
negative cues from global markets overnight, as bond yields
continued to spike amid uncertainty about the U.S. Fed's
interest-rate moves ahead of key inflation data later in the
week.
The report on U.S. personal income and spending in the month of
April, due on Friday, includes readings on inflation said to be
preferred by the U.S. Fed. There are concerns the Fed might keep
interest rates higher for longer at the next monetary policy
meeting on June 11-12 in the event of U.S. inflation readings
coming in hotter than expected.
Weakness across most sectors led by mining, energy and
technology stocks, also weighed on the investor sentiment.
Crude oil prices fell on concerns about the outlook for interest
rates, and the likely adverse impact high borrowing costs will have
on energy demand. West Texas Intermediate Crude oil futures for
July sank $0.60 at $79.23 a barrel.
In the Asian trading today, the Australian dollar fell to 6-day
lows of 0.6600 against the U.S. dollar and 103.81 against the yen,
from yesterday's closing quotes of 0.6611 and 104.18, respectively.
If the aussie extends its downtrend, it is likely to find support
around 0.64 against the greenback and 101.00 against the yen.
Against the euro and the Canadian dollar, the aussie edged down
to 1.6354 and 0.9060 from Wednesday's closing quotes of 1.6334 and
0.9066, respectively. On the downside, 1.65 against the euro and
0.89 against the loonie is seen as the support levels for the
aussie.
The NZ dollar fell to 6-day lows of 0.6100 against the U.S.
dollar and 95.87 against the yen, from yesterday's closing quotes
of 0.6107 and 96.40, respectively. If the kiwi extends its
downtrend, it is likely to find support around 0.59 against the
greenback and 92.00 against the yen.
Against the euro and the Australian dollar, the kiwi edged down
to 1.7698 and 1.0832 from Wednesday's closing quotes of 1.7659 and
1.0806, respectively. The next possible downside target for the
kiwi is seen around 1.79 against the euro and 1.10 against the
aussie.
The Canadian dollar fell to 6-day low of 1.3728 against the U.S.
dollar and 114.41 against the yen, from yesterday's closing quotes
of 1.3714 and 114.91. respectively. If the loonie extends its
downtrend, it is likely to find support around 1.38 against the
greenback and 112.00 against the yen.
Against the euro, the looie edges down to 1.4821 from
Wednesday's closing value of 1.4815. The loonie may test support
near the 1.50 region.
Meanwhile, the safe-haven currencies such as the Japanese yen
and the U.S. dollar fell against their major currencies in the
Asian session today amid risk aversion.
The yen rose to a 1-week high of 169.47 against the euro and a
6-day high of 199.31 against the pound, from yesterday's closing
quotes of 170.25 and 200.19, respectively. If the yen extends its
uptrend, it is likely to find resistance around against the 166.00
against the euro and 197.00 against the pound.
Against the U.S. dollar and the Swiss franc, the yen edged up to
157.05 and 172.09 from Wednesday's closing quotes of 157.60 and
172.59, respectively. The yen is likely to find resistance around
154.00 against the greenback and 171.00 against the franc.
The U.S. dollar rose to more than a 2-week high of 1.0789
against the euro and a 6-day high of 1.2689 against the pound, from
yesterday's closing quotes of 1.0800 and 1.2707, respectively. If
the greenback extends its uptrend, it is likely to find resistance
around 1.06 against the euro and 1.25 against the pound.
Looking ahead, Eurozone economic sentiment for May and
unemployment data for April are due to be released in the European
session at 5:00 am ET.
In the New York session, Canada average weekly earnings for
March and current account for the first quarter, U.S. GDP data for
the first quarter, weekly jobless claims data, trade balance data
for April, pending home sales data for April and U.S. EIA crude oil
data are slated for release.
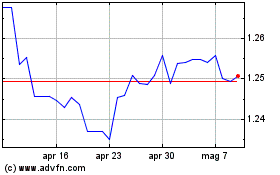
Grafico Cross Sterling vs US Dollar (FX:GBPUSD)
Da Mag 2024 a Giu 2024

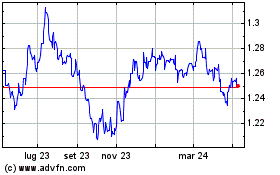
Grafico Cross Sterling vs US Dollar (FX:GBPUSD)
Da Giu 2023 a Giu 2024
