J & J Snack Foods Corp. (NASDAQ:JJSF) today announced record
sales and increased earnings for its second quarter and six months
ended March 27, 2010.
Sales increased 5% to $157.4 million from $149.4 million in last
year's second quarter. Net earnings increased 24% to $9.0 million
from $7.2 million last year. Earnings per diluted share were $.48
for the March quarter compared to $.39 last year. Operating income
increased 25% to $14.9 million this year from $11.9 million in the
year ago period.
For the six months ended March 27, 2010, sales increased 5% to $
306.5 million from $290.5 million in last year’s first half. Net
earnings increased 39% to $16.1 million in the six months from
$11.6 million last year. Earnings per diluted share were $.86 for
the six months compared to $.62 last year. Operating income
increased 41% to $26.3 million from $18.7 million in the year ago
period.
Gerald B. Shreiber, J & J’s President and Chief Executive
Officer, commented, “Strong performances by our food service and
retail supermarket groups contributed to our record quarter. Our
management team continues to strengthen and our innovation efforts
are being increased. Despite the current challenges in the economy,
we are optimistic for the future.”
J & J Snack Foods Corp.’s principal products include
SUPERPRETZEL, PRETZEL FILLERS and other soft pretzels, ICEE, SLUSH
PUPPIE and ARCTIC BLAST frozen beverages, LUIGI’S, MAMA TISH’S,
SHAPE UPS, MINUTE MAID* and BARQ’S** frozen juice bars and ices,
WHOLE FRUIT sorbet, FRUIT-A-FREEZE frozen fruit bars, MARY B’S
biscuits and dumplings, DADDY RAY’S fig and fruit bars, TIO PEPE’S
churros, THE FUNNEL CAKE FACTORY funnel cakes, and MRS. GOODCOOKIE,
CAMDEN CREEK, COUNTRY HOME and READI-BAKE cookies. J & J has
manufacturing facilities in Pennsauken, Bridgeport and Bellmawr,
New Jersey; Scranton, Hatfield and Chambersburg, Pennsylvania;
Carrollton, Texas; Atlanta, Georgia; Moscow Mills, Missouri;
Pensacola, Florida and Vernon and Newport, California.
*MINUTE MAID is a registered trademark of The Coca-Cola
Company.**BARQ’S is a registered trademark of Barq’s Inc.
Consolidated Statement of Operations
Three Months Ended
Six
Months Ended
March 27, March 28, March 27, March 28, 2010 2009
2010 2009 (in thousands) Net sales $ 157,361 $ 149,352 $
306,463 $ 290,494 Cost of goods sold 107,564 103,975
210,647 204,435 Gross profit 49,797 45,377 95,816
86,059 Operating expenses 34,977 33,497 69,505
67,348 Operating income 14,820 11,880 26,311 18,711 Other
income 198 270 481 702
Earnings before income taxes
15,018 12,150 26,792 19,413 Income taxes 6,018 4,906
10,701 7,850 Net earnings $ 9,000 $ 7,244 $ 16,091 $
11,563 Earnings per diluted share $ .48 $ .39 $ .86 $ .62
Earnings per basic share $ .49 $ .39 $ .87 $ .62
Weighted average number of diluted
shares
18,666 18,618 18,691 18,696
Weighted average number of basic
shares
18,477 18,425 18,510 18,520
Consolidated Balance Sheets
March 27, 2010
September 26, 2009
(unaudited)
(in thousands)
Cash & cash equivalents $ 60,003 $ 60,343 Current
marketable securities held to maturity 30,460 38,653 Other current
assets 119,070 112,115 Property, plant & equipment, net 99,203
97,173 Goodwill 60,314 60,314 Other intangible assets, net 46,930
49,125 Long-term marketable securities held to maturity 26,345
19,994 Other 1,899 2,110 Total $ 444,224 $ 439,827
Current liabilities $ 63,981 $ 67,679 Long-term obligations
under capital leases 236 285 Deferred income taxes 27,033 27,033
Other long-term liabilities 1,936 1,986 Stockholders’ equity
351,038 342,844 Total $ 444,224 $ 439,827
The forward-looking statements contained herein are subject to
certain risks and uncertainties that could cause actual results to
differ materially from those projected in the forward-looking
statements. Readers are cautioned not to place undue reliance on
these forward-looking statements, which reflect management’s
analysis only as of the date hereof. The Company undertakes no
obligation to publicly revise or update these forward-looking
statements to reflect events or circumstances that arise after the
date hereof.
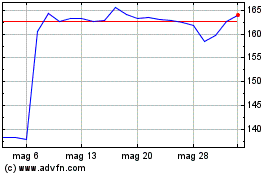
Grafico Azioni J and J Snack Foods (NASDAQ:JJSF)
Storico
Da Giu 2024 a Lug 2024

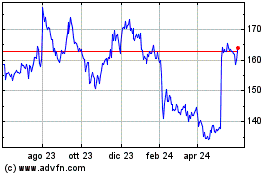
Grafico Azioni J and J Snack Foods (NASDAQ:JJSF)
Storico
Da Lug 2023 a Lug 2024
