J & J Snack Foods Corp. (NASDAQ:JJSF) today announced record
sales and earnings for its third quarter and nine months ended June
26, 2010.
Sales for the third quarter increased 6% to $189.7 million from
$179.8 million in last year's third quarter. Net earnings increased
6% to $15.9 million from $14.9 million last year. Earnings per
diluted share were $.85 for the June quarter compared to $.80 last
year. Operating income increased 7% to $26.1 million this year from
$24.4 million in the year ago period.
For the nine months ended June 26, 2010, sales increased 6% to
$496.2 million from $470.3 million in last year's nine months. Net
earnings increased 21% to $32.0 million in the nine months from
$26.5 million last year. Earnings per diluted share were $1.71 for
the nine months compared to $1.42 last year. Operating income
increased 22% to $52.4 million from $43.1 million in the year ago
period.
Gerald B. Shreiber, J & J’s President and Chief Executive
Officer, commented: “All of our business groups, led by our ICEE
beverage and supermarket businesses, contributed to our record
setting sales performance. In a difficult economy, we were able to
continue to grow our business.”
J & J Snack Foods Corp.’s principal products include
SUPERPRETZEL, PRETZEL FILLERS and other soft pretzels, ICEE, SLUSH
PUPPIE and ARCTIC BLAST frozen beverages, LUIGI’S, MAMA TISH’S,
SHAPE UPS, MINUTE MAID* and BARQ’S** frozen juice bars and ices,
WHOLE FRUIT sorbet, FRUIT-A-FREEZE frozen fruit bars, MARY B’S
biscuits and dumplings, DADDY RAY’S fig and fruit bars, TIO PEPE’S
and CALIFORNIA CHURROS churros, THE FUNNEL CAKE FACTORY funnel
cakes, and MRS. GOODCOOKIE, CAMDEN CREEK, COUNTRY HOME and
READI-BAKE cookies. J & J has manufacturing facilities in
Pennsauken, Bridgeport and Bellmawr, New Jersey; Scranton, Hatfield
and Chambersburg, Pennsylvania; Carrollton, Texas; Atlanta,
Georgia; Moscow Mills, Missouri; Pensacola, Florida and Vernon and
Norwalk, California.
*MINUTE MAID is a registered trademark of The Coca-Cola
Company.
**BARQ’S is a registered trademark of Barq’s Inc.
Unaudited Consolidated Statement of
Operations
Three Months Ended
Nine Months Ended
June 26, June 27, June 26, June 27,
2010
2009
2010
2009
(in thousands) Net sales $ 189,729 $ 179,761 $ 496,192 $ 470,255
Cost of goods sold 124,698 118,727 335,345
323,162 Gross profit 65,031 61,034 160,847 147,093 Operating
expenses 38,969 36,654 108,474 104,002
Operating income 26,062 24,380 52,373 43,091 Other income
236 263 717 965 Earnings before income taxes
26,298 24,643 53,090 44,056 Income taxes 10,437 9,714
21,138 17,564 Net earnings $ 15,861 $ 14,929 $ 31,952
$ 26,492 Earnings per diluted share $ .85 $ .80 $ 1.71 $
1.42 Earnings per basic share $ .86 $ .81 $ 1.73 $ 1.43 Weighted
average number of diluted shares 18,731 18,698 18,705 18,697
Weighted average number of basic shares 18,529 18,480 18,516 18,507
Consolidated Balance Sheets
June 26, 2010
September 26, 2009
(Unaudited)
(in thousands) Cash & cash equivalents $ 54,293 $ 60,343
Current marketable securities held to maturity 26,865 38,653 Other
current assets 125,504 112,115 Property, plant & equipment, net
103,718 97,173 Goodwill 70,070 60,314 Other intangible assets, net
56,577 49,125 Long-term marketable securities held to maturity
28,322 19,994 Other 1,893 2,110 Total $ 467,242 $
439,827 Current liabilities $ 72,689 $ 67,679 Long-term
obligations under capital leases 211 285 Deferred income taxes
27,033 27,033 Other long-term liabilities 1,983 1,986 Stockholders’
equity 365,326 342,844 Total $ 467,242 $ 439,827
The forward-looking statements contained herein are subject to
certain risks and uncertainties that could cause actual results to
differ materially from those projected in the forward-looking
statements. Readers are cautioned not to place undue reliance on
these forward-looking statements, which reflect management’s
analysis only as of the date hereof. The Company undertakes no
obligation to publicly revise or update these forward-looking
statements to reflect events or circumstances that arise after the
date hereof.
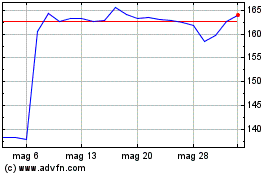
Grafico Azioni J and J Snack Foods (NASDAQ:JJSF)
Storico
Da Giu 2024 a Lug 2024

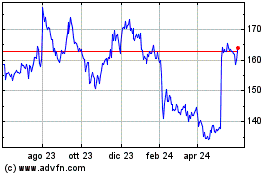
Grafico Azioni J and J Snack Foods (NASDAQ:JJSF)
Storico
Da Lug 2023 a Lug 2024
