Capital One Beats Earnings on Lower Expense - Analyst Blog
17 Aprile 2014 - 4:00PM
Zacks
Lower expenses and a rise in fee income drove Capital
One Financial Corp.’s (COF) first-quarter 2014 earnings of
$1.96 per share, which surpassed the Zacks Consensus Estimate by
17.4%. Further, the figure was up 10.7% from $1.77 earned in the
prior-year quarter.
Better-than-expected results were primarily attributable to growth
in fee income, lower provision for credit losses and decline in
operating expenses, partially offset by lower net interest income.
Moreover, credit quality and capital ratios continued to improve,
while profitability ratios were a mixed bag.
Net income from continuing operations was $1.12 billion or $1.91
per share compared with $1.13 billion or $1.90 per share in the
year-ago quarter.
Performance Details
Capital One’s net revenue was $5.37 billion, down 3.3% year over
year. Also, the figure lagged the Zacks Consensus Estimate of $5.45
billion.
Net interest income fell 4.8% from the previous-year quarter to
$4.35 billion due decrease in total interest income. Also, net
interest margin declined 9 basis points (bps) year over year to
6.62%.
Non-interest income increased 4.0% year over year to $1.02 billion
on the back of higher other income and lower net
other-than-temporary impairment losses. These positives were partly
offset by decrease in service charges and other customer-related
fees as well as a drop in interchange fees.
Non-interest expenses declined 2.0% from the prior-year quarter to
$2.93 billion. The decrease was mainly due to fall in
communications and data processing costs, amortization of
intangibles and other expenses. These were partially offset by a
rise in salaries and associate benefits costs as well as marketing
expenses.
The efficiency ratio deteriorated to 54.60% from 53.88% in the
prior-year quarter. A rise in efficiency ratio indicates decline in
profitability.
Credit Quality
Capital One’s credit quality showed improvement, with provision for
credit losses declining 16.9% year over year to $735 million.
Further, net charge-off rate decreased 28 bps year over year to
1.92%.
Moreover, the 30-plus day performing delinquency rate fell 15 bps
from the year-ago quarter to 2.22%. Additionally, allowance, as a
percentage of reported loans held for investment, came in at 2.12%,
down 29 bps from the previous-year quarter.
Capital and Profitability Ratios
Capital One’s profitability ratios were a mixed bag. As of Mar 31,
2014, return on average assets grew to 1.53% from 1.50% as of Mar
31, 2013. However, return on average common equity declined to
10.53% from 11.15% in the prior-year quarter.
The company’s capital ratios continued to improve. As of Mar 31,
2014, Tier 1 risk-based capital ratio came in at 13.4%, up from
12.1% as of Mar 31, 2013. Moreover, total risk-based capital ratio
grew to 15.4% from 14.4% as of Mar 31, 2013.
Additionally, common equity Tier 1 capital ratio under Basel III
Standardized Approach was 13.0% as of Mar 31, 2014.
Further, Capital One received the Federal Reserve’s approval of its
2014 capital plan. The company plans to repurchase $2.5 billion
shares through the first quarter of 2015.
Our Viewpoint
We anticipate continued synergies from Capital One’s geographic
diversification and its major acquisitions, namely HSBC
Holdings plc’s (HSBC) credit card business and ING Direct
USA, the online banking unit of ING Groep NV
(ING). Moreover, the resilience shown by most of the company’s
businesses will continue to support its financials, going
forward.
Nevertheless, exposure to commercial real estate, a weak loan
demand and the impact of new financial regulations are expected to
affect results in the near term.
Currently, Capital One carries a Zacks Rank #3 (Hold).
Among other card servicing stocks, Discover Financial
Services (DFS) is slated to announce results on Apr
22.
CAPITAL ONE FIN (COF): Free Stock Analysis Report
DISCOVER FIN SV (DFS): Free Stock Analysis Report
HSBC HOLDINGS (HSBC): Free Stock Analysis Report
ING GROEP-ADR (ING): Free Stock Analysis Report
To read this article on Zacks.com click here.
Zacks Investment Research
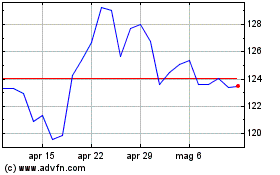
Grafico Azioni Discover Financial Servi... (NYSE:DFS)
Storico
Da Giu 2024 a Lug 2024

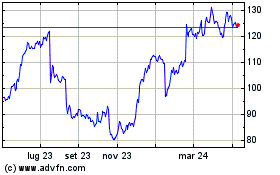
Grafico Azioni Discover Financial Servi... (NYSE:DFS)
Storico
Da Lug 2023 a Lug 2024
