Bitcoin’s Big Breakout? Fed’s “Not QE, QE” Just Flipped The Switch
17 Febbraio 2025 - 5:30PM
NEWSBTC
A fresh infusion of liquidity from the US Treasury General Account
(TGA) is making waves among market observers, with some analysts
speculating this could be a key trigger for Bitcoin’s next major
move. While the Federal Reserve continues its Quantitative
Tightening (QT) program, the TGA’s latest cash injection—pegged at
up to $842 billion—has sparked debate over whether we are
witnessing a stealth version of quantitative easing, sometimes
referred to as “Not QE, QE.” Fed’s “Not QE, QE” In a post shared on
X, macro analyst Tomas (@TomasOnMarkets) offered a breakdown of how
this dynamic is playing out: “‘Not QE, QE’ has officially started.
A liquidity injection that could total up to $842bn from the US
Treasury General Account began this week. Functionally, this is
similar to Quantitative Easing, but on a temporary basis.” The
backdrop for this liquidity surge is the binding $36 trillion US
debt limit. With no new debt issuance allowed until a fresh debt
ceiling agreement is reached, the Treasury is forced to rely on
funds from the TGA to cover government spending obligations. This
draws down the TGA balance—$842 billion as of Tuesday, February
11—effectively injecting liquidity into financial markets. Related
Reading: Bitcoin Network Activity Is Declining — Impact On Price?
According to Tomas, the Treasury’s “train” of TGA spending started
in earnest on Wednesday, February 12: “From my understanding, the
official ‘debt ceiling-induced’ Treasury General Account (TGA)
drawdown began on Wednesday February 12… This train is now in
motion and will not stop until lawmakers come to a new debt ceiling
agreement.” He projects that the first segment of this process will
likely involve around $600 billion in injections between February
12 and April 11. After the April tax season, a temporary
replenishment of the TGA could occur, but until a new debt ceiling
deal is reached, the Treasury will presumably continue to spend
down existing cash reserves. While some observers are hailing this
development as a de facto round of QE, Tomas underscores that the
final net impact depends on two critical drains on liquidity: The
Federal Reserve is rolling off assets at about $55 billion per
month, which Tomas expects to continue at least through the next
FOMC meeting in March. Over two months, that translates to an
estimated $110 billion liquidity reduction. With the Treasury
issuing fewer T-bills due to debt-ceiling constraints—termed “net
negative T-bill issuance”—money market funds may have fewer
short-term government securities to buy. This scarcity could prompt
them to park more cash in the Fed’s Reverse Repo facility, which
effectively drains liquidity from the broader market. Tomas notes:
“This may incentivize money market funds to park cash in the Fed’s
Reverse Repo, potentially pushing this chart up… Reverse Repo usage
increasing would be a liquidity drain, as money would be moving
away from markets and into the Reverse Repo facility at the Fed.”
Overall, the true scale of the TGA-based stimulus remains
uncertain. Last week, net injections into the system were estimated
at $50 billion, a figure that could fluctuate in the weeks ahead as
QT and Reverse Repo demand evolve. Another key piece of the puzzle
is the ongoing political deadlock over the debt ceiling. Despite
calls for bipartisan cooperation, divisions within the narrow
Republican majority—combined with broad Democratic
opposition—complicate prospects for a swift resolution. Related
Reading: Analyst Says Bitcoin Is ‘Primed For A Breakout’: Is BTC
Heading For $150,000 Rally? House Republicans recently put forward
a plan tying “trillions of dollars” in tax cuts to raising the debt
ceiling. However, the measure’s passage is far from assured, as
deeply conservative members object to any debt limit increase on
principle. Past increases have typically required cross-party
support, indicating a potentially prolonged standoff. “This comes
down on the shoulders of House Speaker Mike Johnson, as he attempts
to rally lawmakers behind the plan,” Tomas notes, reflecting
widespread skepticism about whether sufficient votes can be
secured. Will Bitcoin Benefit? For Bitcoin traders, these liquidity
ebbs and flows often correlate with broader risk appetite—Bitcoin
has historically seen upward price movements during periods of
loose monetary policy and liquidity injections. Although the
Federal Reserve has signaled no immediate halt to QT, the TGA
drawdown’s near-term flood of cash could still buoy risk assets,
including Bitcoin. Precisely how much of this “Not QE, QE” trickles
into Bitcoin remains to be seen. Yet, for market participants
watching daily net liquidity metrics, the interplay between TGA
drawdowns, QT, and Reverse Repo usage has become a central
storyline. As the standoff in Washington continues, the Bitcoin
space will be monitoring every uptick and downtick in the Fed’s
liquidity charts—hoping it might just flip the switch on Bitcoin’s
next big breakout. At press time, Bitcoin traded at $96,424.
Featured image created with DALL.E, chart from TradingView.com
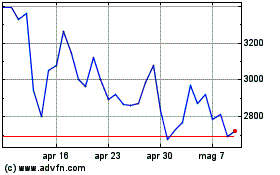
Grafico Azioni Maker (COIN:MKRUSD)
Storico
Da Gen 2025 a Feb 2025

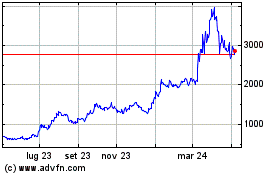
Grafico Azioni Maker (COIN:MKRUSD)
Storico
Da Feb 2024 a Feb 2025
