Chainlink Poised For Recovery If $13 Support Holds – Expert Sets Optimistic Targets
23 Marzo 2025 - 5:30PM
NEWSBTC
Chainlink (LINK) is showing signs of strength, trading 27% above
its March 11 low and hinting at a potential recovery if broader
market conditions improve. Despite recent volatility and ongoing
macroeconomic uncertainty, LINK has managed to hold its ground
better than many altcoins, giving hope to investors who believe the
worst may be over. While some analysts remain cautious and warn of
further downside, others see this consolidation as a healthy reset
before the next leg up. Related Reading: Cardano Indicator Flashes
Buy Signal On 4-Hour Chart – Rebound Ahead? Top analyst Ali
Martinez shared insights on X, noting that Chainlink is currently
testing a critical support level around $13, which aligns with the
lower boundary of a long-standing price channel. According to
Martinez, if LINK holds this zone, historical patterns suggest a
strong rebound could follow. As market sentiment remains divided,
all eyes are on LINK’s ability to maintain this support. A
successful defense could position Chainlink as one of the altcoins
leading the next rally. For now, traders are watching closely,
waiting to see if this price action marks the beginning of a new
upward trend. Chainlink Holds Crucial Support As Bulls Eye A
Breakout After losing the critical $17–$18 support zone, bulls have
struggled to regain control. Chainlink trades at a pivotal level as
it attempts to reclaim higher prices amid ongoing market
uncertainty and volatility. LINK has fallen over 61% since reaching
its mid-December high of around $30, reflecting the broader
market’s bearish sentiment fueled by macroeconomic instability and
risk-off behavior from investors. However, there is growing
optimism that LINK could be preparing for a recovery. Martinez’s
insights highlight that Chainlink is now sitting on a key support
level at $13, which marks the lower boundary of a well-defined
trading channel. Martinez suggests that holding this zone could set
the stage for a major rally. If LINK confirms a stronghold above
$13, historical price action indicates that a move toward the
mid-range target of $25 is likely, with a potential extension
toward $50 if bullish momentum strengthens. Related Reading:
Investors Withdraw 360,000 Ethereum From Exchanges In Just 48 Hours
– Accumulation Trend? The coming days will be critical as bulls
must defend the $13 level to prevent further downside. A bounce
from this zone could trigger renewed investor interest and
accelerate momentum, positioning Chainlink as one of the altcoins
leading a broader market recovery. For now, all eyes are on whether
LINK can hold the line and reignite its bullish structure. LINK
Price Battles Key Resistance Chainlink is currently trading at
$14.30, sitting just below a crucial resistance zone that could
determine its short-term direction. The $15 level has become a key
battleground for bulls and bears. If LINK manages to break above
this resistance with strength, analysts expect a swift move toward
the $17 region—another significant level that previously acted as
strong support before the recent downtrend. The recent price action
shows that bulls are regaining some momentum, especially after
bouncing from the $13 zone. However, the market remains fragile
amid broader macroeconomic uncertainty and cautious investor
sentiment. A confirmed breakout above $15 would likely attract more
buying interest, setting the stage for a short-term rally. On the
flip side, if LINK fails to reclaim $15 and faces rejection at this
resistance, it could slide back toward lower support levels. A drop
below $13 would weaken the bullish case and expose the token to
further downside, with the $12 mark acting as a possible next
support zone. Related Reading: XRP Active Addresses Hit Highest
Level Since April 2023 – Will Price Follow? The next few sessions
will be critical for LINK. Traders are watching closely to see
whether bulls can build enough momentum to break out—or if bears
will regain control and push the price lower. Featured image from
Dall-E, chart from TradingView
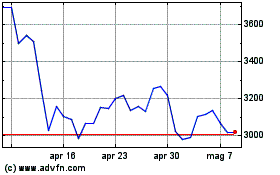
Grafico Azioni Ethereum (COIN:ETHUSD)
Storico
Da Mar 2025 a Apr 2025

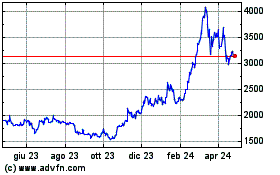
Grafico Azioni Ethereum (COIN:ETHUSD)
Storico
Da Apr 2024 a Apr 2025
