| 17
BALANCE SHEET
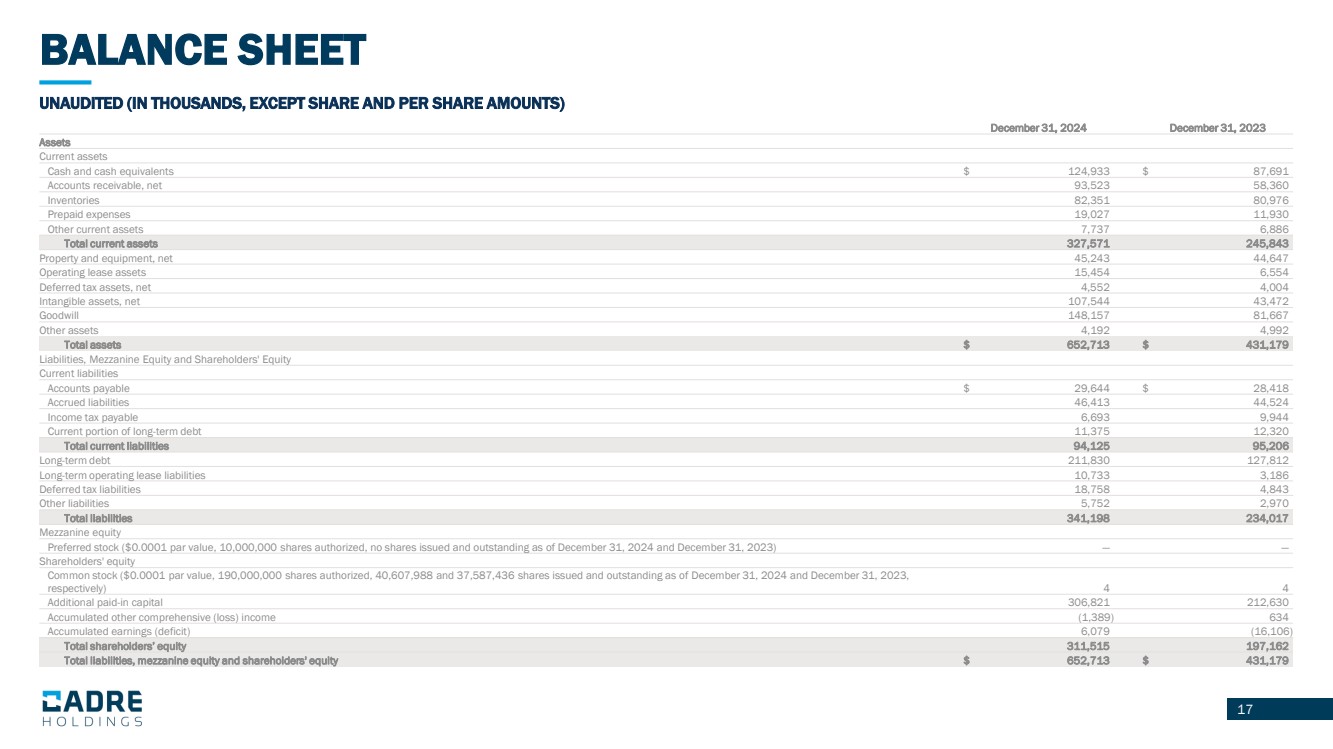
UNAUDITED (IN THOUSANDS, EXCEPT SHARE AND PER SHARE AMOUNTS)
December 31, 2024 December 31, 2023
Assets
Current assets
Cash and cash equivalents $ 124,933 $ 87,691
Accounts receivable, net 93,523 58,360
Inventories 82,351 80,976
Prepaid expenses 19,027 11,930
Other current assets 7,737 6,886
Total current assets 327,571 245,843
Property and equipment, net 45,243 44,647
Operating lease assets 15,454 6,554
Deferred tax assets, net 4,552 4,004
Intangible assets, net 107,544 43,472
Goodwill 148,157 81,667
Other assets 4,192 4,992
Total assets $ 652,713 $ 431,179
Liabilities, Mezzanine Equity and Shareholders' Equity
Current liabilities
Accounts payable $ 29,644 $ 28,418
Accrued liabilities 46,413 44,524
Income tax payable 6,693 9,944
Current portion of long-term debt 11,375 12,320
Total current liabilities 94,125 95,206
Long-term debt 211,830 127,812
Long-term operating lease liabilities 10,733 3,186
Deferred tax liabilities 18,758 4,843
Other liabilities 5,752 2,970
Total liabilities 341,198 234,017
Mezzanine equity
Preferred stock ($0.0001 par value, 10,000,000 shares authorized, no shares issued and outstanding as of December 31, 2024 and December 31, 2023) — —
Shareholders' equity
Common stock ($0.0001 par value, 190,000,000 shares authorized, 40,607,988 and 37,587,436 shares issued and outstanding as of December 31, 2024 and December 31, 2023,
respectively) 4 4
Additional paid-in capital 306,821 212,630
Accumulated other comprehensive (loss) income (1,389) 634
Accumulated earnings (deficit) 6,079 (16,106)
Total shareholders’ equity 311,515 197,162
Total liabilities, mezzanine equity and shareholders' equity $ 652,713 $ 431,179 |
