Cardano Outperforms Market With 50% Surge: Here’s Why
21 Novembre 2024 - 2:00PM
NEWSBTC
Cardano has outperformed most of the market with a sharp 50% rally
during the past week. Here’s what’s driving this run, according to
on-chain data. Cardano On-Chain Metrics Have Lit Up Recently
According to data from the on-chain analytics firm Santiment, a
couple of activity-related metrics have spiked for ADA recently.
The indicators in question are the Transaction Volume and the Whale
Transaction Count. The first of these, the Transaction Volume,
keeps track of the total amount of Cardano that’s becoming involved
in transfers on the blockchain every day. This metric basically
tells us whether the ADA investors have a high interest in trading
the coin or not. Related Reading: Bitcoin Is About To See A
Historically-Profitable Crossover In This Metric Whereas the
Transaction Volume is a general metric, the Whale Transaction Count
provides information about the activity level of only a specific
investor group: the whales. As the metric’s name implies, it
measures the total number of transfers that these humongous
investors are making on the network. More formally, it specifically
tracks the transactions carrying a value of more than $100,000.
Now, here is a chart that shows the trend in the Transaction Volume
and the Whale Transaction Count for Cardano over the last few
months: As displayed in the above graph, both of these on-chain
indicators have shot up for Cardano recently, which implies
activity across the board has risen on the network. This recent
spike in activity has coincided with ADA’s sharp rally, which has
put the cryptocurrency at impressive gains of more than 50% over
the past week. Given the timing, it’s likely that the increased
interest from the investors has played a role in the price surge.
At present, the weekly Transaction Volume for Cardano is sitting at
around $52 billion, which is a 7-month high for the metric.
Similarly, the Whale Transaction Count has a value of 8,900, the
highest in 6 months. From the chart, it’s apparent that ADA also
saw a simultaneous surge in these metrics back in June. This
previously elevated level of activity led to a 26% increase for the
coin. Related Reading: Bitcoin Hashrate Falls Off, Miners Expecting
Pause In Bull Run? Something to note, however, is that this last
activity spike occurred alongside a bottom for the coin, while the
recent one has come as the asset has been rallying. The current
high interest in Cardano could certainly act as more fuel for the
rally, but it could also very well turn into a profit-taking storm
as investors’ gains balloon up. It only remains to be seen which
scenario would follow for ADA in the coming days. ADA Price With
positive returns of 12% during the last 24 hours, Cardano is
currently the best performer among the top cryptocurrencies by
market cap. Featured image from Dall-E, Santiment.net, chart from
TradingView.com
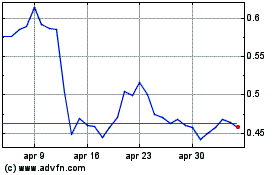
Grafico Azioni Cardano (COIN:ADAUSD)
Storico
Da Ott 2024 a Nov 2024

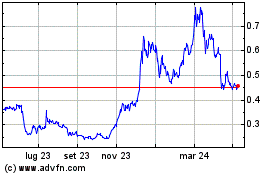
Grafico Azioni Cardano (COIN:ADAUSD)
Storico
Da Nov 2023 a Nov 2024
