Bitcoin Leverage Remains High – Data Reveals Selling Pressure Above $93K
26 Novembre 2024 - 2:30PM
NEWSBTC
After a historic rally, Bitcoin has faced its first major setback,
pulling back 7% from its all-time high of $99,800. This comes after
an impressive surge from $67,500 on November 5, marking a nearly
50% climb in just a few weeks. The price action has largely been
“only up,” attracting significant attention from traders and
investors alike. Related Reading: Ethereum Analyst Predicts $3,700
Once ETH Breaks Through Resistance However, the current pullback
highlights growing caution in the market. Market caution said
leverage levels remain elevated despite recent deleveraging
efforts. Adler’s analysis reveals that increasing short positions
and consolidation below the psychological $100,000 mark have
contributed to the retracement. While Bitcoin’s performance remains
strong in the broader context, this dip signals a potential shift
in market sentiment. The question is whether BTC can gather enough
momentum to break past the $100,000 barrier or if further
consolidation is on the horizon. Many investors consider this
pullback a healthy pause in a bullish cycle, but the high leverage
levels suggest continued volatility. All eyes are on Bitcoin as it
navigates this critical phase, with the next few days likely to
determine its short-term direction. Bitcoin Bears Showing Up After
three weeks of minimal resistance from bears, signs of their
resurgence emerge as Bitcoin struggles to break past the $100,000
level. This critical price point, which many believed would act as
a springboard for further gains, has instead highlighted growing
bearish sentiment. According to CryptoQuant analyst Axel Adler, the
recent price action marks a potential shift in momentum. Adler’s
analysis on X reveals that despite a wave of recent deleveraging,
leverage levels in the market remain elevated. Many key long
positions were established around the $93,000 mark, providing bears
with an opportunity to profit as BTC failed to push higher. This
level has now become a battleground, with Bitcoin’s inability to
sustain upward momentum signaling the possibility of further
downside risk. Bitcoin’s price hovers around this key level,
raising the likelihood of a correction toward $88,500 or prolonged
sideways consolidation below $100,000. Such a scenario would impact
Bitcoin and set the tone for altcoin performance in the coming
weeks. Related Reading: XRP Analyst Sets $2 Target If It Holds Key
Level – Can It Reach Multi-Year Highs? The next two weeks will be
pivotal as market participants closely watch Bitcoin’s price
action. A decisive move, whether up or down, will shape the broader
cryptocurrency landscape and determine whether this is merely a
pause in a larger rally or the start of a deeper correction. BTC
Testing Fresh Demand Bitcoin is trading at $93,500 as bears
regained control after it hit an all-time high last Friday. This
retracement marks a shift in momentum, but bulls still can reclaim
dominance if the price remains strong above the critical $92,000
support level. Holding this level would keep Bitcoin’s price action
structurally bullish and signal resilience in the face of increased
selling pressure. If Bitcoin sustains strength above $92,000, the
outlook for the short term remains optimistic, with the potential
for another attempt at breaking key resistance levels. However, a
drop below this mark would signal short-term weakness, potentially
triggering further declines. The next critical level to watch would
be around $84,000, where the 4-hour 200 EMA aligns as a support
zone. This level represents a major line in the sand for bulls. A
breakdown below it could accelerate bearish momentum, extending the
correction and dampening market sentiment. On the other hand,
holding above $92,000 would reinforce bullish confidence, setting
the stage for a recovery and a potential pushback toward previous
highs. Related Reading: Avalanche Soars 20% In 24 Hours – Analyst
Reveals Next Price Target Traders and investors are closely
watching these levels, as Bitcoin’s ability to stay above $92,000
will determine whether it remains in a short-term bullish structure
or succumbs to bearish pressures. Featured image from Dall-E, chart
from TradingView
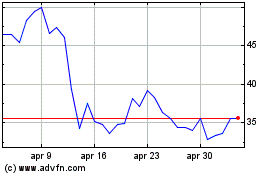
Grafico Azioni Avalanche (COIN:AVAXUSD)
Storico
Da Gen 2025 a Feb 2025

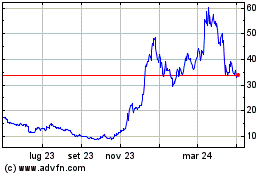
Grafico Azioni Avalanche (COIN:AVAXUSD)
Storico
Da Feb 2024 a Feb 2025
