Social Media Storm Gives Dogecoin 14% Price Boost – Details
25 Marzo 2024 - 3:00PM
NEWSBTC
Dogecoin (DOGE), the meme-inspired cryptocurrency, has experienced
a rollercoaster ride in recent days. A surge in social media
activity surrounding the coin coincided with a price increase of
over 14% within the last week. However, technical indicators hint
at a potential pullback, leaving investors to grapple with mixed
signals. Related Reading: Analyst Bullish On Polkadot (DOT),
Predicts $17 Price Target Before April Social Media Frenzy Fuels
Optimism Data from LunarCrush, a crypto analytics platform,
revealed a significant uptick in social media interactions related
to DOGE. Likes, comments, retweets, and upvotes on various
platforms reached a staggering 30 million within a 24-hour period.
This surge in social volume not only placed DOGE at the forefront
of meme coin discussions but also suggests renewed investor
interest. Regulatory Integration Paves The Way For Institutional
Adoption Adding fuel to the fire, Coinbase Derivatives recently
filed with the CFTC to introduce US-regulated futures contracts for
DOGE, alongside Litecoin and Bitcoin Cash. This regulatory move
signifies a growing acceptance of established cryptocurrencies
beyond the realm of traditional financial institutions. Integration
with established players could lead to greater market stability and
wider adoption for DOGE. April: Historically A Bullish Month For
Dogecoin? The report also highlights a historical trend – April has
proven to be a particularly strong month for DOGE in previous
years. This historical data injects a dose of optimism into the
current scenario, hinting at a potential price upswing in the
coming weeks. However, past performance doesn’t guarantee future
results, and investors should be cautious about relying solely on
historical trends. Total crypto market cap is currently at $2.472
trillion. Chart: TradingView Technical Indicators Flash Caution
Despite the positive social media sentiment and historical
precedent, technical indicators paint a somewhat contrasting
picture. The Aroon Up Line, an indicator that gauges trend
strength, suggests a weakening uptrend for DOGE. Additionally, the
Chaikin Money Flow (CMF) – a measure of money flow – currently
displays a negative value, indicating potential selling pressure.
DOGE seven-day price action. Source: Coingecko Dogecoin Bearish
Signals The Moving Average Convergence Divergence (MACD)
indicator, often used to identify trend changes, further reinforces
the bearish sentiment. Readings show the MACD line crossing below
the signal line in mid-March, potentially marking the beginning of
a short-term downtrend. Related Reading: Fantom (FTM) Bull Run: Can
FTM Hit $2 After 20% Price Spike? Lastly, the Parabolic SAR
indicator, which identifies potential trend reversals, positions
its dotted lines above the current DOGE price, suggesting increased
selling activity. Navigating The Uncertain Waters The current
situation surrounding DOGE presents a complex scenario with both
positive and negative factors at play. While social media buzz and
regulatory progress offer reasons for optimism, technical
indicators warn of a potential short-term price correction.
Featured image from Pexels, chart from TradingView
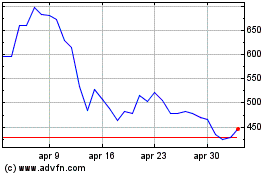
Grafico Azioni Bitcoin Cash (COIN:BCHUSD)
Storico
Da Dic 2024 a Gen 2025

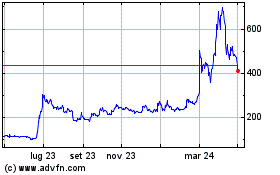
Grafico Azioni Bitcoin Cash (COIN:BCHUSD)
Storico
Da Gen 2024 a Gen 2025
