BNB Price Set to Surge: Could It Be the Next Big Mover?
08 Novembre 2024 - 6:08AM
NEWSBTC
BNB price struggled to stay above the $600 zone. The price is
consolidating gains and might aim for a fresh increase above the
$605 level. BNB price started a downside correction from the $612
resistance zone. The price is now trading above $590 and the
100-hourly simple moving average. There is a connecting bullish
trend line forming with support at $595 on the hourly chart of the
BNB/USD pair (data source from Binance). The pair must stay above
the $588 level to start another increase in the near term. BNB
Price Holds Support After a close above the $585 level, BNB price
extended its increase. However, upsides were limited above $610 and
the price remained capped unlike Ethereum and Bitcoin. There was a
move below the $605 and $600 levels. The price even dipped below
the 23.6% Fib retracement level of the upward move from the $543
swing low to the $611 high. However, the price is now holding gains
above the $580 level. The price is now trading above $595 and the
100-hourly simple moving average. There is also a connecting
bullish trend line forming with support at $595 on the hourly chart
of the BNB/USD pair. If there is a fresh increase, the price could
face resistance near the $605 level. The next resistance sits near
the $612 level. A clear move above the $612 zone could send the
price higher. In the stated case, BNB price could test $620. A
close above the $620 resistance might set the pace for a larger
move toward the $632 resistance. Any more gains might call for a
test of the $650 level in the near term. More Losses? If BNB fails
to clear the $605 resistance, it could start another decline.
Initial support on the downside is near the $595 level and the
trend line. The next major support is near the $578 level or the
50% Fib retracement level of the upward move from the $543 swing
low to the $611 high. The main support sits at $570. If there is a
downside break below the $570 support, the price could drop toward
the $560 support. Any more losses could initiate a larger decline
toward the $550 level. Technical Indicators Hourly MACD – The MACD
for BNB/USD is losing pace in the bullish zone. Hourly RSI
(Relative Strength Index) – The RSI for BNB/USD is currently below
the 50 level. Major Support Levels – $595 and $578. Major
Resistance Levels – $605 and $612.
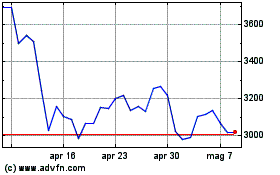
Grafico Azioni Ethereum (COIN:ETHUSD)
Storico
Da Dic 2024 a Gen 2025

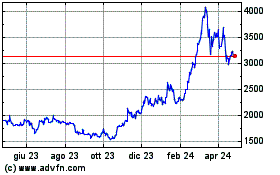
Grafico Azioni Ethereum (COIN:ETHUSD)
Storico
Da Gen 2024 a Gen 2025
