Bitcoin Bears Fear A Short Squeeze Above $71,000 As Open Interest Rises To $22.6B
29 Ottobre 2024 - 10:00PM
NEWSBTC
Bitcoin is on the verge of a historic move as it pushes toward its
all-time highs, surging above the $71,000 mark just yesterday. This
breakout has ignited optimism among analysts, who expect further
upside in the coming weeks as the US election draws near—a period
historically marked by heightened volatility and market shifts.
Critical data from CryptoQuant indicates that Open Interest has
reached $22.6 billion, with half of these positions held by bears.
If Bitcoin continues to climb, this setup creates a high risk of
short liquidations, potentially accelerating buying pressure as
prices push above $71,000. Related Reading: If Dogecoin Breaks
Above Key Resistance ‘We Could See A 25% Rally’ – Top Analyst As
momentum builds, the next few days will determine whether BTC can
sustain its uptrend or if a consolidation phase below the all-time
high will continue. Investors are closely watching these price
levels, as a confirmed breakout could signal new highs for Bitcoin.
At the same time, a stall might suggest a need for additional
consolidation before a larger move. Bitcoin Bears In Serious
Trouble Bitcoin bears are now at high risk of forced liquidations
as a significant level of short position liquidity hovers above the
$71,000 threshold. According to top analyst and macro investor Axel
Adler, this scenario could ignite a powerful rally if short
positions start liquidating en masse. Creating momentum that
propels BTC beyond its all-time highs. Adler shared a CryptoQuant
chart on X, noting that Bitcoin Open Interest has surged to $22.6
billion, with half of these positions held by bears. In his
analysis, Adler emphasizes that the current market structure is
poised for a major squeeze. “There’s no need to hesitate in
liquidating short positions to drive the price up,” Adler states,
suggesting that a cascade of liquidations above $71,000 could act
as a launchpad for Bitcoin, taking it into uncharted price
discovery levels. This process, known as a “short squeeze,” occurs
when overleveraged short holders are forced to close their
positions, resulting in large buy orders that send prices even
higher. Related Reading: Solana Bullish Pattern Holds – Crypto
Analyst Sets $202 Target If this scenario unfolds, Bitcoin wouldn’t
be the only one benefiting. As BTC leads the market, a rally past
previous highs could signal a fresh cycle for the entire crypto
space. Altcoins typically follow Bitcoin’s lead, and the spillover
effect could fuel a comprehensive bull run, with new highs across
multiple assets. Investors are watching closely, as such a
move could renew interest and investment in the crypto market,
drawing in retail and institutional capital. With BTC on the edge
of price discovery, the next few days may prove pivotal in shaping
the market’s direction. BTC Testing Cruial Supply Bitcoin is
testing a supply zone at $71,200, brushing up against the last
resistance level before reaching its all-time high. Bulls appear
firmly in control, with price action signaling a likely breakout
above this level in the coming days. Breaking and holding above the
$70,000 mark remains critical. This psychologically significant
level reinforces bullish sentiment, encouraging more buyers to
enter the market. However, a temporary retracement to gather
liquidity at lower demand levels would benefit Bitcoin’s uptrend. A
dip toward the $69,000 level, or even down to $66,500, would still
align with a bullish outlook. It could attract further interest and
create a healthier base for the next rally. These areas would allow
Bitcoin to gather liquidity before making a stronger push toward
new highs. Related Reading: Ethereum Whale Activity Spikes To
6-Week High – Smart Money Accumulation? Traders are watching,
knowing that a sustained move above $71,200 could pave the way for
price discovery beyond all-time highs. A successful breakout could
trigger renewed momentum across the market, sparking a broader bull
run as Bitcoin leads the charge. Featured image from Dall-E, chart
from TradingView
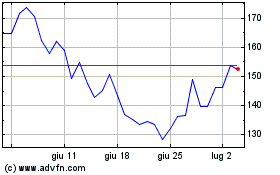
Grafico Azioni Solana (COIN:SOLUSD)
Storico
Da Dic 2024 a Gen 2025

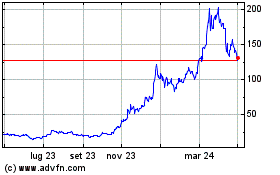
Grafico Azioni Solana (COIN:SOLUSD)
Storico
Da Gen 2024 a Gen 2025
