VIRBAC: 2023 ANNUAL RESULTS
- Revenue up 4.9%, enabling
market share gains despite difficulties in 2023
- 2023 operating
profitability1 at an all-time
high of 23.2% of revenue
- Up 0.4 points compared to
2022
- Strong
momentum expected in 2024
- Expected revenue growth of
4% to 6% at constant exchange rates and scope
- Operating
profitability1 expected to rise
by 0,5 point
|
CONSOLIDATED FIGURES AS OF DECEMBER 31in millions of
€ |
|
2023 |
2022restated6 |
2023/2022 change |
|
|
Revenue |
1 246.9 |
1 216.2 |
+2.5% |
|
| |
|
|
|
|
|
Change at constant exchange rates and scope2 |
|
|
+4.9% |
|
|
Current operating profit, before R&D and amortization
of assets arising from acquisitions |
287.1 |
276.9 |
+3.7% |
|
|
Change at constant exchange rates |
|
|
+6.8% |
|
|
as a % of revenueas a % of revenue at constant rates |
23.0%23.2% |
22.8% |
|
|
|
Current operating profit, before amortization of assets
arising from acquisitions3 |
188.1 |
186.6 |
+0.8% |
|
|
as a % of revenueas a % of revenue at constant rates |
15.1%15.3% |
15.3% |
|
|
|
Amortization of intangible assets from acquisitions |
3.3 |
3.7 |
|
|
|
Current operating income |
184.9 |
182.8 |
+1.1% |
|
|
Non-recurring (expenses) and income |
-0.9 |
-3.3 |
|
|
|
Operating income |
184.0 |
179.5 |
+2.5% |
|
|
Consolidated net income |
121.1 |
121.3 |
-0.2% |
|
|
Including net income - Group share |
121.3 |
121.9 |
|
|
|
Shareholders’ equity - Group share |
900.3 |
839.6 |
+7.2% |
|
|
Net cash4 |
52.4 |
79.4 |
-34.0% |
|
|
Operating cash flow before interest and
taxes5 |
235.1 |
229.9 |
+2.3% |
|
1ratio of current operating income before
R&D and depreciation of assets arising from acquisitions to
revenue2change at constant exchange rates and scope corresponds to
the organic growth of sales, excluding exchange rate variations, by
calculating the indicator for the financial year in question and
the indicator for the previous financial year on the basis of
identical exchange rates (the exchange rate used is the one from
the previous financial year), and excluding change in scope, by
calculating the indicator for the financial year in question on the
basis of the scope of consolidation for the previous financial
year. It should be noted that the impact on revenue growth
resulting from the integration of GS Partners (acquisition of our
distributor in the Czech Republic closed in May) and Globion
(acquisition in India closed in November), representing only 0.3
points of growth, is considered non-material and therefore
consolidation scope was not restated3current operating income,
before depreciation of assets arising from acquisitions, reflects
current income adjusted for the impact of allowances for
depreciation of intangible assets resulting from acquisition
transactions4net cash corresponds to current (€47.7 million) and
non-current (€40.7 million) financial liabilities as well as a
lease obligation related to the application of IFRS 16 (€35.1
million), less the cash position and cash equivalents (€175.9
million) as published in the statement of financial
position5operating cash flow corresponds to operating income
(€184.0 million) restated for items having no impact on the cash
position and impacts related to disposals. The following items are
adjusted: fixed asset depreciation and impairments (€46.7 million),
provisions for risks and charges (€1.6 million), provisions related
to employee benefits (-€0.6 million), and other expenses and income
without any impact on the cash position (€1.4 million), and impacts
related to disposals (+€2.0 million)6non-material impact of
restatement linked to IAS 12 amendment relating to deferred tax
assets and liabilities - see full note in the half-year financial
report
The accounts were audited by the statutory
auditors and examined by the board of directors on March 15, 2023.
The report of the statutory auditors is in the process of being
issued. The statements and detailed presentation of annual income
are available on the corporate site at corporate.virbac.com.
Thanks to the exceptional commitment of
our teams around the world, we achieved annual revenue of €1,246.9
million, compared with €1,216.2 million, representing an
overall change of +2.5% compared with the same period in 2022, and
a +4.9% growth at constant exchange rates. The impact on revenue
growth resulting from the integration of GS Partners (acquisition
of our distributor in the Czech Republic closed in May) and Globion
(acquisition in India closed in November) is only 0.3 points.
Excluding these two acquisitions, growth at constant rates would
have been +4.6%. Against a backdrop of normalizing market growth,
this performance demonstrates the resilience of our business model,
which was significantly challenged by two intrinsic and unfavorable
one-off effects during the year. As a reminder, these were a
temporary limitation of our production capacities for companion
animal vaccines, and a cyber attack on June 19 which forced us to
shut down plants for several weeks. In terms of geography, Europe
(+5.8% at constant rates) and Asia/Pacific (+4.0% at constant
rates) remain the main areas driving our organic growth momentum
over the year. Growth in Europe was mainly driven by France (+6.9%
at constant rates), Northern Europe and Southern Europe
(respectively +4.0% and +4.9% at constant rates), as well as by
Turkey, where business volume more than doubled compared with 2022.
In Asia/Pacific, the main contributors were India (+6.1% at
constant rates), followed by Australia and New Zealand
(respectively +4.9% and +6.7% at constant rates), offsetting the
drop observed in China (-10.8% at constant rates), while business
in Southeast Asia remained stable. In Latin America (+4.9% at
constant rates), we observed very good growth dynamics in all our
subsidiaries (with double digit growth in Mexico and Brazil), with
the exception of Chile which, despite a significant rebound in the
second half (+20% at constant exchange rates), posted a drop for
the full year due to a sharp decline in the first half (-32% at
constant exchange rates), especially in antibiotics. Our revenue in
the United States rose by +3.5% at constant rates, despite a
year-long distributors’ destocking effect.
Current operating income before
depreciation of assets arising from acquisitions amounted
to €188.1 million, up compared to 2022 (€186.6 million). Boosted by
an estimated ~+5% price effect coupled with a more favorable
product mix, our organic growth led to an increase of gross margin
in absolute value. Our operating expenses increased in line with
our sales growth. This increase is visible in personnel costs, due
to the impact of salary increases and the strengthening of
organizations. The significant increase in R&D expenditures
reflects our commitment to accelerate investments in this crucial
area. Our operating margin continues to improve: at the end of
December 2023 and at constant exchange rates, before R&D and
amortization of assets arising from acquisitions, our current
operating profit ratio to revenue is up by 0.4 points to reach a
record level of 23.2%.
Consolidated net income was
€121.1 million, stable compared with the same period in 2022. Net
financial expenses increased by €6.7 million due to the
depreciation of certain currencies as well as, to a lesser extent,
a rising cost of net financial debt. Conversely, the tax charge
decreased in absolute terms, reflecting a base effect (2022 had
recorded non-recurring tax provisions) as well as a favorable
country-mix effect in 2023.
Net income - Group
share amounted to €121.3 million in 2023, stable
compared with the previous year (€121.9 million).
On the financial front, our net
cash position stood at €52.4 million at the end of December 2023,
compared to €79.4 million at the end of December 2022. This
decrease of our net cash position over the year is mainly due to an
increase in our capital expenditure, with, among others, the
closing of two acquisitions (GS Partners and Globion) for around
€55 million7, as well as the impact of the share buyback program
for around €20 million.
OutlookIn 2024, at constant
exchange rates and scope, we expect a ratio of “current operating
income before depreciation of assets resulting from acquisitions”
(Ebit adjusted) to “revenue” around 15% with growth in revenue
estimated at this stage to be between 4% and 6%. As announced in
our previous communications, this level of profitability takes into
account a deliberate further acceleration in our R&D
investments, representing nearly +0.5 points as a percentage of
revenue compared with 2023. We reaffirm our ambition to achieve an
Ebit adjusted ratio of 20% by 2030: in this respect, we plan over
the next few years to gradually restore our R&D investments to
the Group's normative and historical level, with a ratio of R&D
investments to revenue around 2.0 percentage points below 2024
level.
In addition, excluding any acquisitions, our
cash position is expected to improve by €30 million, given the
expected investments over the period, estimated to be around €100
million and considering the acceleration of our efforts in
R&D.
Finally, at the next shareholders' general
meeting, a net dividend per share of €1.32 will be recommended for
distribution for the 2023 fiscal year.
7includes net cash of acquired companies
ANALYSTS’ PRESENTATION –
VIRBAC
We will hold an
analysts meeting on Wednesday, March 20, 2024 at 2:30 p.m. (Paris
time - CET) in the Édouard VII Business Center’s auditorium, 23
square Edouard VII 75009 Paris (France).
Participants may
arrive 15 minutes before the start of the meeting.
You may also attend
the meeting using the webcast (audio + slides) available via the
link below.
Information for
participants:
Webcast access link:
https://bit.ly/42gMcGl
This access link is
available on the corporate.virbac.com site, under the heading
“Public releases.” This link allows participants to access the live
and/or archived version of the webcast.
You will be able to
ask questions via chat (text) directly during the webcast or after
watching the replay via the following email address:
finances@virbac.com.
A lifelong commitment to animal
healthAt Virbac, we provide innovative solutions to
veterinarians, farmers and animal owners in more than 100 countries
around the world. Covering more than 50 species, our range of
products and services enables us to diagnose, prevent and treat the
majority of pathologies. Every day, we are committed to improving
the quality of life of animals and to shaping the future of animal
health together.
Virbac: Euronext Paris - subfund A - ISIN code:
FR0000031577/MNEMO: VIRPFinancial Affairs department: tel. 04 92 08
71 32 - finances@virbac.com - corporate.virbac.com
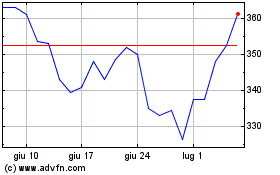
Grafico Azioni Virbac (EU:VIRP)
Storico
Da Dic 2024 a Gen 2025

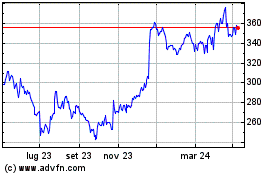
Grafico Azioni Virbac (EU:VIRP)
Storico
Da Gen 2024 a Gen 2025
