‘Early Signs Of Breakout’ – Solana To Explode By 900%, According To Analyst
22 Luglio 2024 - 8:30PM
NEWSBTC
With audacious forecasts from experts predicting a significant
price rise, Solana (SOL) is drawing interest from the
cryptocurrency market. Solana, well-known for its scalable
solutions and fast blockchain, is likely to have a breakthrough and
maybe reach previously unheard-of levels. Related Reading: Terra
Classic Poised For 280% Rally On ‘Major Recovery Strength’ –
Analyst Pennant Pattern Signals Bullish Continuation Ali Martinez,
a well-known cryptocurrency and blockchain expert, has spotted on
Solana’s weekly chart a so-called bull pennant shape. Often linked
to positive arcs, this trend suggests that SOL may be getting ready
for a big move up. When trend lines come together to make a
symmetrical triangle after a big price rise, the pattern shows a
time of consolidation and investor uncertainty. Targeting the
$1,000 threshold, Martinez’s examination indicates Solana may defy
this trend. From its existing price of about $180, this would
translate to a 900% increase. The creation of the bull pennant is
crucial as it suggests that after the phase of consolidation ends,
the uptrend might start once more. Recent price fluctuations
reinforce this hope; SOL trading at $171 shows a 1.30% growth in
the previous 24 hours, therefore bringing its market valuation to
$79.82 billion. #Solana is eyeing $1,000! Early signs of a breakout
from a bull pennant suggest a potential 900% rally ahead.
pic.twitter.com/DuFJF4h9dX — Ali (@ali_charts) July 20, 2024
Technical Indicators The technical signs line up with Martinez’s
optimistic view. Currently at $148, the 20-day Simple Moving
Average (SMA) is rising and indicates good short-term momentum.
With an RSI of 64.50, the Relative Strength Index (RSI) reflects a
healthy market vibe free of overbought behavior. These signals
point to a favorable direction for Solana’s price movement—buying
pressure seems to be exceeding selling pressure. Indices of Moving
Average Convergence Divergence (MACD) and Chaikin Money Flow (CMF)
help to further corroborate this optimistic mood. Strong rising
momentum is shown by the MACD line above the signal line and by its
positive histogram. Furthermore boosting investor confidence is the
CMF value of 0.15, which indicates notable capital influx into
Solana. SOL market cap currently at $83 billion. Chart:
TradingView.com Price Movement And Market Sentiment Looking
forward, Solana may reach $180 and target the crucial resistance at
$210 if it keeps its optimistic trend. Reaching the ambitious
$1,000 goal would depend on breaking past current levels, therefore
reinforcing the positive trend. Still, failing to top the $175 mark
might cause a drop towards the $160 support level. A further
decline may threaten the vital $118 support area as, should this
support be compromised, considerably lower levels could result.
Solana is trading 14.20% below its expectation for the next month,
according to current market forecast, which points to a short-term
undervaluation. SOL is expected to rise modestly, by 4.89%, during
the next three months, indicating a consistent rising trend as
market circumstances stabilize, data from Coincheckup show. Related
Reading: Polkadot (DOT) Poised For Rally? Analyst Predicts $9.00
Breakout Strong market conditions and favorable investor sentiment
should reflect a significant increase of 67.50% in six months. With
a one-year prognosis of a 56.28% increase rate, long-term forecasts
also show continuous appreciation. Technical signs and market mood
pointing towards a possible breakout and significant price surge
indicate Solana’s future is bright. Although the projection of a
900% rise to $1,000 is bold, the underlying study and current
performance give this estimate credence. Featured image from
Popular Mechanics, chart from TradingView
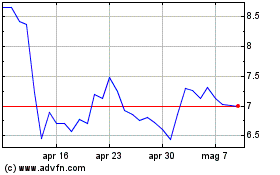
Grafico Azioni Polkadot (COIN:DOTUSD)
Storico
Da Dic 2024 a Gen 2025

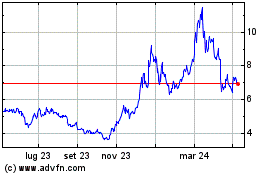
Grafico Azioni Polkadot (COIN:DOTUSD)
Storico
Da Gen 2024 a Gen 2025
