Bitcoin Traders Capitulate: Here’s What Happened Last 2 Times
21 Marzo 2024 - 2:00PM
NEWSBTC
On-chain data shows the Bitcoin investors have been capitulating
recently, a sign that FUD has been gripping the market. Bitcoin
Total Amount Of Holders Has Seen A Drop Recently According to data
from the on-chain analytics firm Santiment, the Bitcoin Total
Amount of Holders has registered a notable decline recently. The
“Total Amount of Holders” here is an indicator that measures the
total number of addresses on the BTC blockchain that are carrying
some non-zero balance right now. When the value of this metric
trends up, it can mean that fresh hands are potentially investing
into the cryptocurrency, opening new addresses and adding coins to
them. Related Reading: Solana Whale Makes Massive 1,000,000 SOL
Deposit To Binance, Bearish Sign? The indicator would naturally
also increase if any investors who had left the asset before are
returning back to it and filling up their wallets again. Another
possible reason for the trend can also be due to holders breaking
up their holdings into multiple wallets, for purposes like privacy.
In general, though, an increase in the Total Amount of Holders is
usually a sign that net adoption of the coin is taking place, which
can be a bullish sign in the long term. On the other hand, a
decline in the indicator can signal that some investors have
decided to leave the cryptocurrency behind, as they have completely
liquidated their holdings. Now, here is a chart that shows the
trend in the Bitcoin Total Amount of Holders over the past few
months: The value of the metric appears to have gone through a
drawdown in recent days | Source: Santiment on X As displayed in
the above graph, the Bitcoin Total Amount of Holders has suffered a
decrease during the past 10 days or so. In all, 311,000 addresses
have completely emptied themselves inside this window. “To a novice
trader, this may appear to be a concern with less overall active
participants. However, historically this stat has reflected FUD
moments in the market, indicating small BTC wallets are typically
capitulating as large wallets scoop up their coins,” explains
Santiment. From the chart, it’s visible that there have also been
two other instances of mass capitulation within the past few
months. More specifically, 1.1 million addresses exited between the
23rd of September and 23rd of October, while 757,000 capitulated
between the 21st of January and 13th of February. Interestingly,
during these capitulation events, the price went up 28% and 24%,
respectively. So far since the latest selloff from the small hands
has started, the cryptocurrency is down about 3%. Related Reading:
Santiment Reveals Best Altcoins Currently In “Opportunity Zone” “If
history is any indication, Bitcoin has a strong chance of putting
up positive returns before this exodus of non-0 wallets this round
(due to traders thinking the top is in) finally stops,” notes the
analytics firm. BTC Price Since Bitcoin’s low at $60,600, the asset
has enjoyed some sharp recovery as its price has now surged to the
$66,800 level. Looks like the value of the coin has climbed back up
over the past day | Source: BTCUSD on TradingView Featured image
from Shutterstock.com, Santiment.net, chart from TradingView.com
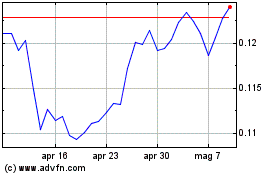
Grafico Azioni TRON (COIN:TRXUSD)
Storico
Da Mar 2024 a Apr 2024

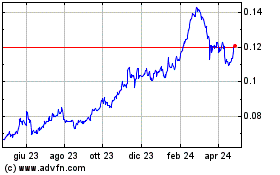
Grafico Azioni TRON (COIN:TRXUSD)
Storico
Da Apr 2023 a Apr 2024
