Dogecoin Holding Strong—Analyst Says $4 Rally Could Be Next
11 Febbraio 2025 - 10:30AM
NEWSBTC
Crypto analyst Ali (@ali_charts) has published a weekly chart on
TradingView that places Dogecoin (DOGE) squarely above a defining
ascending channel drawn from early 2014. Although many altcoins
have gone through boom‐and‐bust cycles in their histories, the
attached chart reveals that DOGE has largely respected this
upward‐sloping range for more than a decade. “DOGE is holding
strong above the upper boundary of this channel, keeping the path
open for a potential rally toward $4!” Martinez claims.
Dogecoin Poised For $4? The channel itself is composed of two
primary bold lines—defining the lower and upper ranges of price
action—as well as a series of dashed mid‐channel lines. In 2014,
Dogecoin lingered below $0.00017. Year later, in March 2020,
Dogecoin fell to $0.00134, a level that corresponds to the 0%
Fibonacci reference point on the chart. From there, price action
began forming a gentle uptrend that has become clearer over time,
punctuated by spikes in 2017–2018, a run in mid‐2019, and most
notably the massive rally in 2021 when DOGE surged to a historical
high of approximately $0.73905. Following a sharp retracement,
price briefly consolidated near $0.06654, a zone marked by the
0.618 Fibonacci retracement. DOGE then built enough strength to
climb above the 0.786 Fibonacci level around $0.19183, which
coincided with the midpoint of the lower ascending channel. Related
Reading: Whales Accumulate 100 Million Dogecoin In 24 Hours –
Demand Signals Growing Confidence At present, Dogecoin sits near
$0.25, placing it above the channel’s lower boundary but also below
the dashed lower trendline that has consistently served as a
reference for major breakouts. In April 2024 as well as in December
2024, DOGE was rejected at this trendline near $0.23 and $0.48
respectively. With the current correction, DOGE may have
successfully completed a retest of the previous local high near
$0.23 and is now ready for the next rise. Notably, periods when
DOGE has gravitated around these dashed lines have often preceded
large directional moves, both on the way up and on the way down. A
break above the lower dashed line which currently sits near $0.50
could potentially trigger Dogecoin’s next major upside move.
Overall, the overarching takeaway from Ali’s perspective is that
Dogecoin remains structurally intact within this multi‐year trend,
reinforcing the idea that future price expansions are possible.
Fibonacci analysis featured on the chart shows multiple levels
spaced throughout Dogecoin’s history. The 0.618 retracement at
around $0.06654 stands out for having captured the lows of the 2022
bear market, while the 0.786 Fibonacci mark near $0.19183 served as
a consolidation pivot before the current move higher. Related
Reading: Is Dogecoin Massively Undervalued? Analyst Says ‘Now Is
The Time’ Above the 1.0 extension (the 2021 all‐time high around
$0.73905) lie key Fibonacci extension targets, namely 1.272 near
$4.10, 1.414 around $10.04, and 1.618 near $36.32. These levels
provide a technical roadmap for the most optimistic scenarios,
though each one becomes progressively more speculative as price
would need to shatter multiple psychological and technical barriers
to reach them. By reclaiming and holding above the upper boundary
of the channel, Dogecoin appears to be staging another potential
expansion phase. Chart interpretations suggest that as long as DOGE
remains above this threshold, it retains a bullish structure that
has reliably channeled rising prices over the past decade. If,
however, price were to fall back below $0.0.19, it could slip
towards the lower boundary of the channel or possibly even break
below it, thus destroying the bullish case for DOGE. At press time,
DOGE traded at $0.26791. Featured image created with DALL.E, chart
from TradingView.com
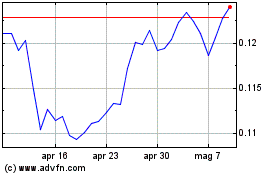
Grafico Azioni TRON (COIN:TRXUSD)
Storico
Da Gen 2025 a Feb 2025

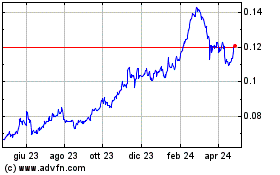
Grafico Azioni TRON (COIN:TRXUSD)
Storico
Da Feb 2024 a Feb 2025
