easyJet plc (EZJ) Trading Update for the six months ended 31
March 2023 18-Apr-2023 / 07:00 GMT/BST
-----------------------------------------------------------------------------------------------------------------------
18 April 2023
easyJet plc
('easyJet')
easyJet Trading Update for the six months ended 31 March
2023
easyJet improves its first half performance by >GBP120
million year on year and expects to exceed FY23 market
expectations1, driven by network transformation, improved revenue
capability and strong demand. Easter saw a robust operational
performance with booking momentum continuing into summer
-- Continued revenue growth through Q2? Passengers2 +35% YoY ?
RPS +43% YoY? Load factor +10 ppts YoY ? Ticket yield +31% YoY ?
Ancillary yield +16% YoY
-- Robust Easter operations? Around 1,600 flights per day ?
99.8% of planned flights operated despite impact from French ATC
strikes
-- Strong bookings continue into summer 2023? Q3 Airline RPS
expected to be around +20% YoY ? easyJet holidays further upgrades
growth expectations to c. 60% YoY
-- Capacity? H2 c.56m seats, c.9% increase YoY? Q3 Capacity
c.26m - +7% YoY ? Q4 capacity around pre-pandemic levels - network
capacity +8% vs pre pandemic excluding Berlinrightsizing
-- Whilst we remain mindful of the uncertain macroeconomic
outlook across the globe, based on current highlevels of demand and
strong bookings, easyJet anticipates exceeding current market
profit expectations of GBP260million for FY23
Summary
easyJet reduced its first half "seasonal" losses significantly
year on year, driven by self-help measures including network
optimisation, improved ancillary products, and a continued cost
focus which allow us to fully benefit from strong levels of demand.
Headline loss before tax for the first half is expected to be
between GBP405 and GBP425 million. This result is despite
challenges from elevated fuel prices, market wide inflation and
costs associated with building resilience into the operation ahead
of summer 2023.
easyJet has ramped up capacity throughout the quarter, growing
40% from January to March. This growth will continue into peak
summer where easyJet will be back to around pre-pandemic levels of
capacity, with the network seeing growth of around 8% when
excluding the Berlin rightsizing. easyJet is fully resourced ahead
of this ramp up after successfully completing its largest ever crew
onboarding campaign. The attractiveness of easyJet's brand
continues to be a differentiator, with applications received being
over 8 times the number of roles recruited.
Easter demand has been strong with around 1,600 flights
operating on average per day with robust operational performance
achieved. Capacity over Easter, in the UK, was back around pre
pandemic levels, with strong demand and positive yield growth
compared to Easter 2019. Disruption from French ATC strikes
continued to be seen through April, though easyJet's investment
into resilience will help mitigate its impact.
easyJet holidays continues to benefit from strong UK demand,
further upgrading its growth expectations to c.60% year on year
(previously 50%). easyJet holidays is currently 80% sold for this
summer.
Johan Lundgren, CEO of easyJet, said:
"Demand for easyJet's flights and holidays has continued to grow
in the half, resulting in more than a GBP120 million pound
improvement in our performance as well as a billion pound revenue
improvement year on year. This is further enhanced by our
transformed network of popular destinations and improved revenue
capability.
"We see continued strong booking momentum into summer as
customers prioritise spending on travel and choose airlines like
easyJet offering the best value and destination mix, as well as
easyJet holidays which is continuing its steep growth trajectory as
the fastest growing holidays company in the UK.
"All of this means easyJet expects to outperform FY23 market
expectations."
Capacity
During Q2 easyJet flew 17.7 million seats, in line with
guidance, a significant increase on the same period last year when
easyJet flew 14.8 million seats. Load factor was 88% (Q2 FY22:
78%), due to increased customer demand coupled with
restriction-free travel.
Passenger2 numbers in the quarter increased to 15.6 million (Q2
FY22: 11.5 million).
                                                    March  Q2     Q2
                         January 2023 February 2023
                                                    2023   FY23   FY22
Number of flights        27,716       32,844        38,713 99,273 82,247
Peak operating aircraft  264          265           267    267    272

Passengers 2 (thousand)  4,185        5,221         6,225  15,631 11,545

Seats flown (thousand)   4,933        5,856         6,903  17,692 14,844

Load factor 3            85%          89%           90%    88%    78%
Revenue, Cost and Liquidity
Total group revenue and headline costs for the first half are
expected to be around GBP2,690 million and around GBP3,105 million
respectively. Pricing remained strong during the first half for
both ticket and ancillary revenue, demonstrating the continued
success of easyJet's network optimisation and ancillary products.
Significant fuel price increases year on year and the strengthened
USD have resulted in sterling fuel cost per seat being +71%
(+GBP8.49) vs the same period last year. One-off costs were
incurred during the first half as 15 wet leased aircraft utilised
in summer 22 only left the fleet at the end of October.
easyJet continues to have one of the strongest, investment
grade, balance sheets in european aviation. As at 31 March 2023 our
net debt position was c.GBP0.2 billion (31 December 2022: GBP1.1
billion). During February 2023, a EUR500 million bond was repaid
upon maturity.
Financing costs benefitted from the strengthening of sterling
versus the USD over the quarter which has driven a non-operating,
non-cash FX gain of circa GBP27 million (H1 22: GBP2 million gain)
from balance sheet revaluations.
(GBP'm)                                       Low   High
H1 23 Group headline EBITDAR range          (80)  (60)
H1 23 Group headline EBIT range             (405) (385)
H1 23 Group headline loss before tax range  (425) (405)
                                                                                              Variance
H1 23 numbers are circa and rounded to the middle of the range provided above H1'23   H1'22
                                                                                              Favourable / (Adverse)
Passenger revenue (GBP'm)                                                       1,750   985     78%
Airline ancillary revenue (GBP'm)                                               765     458     67%
Holidays revenue4 (GBP'm)                                                       175     55      218%
Group revenue (GBP'm)                                                           2,690   1,498   80%
Fuel costs (GBP'm)                                                              (770)   (362)   (113)%
Airline headline EBITDAR costs ex fuel (GBP'm)                                  (1,825) (1,287) (42)%
Holidays EBITDAR costs4 (GBP'm)                                                 (165)   (57)    (117)%
Group headline EBITDAR costs (GBP'm)                                            (2,760) (1,706) (62)%
Group headline EBITDAR (GBP'm)                                                  (70)    (208)   66%
Group depreciation & amortisation (GBP'm)                                       (325)   (278)   (17)%
Group headline EBIT (GBP'm)                                                     (395)   (486)   19%
Financing costs excluding balance sheet revaluations (GBP'm)                    (47)    (61)    26%
Balance sheet revaluations (GBP'm)                                              27      2       1,150%
Group headline LBT (GBP'm)                                                      (415)   (545)   24%

Airline passenger revenue per seat (GBP)                                        46.24   32.49   42%
Airline ancillary revenue per seat (GBP)                                        20.22   15.12   34%
Total airline revenue per seat (GBP)                                            66.46   47.61   40%

Airline headline cost per seat ex fuel (GBP)                                    (57.16) (53.47) (7)%
Airline fuel cost per seat (GBP)                                                (20.43) (11.94) (71)%
Airline headline total cost per seat (GBP)                                      (77.59) (65.41) (19)%

Sector length (km)                                                            1,192   1,131   5%

Cash and money market deposits (GBP'bn)                                         3.5     3.5     -
Net debt (GBP'bn)                                                               0.2     0.6     67%
Fuel & FX Hedging (as at 14.04.23)
Jet Fuel                        H2'23 H1'24   USD                                H2'23 H1'23
Hedged position                 69%   43%     Hedged position                    74%   51%
Average hedged rate (USD/MT)      USD896  USD890    Average hedged rate (USD/GBP)      1.24  1.21
Current spot (USD/MT) at 14.04.23 c. USD820       Current spot (USD/GBP) at 14.04.23 c. 1.25
For further details please contact easyJet plc:
Institutional investors and analysts:
Michael Barker Investor Relations +44 (0) 7985 890 939
Adrian Talbot Investor Relations +44 (0) 7971 592 373
Media:
Anna Knowles Corporate Communications +44 (0) 7985 873 313
Edward Simpkins FGS Global +44 (0) 7947 740 551 / (0) 207 251
3801
Dorothy Burwell FGS Global +44 (0) 7733 294 930 / (0) 207 251
3801
A copy of this Trading Statement is available at
http://corporate.easyjet.com/investors
1) Current market profit expectations, as per company compiled
consensus is a GBP260 million PBT for FY23 (as at 14.04.23).
2) Represents the number of earned seats flown. Earned seats
include seats which are flown whether or not the passenger turns
up, as easyJet is a no refund airline and once a flight has
departed, a no-show customer is generally not entitled to change
flights or seek a refund. Earned seats also include seats provided
for promotional purposes and to staff for business travel.
3) Represents the number of passengers as a proportion of the
number of seats available for passengers. No weighting of the load
factor is carried out to recognise the effect of varying flight (or
"sector") lengths.
4) easyJet holidays numbers include elimination of intercompany
airline transactions
This announcement may contain statements which constitute
'forward-looking statements'. Although easyJet believes that the
expectations reflected in these forward-looking statements are
reasonable, it can give no assurance that these expectations will
prove to have been correct. Because these statements involve risks
and uncertainties, actual results may differ materially from those
expressed or implied by these forward-looking statements.
-----------------------------------------------------------------------------------------------------------------------
Dissemination of a Regulatory Announcement, transmitted by EQS
Group. The issuer is solely responsible for the content of this
announcement.
-----------------------------------------------------------------------------------------------------------------------
ISIN:          GB00B7KR2P84
Category Code: TST
TIDM:          EZJ
LEI Code:      2138001S47XKWIB7TH90
Sequence No.:  237440
EQS News ID:   1609663

End of Announcement  EQS News Service
=------------------------------------------------------------------------------------
Image link:
https://eqs-cockpit.com/cgi-bin/fncls.ssp?fn=show_t_gif&application_id=1609663&application_name=news
(END) Dow Jones Newswires
April 18, 2023 02:00 ET (06:00 GMT)
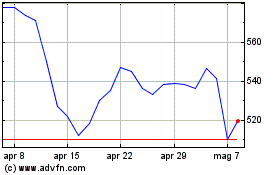
Grafico Azioni Easyjet (LSE:EZJ)
Storico
Da Mar 2024 a Apr 2024

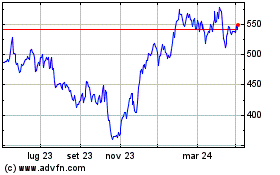
Grafico Azioni Easyjet (LSE:EZJ)
Storico
Da Apr 2023 a Apr 2024
