UNITED STATES
SECURITIES AND EXCHANGE COMMISSION
Washington, D.C. 20549
Form 6-K
REPORT OF FOREIGN PRIVATE ISSUER PURSUANT TO
RULE
13a-16 OR 15d-16 UNDER
THE SECURITIES EXCHANGE ACT OF 1934
For the month of March 2025
Commission File Number 001-38752
Qifu Technology, Inc.
(Translation of registrant’s name into English)
7/F Lujiazui Finance Plaza
No. 1217 Dongfang Road
Pudong New Area, Shanghai 200122
People’s Republic of China
(Address of principal executive
office)
Indicate by check mark whether the registrant files or will file annual
reports under cover of Form 20-F or Form 40-F.
Form 20-F x Form 40-F
¨
Exhibit Index
Exhibit 99.1 — Press Release
SIGNATURE
Pursuant to the requirements of the Securities
Exchange Act of 1934, the registrant has duly caused this report to be signed on its behalf by the undersigned, thereunto duly authorized.
| |
Qifu Technology, Inc. |
| |
|
| |
By: |
/s/ Alex Xu |
| |
Name: |
Alex Xu |
| |
Title: |
Director and Chief Financial Officer |
| |
|
| Date: March 17, 2025 |
|
Exhibit 99.1
Qifu Technology Announces Fourth Quarter and
Full Year 2024 Unaudited Financial Results and Raises Semi-Annual Dividend
Shanghai, China, March 16, 2025, Qifu Technology, Inc.
(NASDAQ: QFIN; HKEx: 3660) (“Qifu Technology” or the “Company”), a leading AI-empowered Credit-Tech platform
in China, today announced its unaudited financial results for the fourth quarter and full year ended December 31, 2024 and raised
semi-annual dividend.
Fourth Quarter 2024 Business Highlights
| · | As
of December 31, 2024, our platform has connected 162 financial institutional partners
and 261.2 million consumers*1 with potential credit needs, cumulatively, an increase
of 11.0% from 235.4 million a year ago. |
| · | Cumulative
users with approved credit lines*2 were 56.9 million as of December 31, 2024,
an increase of 11.8% from 50.9 million as of December 31, 2023. |
| · | Cumulative
borrowers with successful drawdown, including repeat borrowers was 34.4 million as of December 31,
2024, an increase of 13.1% from 30.4 million as of December 31, 2023. |
| · | In
the fourth quarter of 2024, financial institutional partners originated 24,814,923 loans*3
through our platform. |
| · | Total
facilitation and origination loan volume*4 reached RMB89,885 million, an increase
of 0.4% from RMB89,561 million in the same period of 2023 and an increase of 9.0% from RMB82,436
million in the prior quarter. RMB47,796 million of such loan volume was under capital-light
model, Intelligence Credit Engine (“ICE”) and total technology solutions*5,
representing 53.2% of the total, an increase of 23.2% from RMB38,798 million in the same
period of 2023 and an increase of 5.3% from RMB45,396 million in the prior quarter. |
| · | Total
outstanding loan balance*6 was RMB137,014 million as of December 31, 2024,
a decrease of 5.7% from RMB145,270 million as of December 31, 2023 and an increase of
7.3% from RMB127,727 million as of September 30, 2024. RMB79,599 million of such loan
balance was under capital-light model, “ICE” and total technology solutions,
an increase of 8.6% from RMB73,268 million as of December 31, 2023 and an increase of
7.5% from RMB74,078 million as of September 30, 2024. |
| · | The
weighted average contractual tenor of loans originated by financial institutions across our
platform in the fourth quarter of 2024 was approximately 10.00 months, compared with 11.47
months in the same period of 2023. |
| · | 90
day+ delinquency rate*7 of loans originated by financial institutions across our
platform was 2.09% as of December 31, 2024. |
| · | Repeat
borrower contribution*8 of loans originated by financial institutions across our
platform for the fourth quarter of 2024 was 93.9%. |
1 Refers to cumulative registered users across
our platform.
2 “Cumulative users with approved credit
lines” refers to the total number of users who had submitted their credit applications and were approved with a credit line at
the end of each period.
3 Including 2,799,208 loans across “V-pocket”,
and 22,015,715 loans across other products.
4 Refers to the total principal amount of loans
facilitated and originated during the given period. Retrospectively excluding the impact of discontinued service, which did not have and is not expected to have a material impact on our overall business, financial condition, and results of operations.
5 “ICE” is an open platform primarily
on our “Qifu Jietiao” APP (previously known as “360 Jietiao”), we match borrowers and financial institutions
through big data and cloud computing technology on “ICE”, and provide pre-loan investigation report of borrowers. For loans
facilitated through “ICE”, the Company does not bear principal risk.
Under total technology solutions, we have been
offering end-to-end technology solutions to financial institutions based on on-premise deployment, SaaS or hybrid model since 2023.
6 “Total outstanding loan
balance” refers to the total amount of principal outstanding for loans facilitated and originated at the end of each period,
excluding loans delinquent for more than 180 days. Retrospectively excluding the impact of discontinued service, which did not have
and is not expected to have a material impact on our overall business, financial condition, and results of operations.
7 “90 day+ delinquency rate” refers
to the outstanding principal balance of on- and off-balance sheet loans that were 91 to 180 calendar days past due as a percentage of
the total outstanding principal balance of on- and off-balance sheet loans across our platform as of a specific date. Loans that are
charged-off and loans under “ICE” and total technology solutions are not included in the delinquency rate calculation.
8 “Repeat borrower contribution”
for a given period refers to (i) the principal amount of loans borrowed during that period by borrowers who had historically made
at least one successful drawdown, divided by (ii) the total loan facilitation and origination volume through our platform during
that period.
Fourth Quarter 2024 Financial Highlights
| · | Total
net revenue was RMB4,482.3 million (US$614.1 million), compared to RMB4,370.2 million in
the prior quarter. |
| · | Net
income was RMB1,912.7 million (US$262.0 million), compared to RMB1,798.8 million in the prior
quarter. |
| · | Non-GAAP*9
net income was RMB1,972.4 million (US$270.2 million), compared to RMB1,825.1 million
in the prior quarter. |
| · | Net
income per fully diluted American depositary share (“ADS”) was RMB13.24 (US$1.82),
compared to RMB12.18 in the prior quarter. |
| · | Non-GAAP
net income per fully diluted ADS was RMB13.66 (US$1.87), compared to RMB12.35 in the prior
quarter. |
9 Non-GAAP income from operations, Non-GAAP net
income, Non-GAAP operating margin, Non-GAAP net income margin and Non-GAAP net income per fully diluted ADS are Non-GAAP financial measures.
For more information on these Non-GAAP financial measures, please see the section of “Use of Non-GAAP Financial Measures Statement”
and the table captioned “Unaudited Reconciliations of GAAP and Non-GAAP Results” set forth at the end of this press release.
Full Year 2024 Operational Highlights
| · | Total
loan facilitation and origination volume*4 in 2024 was RMB321,969 million, representing
a decrease of 12.8% from RMB369,132 million in 2023. Loan facilitation volume*4
under Platform Services was RMB170,589 million, an increase of 3.8% from RMB164,321 million
in 2023. |
| · | The
weighted average contractual tenor of loans facilitated and originated was 10.05 months in
full year 2024, compared with 11.21 months in 2023. |
| · | Repeat
borrower contribution was 93.1% in full year 2024, compared with 91.6% in 2023. |
Full Year 2024 Financial Highlights
| · | Total
net revenue was RMB17,165.7 million (US$2,351.7 million), compared to RMB16,290.0 million
in 2023. |
| · | Net
income was RMB6,248.1 million (US$856.0 million), compared to RMB4,268.6 million in 2023. |
| · | Non-GAAP
net income was RMB6,415.7 million (US$879.0 million), compared to RMB4,454.2 million in 2023. |
| · | Net
income per fully diluted ADS was RMB41.28 (US$5.66), compared to RMB26.08 in 2023. |
| · | Non-GAAP
net income per fully diluted ADS was RMB42.39 (US$5.81), compared to RMB27.22 in 2023. |
Mr. Haisheng Wu, Chief Executive Officer
and Director of Qifu Technology, commented, “Although 2024 was a challenging year as macro-economic headwinds persisted, we have
made timely adjustments to our operations throughout the year and focused our effort on improving the quality and sustainability of our
business. With consistent execution, we closed the year with strong operational and financial results. Throughout 2024, we proactively
expanded the scope of our platform services, which makes our business model more resilient and forms a solid foundation for high quality
growth in 2025.
Approximately 58% of the year-end loan
balance was under the capital-light model, ICE and total technology solutions. The strong contribution from non-credit risk
bearing services helped us mitigate some risks in a challenging environment and demonstrated the efficiency of our platform
services. In 2024, we further diversified our user acquisition channels and in the fourth quarter, approximately 47% of our new
credit line users were acquired through embedded finance channels. Meanwhile, we continued to solidify our relationships with
financial institution partners. With record-setting ABS issuance, we further optimized our funding structure.
While we started to see some tentative signs
of improvement in user activities late in 2024, we will continue to take a prudent approach in our business planning in 2025. We will
remain focused on quality growth and further empower our partners and users through our open platform. With the increasing maturity
and efficiency of large language models, we expect to allocate more resources to the application of AI across the credit scenarios in the
future. We believe such efforts will enable us to better navigate through the current environment and position us well to capture long-term
opportunities through innovative technologies, enhanced products and collaborative models.”
“We are pleased to report another quarter
of solid financial results and close the year on a strong note in a still uncertain macro environment. For 2024, total revenue was
RMB17.17 billion and Non-GAAP net income was RMB6.42 billion,” Mr. Alex Xu, Chief Financial Officer, commented. “Meanwhile,
we generated a record-breaking RMB9.34 billion cash from operations in 2024. Our strong financial positions not only allow us to consistently
execute our strategy and support business initiatives, but also enable us to further enhance returns to our shareholders by actively
executing 2025 share repurchase plan and significantly raising semi-annual dividends.”
Mr. Yan Zheng, Chief Risk Officer, added,
“Despite facing macro uncertainties, we significantly reduced our overall portfolio risks through 2024 by decisively tightening
risk standards early in the year. Overall risk performance reached the best level for the year in the fourth quarter. Among key leading
indicators, Day-1 delinquency rate*10 was 4.8% in the fourth quarter, and 30-day collection rate*11 was 88.1%.
We feel comfortable with current risk levels and expect to see relatively stable risk performance in the coming quarters as we seek growth
opportunities in a changing environment in 2025.”
10 “Day-1 delinquency rate” is defined
as (i) the total amount of principal that became overdue as of a specified date, divided by (ii) the total amount of principal
that was due for repayment as of such specified date.
11 “30-day collection rate” is defined
as (i) the amount of principal that was repaid in one month among the total amount of principal that became overdue as of a specified
date, divided by (ii) the total amount of principal that became overdue as of such specified date.
Fourth Quarter 2024 Financial Results
Total net revenue was RMB4,482.3 million
(US$614.1 million), compared to RMB4,495.5 million in the same period of 2023, and RMB4,370.2 million in the prior quarter.
Net revenue from Credit Driven Services
was RMB2,889.5 million (US$395.9 million), compared to RMB3,248.3 million in the same period of 2023, and RMB2,901.0 million in the prior
quarter.
Loan facilitation and servicing fees-capital
heavy were RMB363.0 million (US$49.7 million), compared to RMB481.2 million in the same period of 2023 and RMB258.7 million in the
prior quarter. The year-over-year and sequential changes were primarily due to the changes in capital-heavy loan facilitation volume.
Financing income*12 was RMB1,667.3
million (US$228.4 million), compared to RMB1,485.4 million in the same period of 2023 and RMB1,744.1 million in the prior quarter. The
year-over-year increase was primarily due to the growth in average outstanding balance of the on-balance-sheet loans.
Revenue from releasing of guarantee liabilities
was RMB761.8 million (US$104.4 million), compared to RMB1,211.8 million in the same period of 2023, and RMB794.6 million in the prior
quarter. The year-over-year decrease was mainly due to the decrease in average outstanding balance of off-balance-sheet capital-heavy
loans during the period.
Other services fees were RMB97.4 million
(US$13.3 million), compared to RMB69.8 million in the same period of 2023, and RMB103.7 million in the prior quarter. The year-over-year
increase reflected the increase in late payment fees under the credit driven services due to improvement in collection rates of late
paid loans.
Net revenue from Platform Services was
RMB1,592.8 million (US$218.2 million), compared to RMB1,247.2 million in the same period of 2023 and RMB1,469.1 million in the prior
quarter.
Loan facilitation and servicing fees-capital
light were RMB515.1 million (US$70.6 million), compared to RMB697.0 million in the same period of 2023 and RMB574.6 million in the
prior quarter. The year-over-year and sequential decreases were primarily due to the decreases in capital-light loan facilitation volume.
Referral services fees were RMB907.2 million
(US$124.3 million), compared to RMB446.5 million in the same period of 2023 and RMB763.1 million in the prior quarter. The year-over-year
and sequential increases were mainly due to the increases in loan facilitation volume through ICE.
Other services fees were RMB170.5 million
(US$23.4 million), compared to RMB103.8 million in the same period of 2023 and RMB131.4 million in the prior quarter.
Total operating costs and expenses were
RMB2,591.9 million (US$355.1 million), compared to RMB3,215.9 million in the same period of 2023 and RMB2,081.0 million in the prior
quarter.
Facilitation, origination and servicing expenses
were RMB734.7 million (US$100.6 million), compared to RMB731.8 million in the same period of 2023 and RMB707.9 million in the prior
quarter.
Funding costs were RMB126.8 million (US$17.4
million), compared to RMB161.0 million in the same period of 2023 and RMB146.8 million in the prior quarter. The year-over-year decrease
was mainly due to the lower average costs of ABS and trusts. The sequential decrease was mainly due to the decline in funding from ABS
and trusts and lower average costs.
Sales and marketing expenses were RMB523.9
million (US$71.8 million), compared to RMB551.6 million in the same period of 2023 and RMB419.9 million in the prior quarter. The year-over-year
decrease was primarily due to improved efficiency in acquiring new customers. The sequential increase was primarily due to a more proactive
customer acquisition effort and seasonal factors.
General and administrative expenses were
RMB156.1 million (US$21.4 million), compared to RMB108.0 million in the same period of 2023 and RMB92.0 million in the prior quarter.
Provision for loans receivable was RMB598.4
million (US$82.0 million), compared to RMB639.9 million in the same period of 2023 and RMB477.5 million in the prior quarter. The year-over-year
and sequential changes reflected the Company’s consistent approach in assessing provisions commensurate with its underlying loan
profile and changes in loan origination volume of on-balance-sheet loans.
Provision for financial assets receivable
was RMB63.3 million (US$8.7 million), compared to RMB148.2 million in the same period of 2023 and RMB64.4 million in the prior quarter.
The year-over-year decrease was mainly due to the decline in capital-heavy loan facilitation volume and reflected the Company’s
consistent approach in assessing provisions commensurate with its underlying loan profile. The sequential decrease was mainly due to
reversal of prior quarters’ provision in the quarter, offsetting by the increase in capital-heavy loan facilitation volume.
Provision for accounts receivable and contract
assets was RMB77.5 million (US$10.6 million), compared to RMB91.1 million in the same period of 2023 and RMB108.8 million in the
prior quarter. The year-over-year and sequential decreases reflected the Company’s consistent approach in assessing provisions
commensurate with its underlying loan profile.
Provision for contingent liability was
RMB311.4 million (US$42.7 million), compared to RMB784.3 million in the same period of 2023 and RMB63.6 million in the prior quarter.
The year-over-year and sequential changes reflected the Company’s consistent approach in assessing provisions commensurate with
its underlying loan profile as well as the changes in capital-heavy loan facilitation volume.
Income from operations was RMB1,890.3
million (US$259.0 million), compared to RMB1,279.6 million in the same period of 2023 and RMB2,289.2 million in the prior quarter.
Non-GAAP income from operations was RMB1,950.0
million (US$267.2 million), compared to RMB1,322.1 million in the same period of 2023 and RMB2,315.5 million in the prior quarter.
Operating margin was 42.2%. Non-GAAP
operating margin was 43.5%.
Income before income tax expense was RMB1,932.7
million (US$264.8 million), compared to RMB1,330.9 million in the same period of 2023 and RMB2,356.9 million in the prior quarter.
Income taxes expense was RMB20.0 million
(US$2.7 million), compared to RMB 223.2 million in the same period of 2023 and RMB558.1 million in the prior quarter. The year-over-year
and sequential changes were mainly due the writeback of withholding taxes related to the Company’s dividend and share repurchase
plans, as the Company became eligible to a lower tax rate in the fourth quarter.
Net income was RMB1,912.7 million (US$262.0
million), compared to RMB1,107.7 million in the same period of 2023 and RMB1,798.8 million in the prior quarter.
Non-GAAP net income was RMB1,972.4 million
(US$270.2 million), compared to RMB1,150.3 million in the same period of 2023 and RMB1,825.1 million in the prior quarter.
Net income margin was 42.7%. Non-GAAP
net income margin was 44.0%.
Net income attributed to the Company was
RMB1,916.6 million (US$262.6 million), compared to RMB1,111.7 million in the same period of 2023 and RMB1,802.9 million in the prior
quarter.
Non-GAAP net income attributed to the Company
was RMB1,976.4 million (US$270.8 million), compared to RMB1,154.3 million in the same period of 2023 and RMB1,829.2 million in the
prior quarter.
Net income per fully diluted ADS was RMB13.24
(US$1.82).
Non-GAAP net income per fully diluted ADS
was RMB13.66 (US$1.87).
Weighted average basic ADS used in calculating
GAAP net income per ADS was 142.94 million.
Weighted average diluted ADS used in calculating
GAAP and non-GAAP net income per ADS was 144.71 million.
12 “Financing income” is generated
from loans facilitated through the Company’s platform funded by the consolidated trusts and Fuzhou Microcredit, which charge fees
and interests from borrowers.
Full Year 2024 Financial Results
Total net revenue was RMB17,165.7 million
(US$2,351.7 million), compared to RMB16,290.0 million in 2023.
Net revenue from Credit Driven Services
was RMB11,719.0 million (US$1,605.5 million), compared to RMB11,738.6 million in 2023.
Loan facilitation and servicing fees-capital
heavy were RMB1,016.5 million (US$139.3 million), compared to RMB1,667.1 million in 2023. The year-over-year decrease was primarily
due to a decline in capital-heavy loan facilitation volume.
Financing income was RMB6,636.5 million
(US$909.2 million), compared to RMB5,109.9 million in 2023. The year-over-year increase was primarily due to the growth in average outstanding
balance of on-balance-sheet loans.
Revenue from releasing of guarantee liabilities
was RMB3,695.0 million (US$506.2 million), compared to RMB4,745.9 million in 2023. The year-over-year decrease was mainly due to
decrease in average outstanding balance of off-balance-sheet capital-heavy loans during the period.
Other services fees were RMB371.0 million
(US$50.8 million), compared to RMB215.6 million in 2023. The year-over-year increase was mainly due to an increase in late payment fees
in connection with improvement in collection rate of late paid loans under the credit driven services.
Net revenue from Platform Services was
RMB5,446.6 million (US$746.2 million), compared to RMB4,551.5 million in 2023.
Loan facilitation and servicing fees-capital
light were RMB2,116.8 million (US$290.0 million), compared to RMB3,214.0 million in 2023. The year-over-year decrease was primarily
due to a decline in loan facilitation volume under the capital-light model.
Referral services fees were RMB2,842.6
million (US$389.4 million), compared to RMB950.0 million in 2023. The year-over-year increase was primarily due to an increase in the
loan facilitation volume through ICE.
Other services fees were RMB487.2 million
(US$66.7 million), compared to RMB387.5 million in 2023.
Total operating costs and expenses were
RMB9,637.1 million (US$1,320.3 million), compared to RMB11,433.1 million in 2023.
Facilitation, origination and servicing expenses
were RMB2,900.7 million (US$397.4 million), compared to RMB2,659.9 million in 2023. The year-over-year increase was primarily due
to higher collection fees.
Funding costs were RMB590.9 million (US$81.0
million), compared to RMB645.4 million in 2023. The year-over-year decrease was mainly due to the lower average cost of ABS and trusts,
partially offset by the growth in funding from ABS and trusts.
Sales and marketing expenses were RMB1,725.9
million (US$236.4 million), compared to RMB1,939.9 million in 2023. The year-over-year decrease was mainly due to our prudent customer
acquisition approach and lower unit customer acquisition cost.
General and administrative expenses were
RMB449.5 million (US$61.6 million), compared to RMB421.1 million in 2023.
Provision for loans receivable was RMB2,773.3
million (US$379.9 million), compared to RMB2,151.0 million in 2023. The year-over-year increase was mainly due to the growth in loan
origination volume of on-balance-sheet loans.
Provision for financial assets receivable
was RMB296.9 million (US$40.7 million), compared to RMB386.1 million in 2023. The year-over-year decrease was mainly due to a decline
in capital-heavy loan facilitation volume.
Provision for accounts receivable and contract
assets was RMB421.5 million (US$57.7 million), compared to RMB175.8 million in 2023. The year-over-year increase reflected the Company’s
consistent approach in assessing provisions commensurate with its underlying loan profile.
Provision for contingent liability was
RMB478.4 million (US$65.5 million), compared to RMB3,053.8 million in 2023. The year-over-year decrease was mainly due to a decline in
in capital-heavy loan facilitation volume and the reversal of prior provision as loans facilitated in previous period performed better
than expected.
Income from operations was RMB7,528.6
million (US$1,031.4 million), compared to RMB4,857.0 million in 2023.
Non-GAAP income from operations was RMB7,696.2
million (US$1,054.4 million), compared to RMB5,042.6 million in 2023.
Operating margin was 43.9%. Non-GAAP
operating margin was 44.8%.
Income before income tax expense was RMB7,892.4
million (US$1,081.3 million), compared to RMB5,277.5 million in 2023.
Income taxes expense was RMB1,644.3 million
(US$225.3 million). Effective tax rate was 20.4%, compared to 18.5% in 2023. The increase in effective tax rate was mainly due to withholding
taxes related to the Company’s dividend and share repurchase plan.
Net income attributed to the Company was
RMB6,264.3 million (US$858.2 million), compared to RMB4,285.3 million in 2023.
Non-GAAP net income attributed to the Company
was RMB6,431.9 million (US$881.2 million), compared to RMB4,470.9 million in 2023.
Net income margin was 36.4%. Non-GAAP
net income margin was 37.4%.
Net income per fully diluted ADS was RMB41.28
(US$5.66).
Non-GAAP net income per fully diluted ADS
was RMB42.39 (US$5.81).
Weighted average basic ADS used in calculating
GAAP net income per ADS was 149.01 million.
Weighted average diluted ADS used in calculating
GAAP and non-GAAP net income per ADS was 151.72 million.
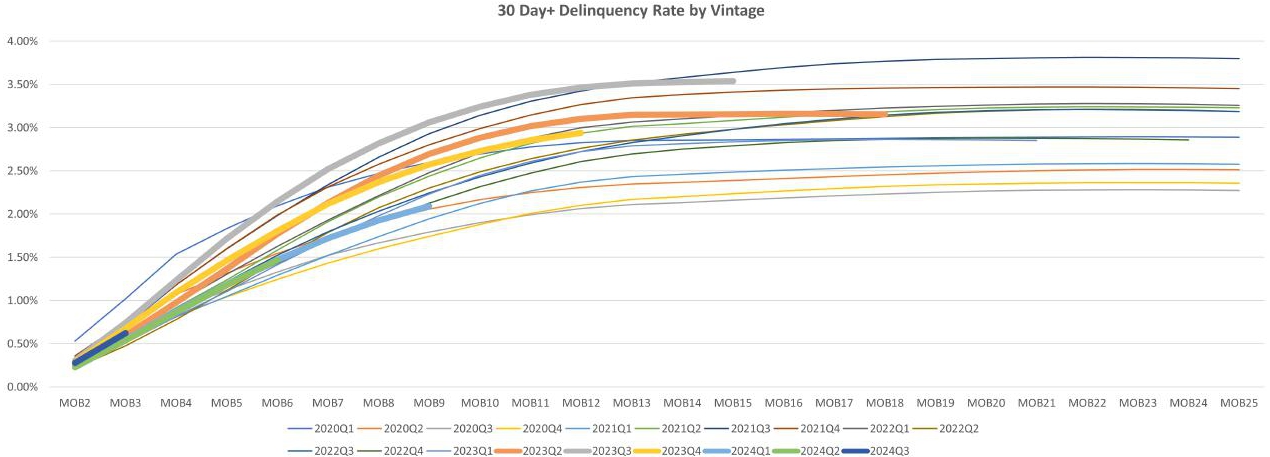
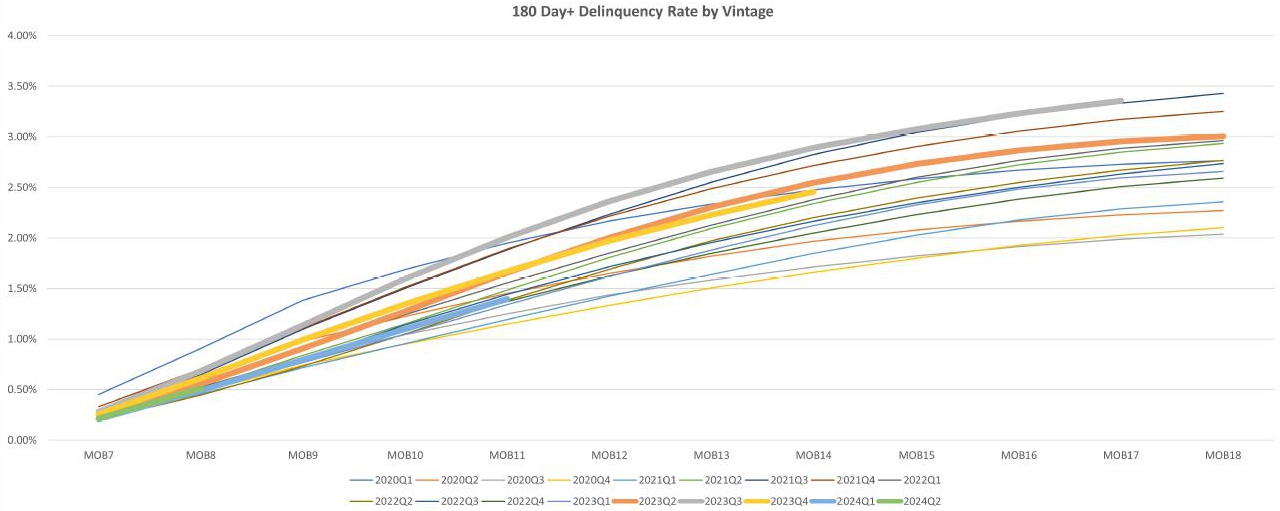
30 Day+ Delinquency Rate by Vintage and 180
Day+ Delinquency Rate by Vintage
The following charts and tables display the historical
cumulative 30 day+ delinquency rates by loan facilitation and origination vintage and 180 day+ delinquency rates by loan facilitation
and origination vintage for all loans facilitated and originated through the Company’s platform. Loans under “ICE”
and total technology solutions are not included in the 30 day+ charts and the 180 day+ charts:
Semi-Annual Dividend for the Second Half of
2024
The board of directors of the Company (the “Board”)
has approved a dividend of US$0.35 per Class A ordinary share, or US$0.70 per ADS for the second half of 2024 to holders of record
of Class A ordinary shares and ADSs as of the close of business on April 23, 2025 Hong Kong Time and New York Time, respectively,
in accordance with the Company’s dividend policy. For holder of Class A ordinary shares, in order to qualify for the dividend,
all valid documents for the transfers of shares accompanied by the relevant share certificates must be lodged for registration with the
Company’s Hong Kong branch share registrar, Computershare Hong Kong Investor Services Limited, at Shops 1712-1716, 17th Floor,
Hopewell Centre, 183 Queen’s Road East, Hong Kong no later than 4:30 p.m. on April 23, 2025 (Hong Kong Time). The payment
date is expected to be on May 28, 2025 for holders of Class A ordinary shares and around June 2, 2025 for holders of ADSs.
Update on Share Repurchase
On March 12, 2024, the Board approved a
share repurchase plan (the “2024 Share Repurchase Plan”) whereby the Company is authorized to repurchase its ADSs or Class A
ordinary shares with an aggregate value of up to US$350 million during the 12-month period from April 1, 2024.
In the fourth quarter the Company had in
aggregate purchased approximately 3.1 million ADSs in the open market for a total amount of approximately US$107 million
(inclusive of commissions) at an average price of US$34.5 per ADS. As of December 30, 2024, the Company had utilized
substantially all of the total authorized value for the 2024 Share Repurchase Plan.
On November 19, 2024, the Board approved
a new share repurchase plan (the “2025 Share Repurchase Plan”) whereby the Company is authorized to repurchase up to US$450
million worth of its ADSs or Class A ordinary shares over the next 12 months starting from January 1, 2025.
As of March 14, 2025, the Company had in
aggregate purchased approximately 2.2 million ADSs in the open market for a total amount of approximately US$86 million (inclusive
of commissions) at an average price of US$39.7 per ADS pursuant to the 2025 Share Repurchase Plan.
Business Outlook
As macro-economic uncertainties persist, the
Company intends to maintain a prudent approach in its business planning for 2025. Management will continue to focus on enhancing efficiency
of the Company’s operations. As such, for the first quarter of 2025, the Company expects to generate a net income between RMB1.75
billion and RMB1.85 billion and a non-GAAP net income*13 between RMB1.80 billion and RMB1.90 billion, representing a year-on-year
growth between 49% and 58%. This outlook reflects the Company’s current and preliminary views, which is subject to material changes.
13 Non-GAAP net income represents net income
excluding share-based compensation expenses.
Conference Call Preregistration
Qifu Technology’s management team will
host an earnings conference call at 7:30 AM U.S. Eastern Time on Monday, March 17, 2025 (7:30 PM Beijing Time on the same day).
All participants wishing to join the conference
call must pre-register online using the link provided below.
Registration Link: https://s1.c-conf.com/diamondpass/10045854-hg6t5r.html
Upon registration, each participant will receive
details for the conference call, including dial-in numbers and a unique access PIN. Please dial in 10 minutes before the call is scheduled
to begin.
Additionally, a live and archived webcast of
the conference call will be available on the Investor Relations section of the Company's website at https://ir.qifu.tech.
About Qifu Technology
Qifu Technology is a leading AI-empowered Credit-Tech
platform in China. By leveraging its sophisticated machine learning models and data analytics capabilities, the Company provides a comprehensive
suite of technology services to assist financial institutions and consumers and SMEs in the loan lifecycle, ranging from borrower acquisition,
preliminary credit assessment, fund matching and post-facilitation services. The Company is dedicated to making credit services more
accessible and personalized to consumers and SMEs through Credit-Tech services to financial institutions.
For more information, please visit: https://ir.qifu.tech.
Use of Non-GAAP Financial Measures Statement
To supplement our financial results presented
in accordance with U.S. GAAP, we use Non-GAAP financial measure, which is adjusted from results based on U.S. GAAP to exclude share-based
compensation expenses. Reconciliations of our Non-GAAP financial measures to our U.S. GAAP financial measures are set forth in tables
at the end of this earnings release, which provide more details on the Non-GAAP financial measures.
We use Non-GAAP income from operation, Non-GAAP
operating margin, Non-GAAP net income, Non-GAAP net income margin, Non-GAAP net income attributed to the Company and Non-GAAP net income
per fully diluted ADS in evaluating our operating results and for financial and operational decision-making purposes. Non-GAAP income
from operation represents income from operation excluding share-based compensation expenses. Non-GAAP operating margin is equal to Non-GAAP
income from operation divided by total net revenue. Non-GAAP net income represents net income excluding share-based compensation expenses.
Non-GAAP net income margin is equal to Non-GAAP net income divided by total net revenue. Non-GAAP net income attributed to the Company
represents net income attributed to the Company excluding share-based compensation expenses. Non-GAAP net income per fully diluted ADS
represents net income excluding share-based compensation expenses per fully diluted ADS. Such adjustments have no impact on income tax.
We believe that Non-GAAP income from operation, Non-GAAP operating margin, Non-GAAP net income, Non-GAAP net income margin, Non-GAAP
net income attributed to the Company and Non-GAAP net income per fully diluted ADS help identify underlying trends in our business that
could otherwise be distorted by the effect of certain expenses that we include in results based on U.S. GAAP. We believe that Non-GAAP
income from operation and Non-GAAP net income provide useful information about our operating results, enhance the overall understanding
of our past performance and future prospects and allow for greater visibility with respect to key metrics used by our management in its
financial and operational decision-making. Our Non-GAAP financial information should be considered in addition to results prepared in
accordance with U.S. GAAP, but should not be considered a substitute for or superior to U.S. GAAP results. In addition, our calculation
of Non-GAAP financial information may be different from the calculation used by other companies, and therefore comparability may be limited.
Exchange Rate Information
This announcement contains translations of certain
RMB amounts into U.S. dollars at specified rates solely for the convenience of the reader. Unless otherwise noted, all translations from
RMB to U.S. dollars are made at a rate of RMB 7.2993 to US$1.00, the exchange rate set forth in the H.10 statistical release of the Board
of Governors of the Federal Reserve System as of December 31, 2024.
Safe Harbor Statement
Any forward-looking statements contained in this
announcement are made under the “safe harbor” provisions of the U.S. Private Securities Litigation Reform Act of 1995. Forward-looking
statements can be identified by terminology such as “will,” “expects,” “anticipates,” “future,”
“intends,” “plans,” “believes,” “estimates” and similar statements. Among other things,
the business outlook and quotations from management in this announcement, as well as the Company’s strategic and operational plans,
contain forward-looking statements. Qifu Technology may also make written or oral forward-looking statements in its periodic reports
to the U.S. Securities and Exchange Commission (“SEC”), in announcements made on the website of The Stock Exchange of Hong
Kong Limited (the “Hong Kong Stock Exchange”), in its annual report to shareholders, in press releases and other written
materials and in oral statements made by its officers, directors or employees to third parties. Statements that are not historical facts,
including the Company’s business outlook, beliefs and expectations, are forward-looking statements. Forward-looking statements
involve inherent risks and uncertainties. A number of factors could cause actual results to differ materially from those contained in
any forward-looking statement, which factors include but not limited to the following: the Company’s growth strategies, the Company’s
cooperation with 360 Group, changes in laws, rules and regulatory environments, the recognition of the Company’s brand, market
acceptance of the Company’s products and services, trends and developments in the credit-tech industry, governmental policies relating
to the credit-tech industry, general economic conditions in China and around the globe, and assumptions underlying or related to any
of the foregoing. Further information regarding these and other risks and uncertainties is included in Qifu Technology’s filings
with the SEC and announcements on the website of the Hong Kong Stock Exchange. All information provided in this press release is as of
the date of this press release, and Qifu Technology does not undertake any obligation to update any forward-looking statement, except
as required under applicable law.
For more information, please contact:
Qifu Technology
E-mail: ir@360shuke.com
Unaudited Condensed Consolidated Balance Sheets
(Amounts in thousands of Renminbi (“RMB”)
and U.S. dollars (“USD”)
except for number of shares and per share data,
or otherwise noted)
| | |
December 31, | | |
December 31, | | |
December 31, | |
| | |
2023 | | |
2024 | | |
2024 | |
| | |
| RMB | | |
| RMB
| | |
| USD
| |
| ASSETS | |
| | | |
| | | |
| | |
| Current assets: | |
| | | |
| | | |
| | |
| Cash and cash equivalents | |
| 4,177,890 | | |
| 4,452,416 | | |
| 609,978 | |
| Restricted cash | |
| 3,381,107 | | |
| 2,353,384 | | |
| 322,412 | |
| Short term investments | |
| 15,000 | | |
| 3,394,073 | | |
| 464,987 | |
| Security deposit prepaid to third-party guarantee companies | |
| 207,071 | | |
| 162,617 | | |
| 22,278 | |
| Funds receivable from third party payment service providers | |
| 1,603,419 | | |
| 462,112 | | |
| 63,309 | |
| Accounts receivable and contract assets, net | |
| 2,909,245 | | |
| 2,214,530 | | |
| 303,389 | |
| Financial assets receivable, net | |
| 2,522,543 | | |
| 1,553,912 | | |
| 212,885 | |
| Amounts due from related parties | |
| 45,346 | | |
| 8,510 | | |
| 1,166 | |
| Loans receivable, net | |
| 24,604,487 | | |
| 26,714,428 | | |
| 3,659,862 | |
| Prepaid expenses and other assets | |
| 329,920 | | |
| 1,464,586 | | |
| 200,647 | |
| Total current assets | |
| 39,796,028 | | |
| 42,780,568 | | |
| 5,860,913 | |
| Non-current assets: | |
| | | |
| | | |
| | |
| Accounts receivable and contract assets, net-noncurrent | |
| 146,995 | | |
| 27,132 | | |
| 3,717 | |
| Financial assets receivable, net-noncurrent | |
| 596,330 | | |
| 170,779 | | |
| 23,397 | |
| Amounts due from related parties | |
| 4,240 | | |
| 51 | | |
| 7 | |
| Loans receivable, net-noncurrent | |
| 2,898,005 | | |
| 2,537,749 | | |
| 347,670 | |
| Property and equipment, net | |
| 231,221 | | |
| 362,774 | | |
| 49,700 | |
| Land use rights,net | |
| 977,461 | | |
| 956,738 | | |
| 131,073 | |
| Intangible assets | |
| 13,443 | | |
| 11,818 | | |
| 1,619 | |
| Goodwill | |
| 41,210 | | |
| 42,414 | | |
| 5,811 | |
| Deferred tax assets | |
| 1,067,738 | | |
| 1,206,325 | | |
| 165,266 | |
| Other non-current assets | |
| 45,901 | | |
| 36,270 | | |
| 4,969 | |
| Total non-current assets | |
| 6,022,544 | | |
| 5,352,050 | | |
| 733,229 | |
| TOTAL ASSETS | |
| 45,818,572 | | |
| 48,132,618 | | |
| 6,594,142 | |
| | |
| | | |
| | | |
| | |
| LIABILITIES AND EQUITY | |
| | | |
| | | |
| | |
| Current liabilities: | |
| | | |
| | | |
| | |
| Payable to investors of the consolidated trusts-current | |
| 8,942,291 | | |
| 8,188,454 | | |
| 1,121,814 | |
| Accrued expenses and other current liabilities | |
| 2,016,039 | | |
| 2,492,921 | | |
| 341,529 | |
| Amounts due to related parties | |
| 80,376 | | |
| 67,495 | | |
| 9,247 | |
| Short term loans | |
| 798,586 | | |
| 1,369,939 | | |
| 187,681 | |
| Guarantee liabilities-stand ready | |
| 3,949,601 | | |
| 2,383,202 | | |
| 326,497 | |
| Guarantee liabilities-contingent | |
| 3,207,264 | | |
| 1,820,350 | | |
| 249,387 | |
| Income tax payable | |
| 742,210 | | |
| 1,040,687 | | |
| 142,574 | |
| Other tax payable | |
| 163,252 | | |
| 109,161 | | |
| 14,955 | |
| Total current liabilities | |
| 19,899,619 | | |
| 17,472,209 | | |
| 2,393,684 | |
| Non-current liabilities: | |
| | | |
| | | |
| | |
| Deferred tax liabilities | |
| 224,823 | | |
| 439,435 | | |
| 60,202 | |
| Payable to investors of the consolidated trusts-noncurrent | |
| 3,581,800 | | |
| 5,719,600 | | |
| 783,582 | |
| Other long-term liabilities | |
| 102,473 | | |
| 255,155 | | |
| 34,956 | |
| Total non-current liabilities | |
| 3,909,096 | | |
| 6,414,190 | | |
| 878,740 | |
| TOTAL LIABILITIES | |
| 23,808,715 | | |
| 23,886,399 | | |
| 3,272,424 | |
| TOTAL QIFU TECHNOLOGY INC EQUITY | |
| 21,937,483 | | |
| 24,190,043 | | |
| 3,314,022 | |
| Noncontrolling interests | |
| 72,374 | | |
| 56,176 | | |
| 7,696 | |
| TOTAL EQUITY | |
| 22,009,857 | | |
| 24,246,219 | | |
| 3,321,718 | |
| TOTAL LIABILITIES AND EQUITY | |
| 45,818,572 | | |
| 48,132,618 | | |
| 6,594,142 | |
Unaudited Condensed Consolidated Statements
of Operations
(Amounts in thousands of Renminbi (“RMB”)
and U.S. dollars (“USD”)
except for number of shares and per share data,
or otherwise noted)
| | |
Three months
ended December 31, | | |
Year ended
December 31, | |
| | |
2023 | | |
2024 | | |
2024 | | |
2023 | | |
2024 | | |
2024 | |
| | |
RMB | | |
RMB | | |
USD | | |
RMB | | |
RMB | | |
USD | |
| Credit driven services | |
| 3,248,263 | | |
| 2,889,500 | | |
| 395,860 | | |
| 11,738,560 | | |
| 11,719,027 | | |
| 1,605,500 | |
| Loan facilitation and servicing fees-capital heavy | |
| 481,195 | | |
| 362,958 | | |
| 49,725 | | |
| 1,667,119 | | |
| 1,016,514 | | |
| 139,262 | |
| Financing income | |
| 1,485,446 | | |
| 1,667,340 | | |
| 228,425 | | |
| 5,109,921 | | |
| 6,636,511 | | |
| 909,198 | |
| Revenue from releasing of guarantee liabilities | |
| 1,211,787 | | |
| 761,827 | | |
| 104,370 | | |
| 4,745,898 | | |
| 3,695,017 | | |
| 506,215 | |
| Other services fees | |
| 69,835 | | |
| 97,375 | | |
| 13,340 | | |
| 215,622 | | |
| 370,985 | | |
| 50,825 | |
| Platform services | |
| 1,247,240 | | |
| 1,592,752 | | |
| 218,206 | | |
| 4,551,467 | | |
| 5,446,629 | | |
| 746,185 | |
| Loan facilitation and servicing fees-capital light | |
| 696,985 | | |
| 515,062 | | |
| 70,563 | | |
| 3,213,955 | | |
| 2,116,797 | | |
| 290,000 | |
| Referral services fees | |
| 446,486 | | |
| 907,207 | | |
| 124,287 | | |
| 950,016 | | |
| 2,842,637 | | |
| 389,440 | |
| Other services fees | |
| 103,769 | | |
| 170,483 | | |
| 23,356 | | |
| 387,496 | | |
| 487,195 | | |
| 66,745 | |
| Total net revenue | |
| 4,495,503 | | |
| 4,482,252 | | |
| 614,066 | | |
| 16,290,027 | | |
| 17,165,656 | | |
| 2,351,685 | |
| Facilitation, origination and servicing | |
| 731,787 | | |
| 734,659 | | |
| 100,648 | | |
| 2,659,912 | | |
| 2,900,704 | | |
| 397,395 | |
| Funding costs | |
| 161,016 | | |
| 126,841 | | |
| 17,377 | | |
| 645,445 | | |
| 590,935 | | |
| 80,958 | |
| Sales and marketing | |
| 551,590 | | |
| 523,936 | | |
| 71,779 | | |
| 1,939,885 | | |
| 1,725,877 | | |
| 236,444 | |
| General and administrative | |
| 108,037 | | |
| 156,061 | | |
| 21,380 | | |
| 421,076 | | |
| 449,505 | | |
| 61,582 | |
| Provision for loans receivable | |
| 639,886 | | |
| 598,353 | | |
| 81,974 | | |
| 2,151,046 | | |
| 2,773,323 | | |
| 379,944 | |
| Provision for financial assets receivable | |
| 148,198 | | |
| 63,251 | | |
| 8,665 | | |
| 386,090 | | |
| 296,857 | | |
| 40,669 | |
| Provision for accounts receivable and contract assets | |
| 91,105 | | |
| 77,450 | | |
| 10,611 | | |
| 175,799 | | |
| 421,481 | | |
| 57,743 | |
| Provision for contingent liabilities | |
| 784,323 | | |
| 311,372 | | |
| 42,658 | | |
| 3,053,810 | | |
| 478,404 | | |
| 65,541 | |
| Total operating costs and expenses | |
| 3,215,942 | | |
| 2,591,923 | | |
| 355,092 | | |
| 11,433,063 | | |
| 9,637,086 | | |
| 1,320,276 | |
| Income from operations | |
| 1,279,561 | | |
| 1,890,329 | | |
| 258,974 | | |
| 4,856,964 | | |
| 7,528,570 | | |
| 1,031,409 | |
| Interest income, net | |
| 46,970 | | |
| 74,951 | | |
| 10,268 | | |
| 217,307 | | |
| 237,015 | | |
| 32,471 | |
| Foreign exchange (loss) gain | |
| (815 | ) | |
| 2,680 | | |
| 367 | | |
| 2,356 | | |
| 1,512 | | |
| 207 | |
| Other income, net | |
| 5,209 | | |
| (35,251 | ) | |
| (4,829 | ) | |
| 230,936 | | |
| 125,325 | | |
| 17,169 | |
| Investment loss | |
| - | | |
| - | | |
| - | | |
| (30,112 | ) | |
| - | | |
| - | |
| Income before income tax expense | |
| 1,330,925 | | |
| 1,932,709 | | |
| 264,780 | | |
| 5,277,451 | | |
| 7,892,422 | | |
| 1,081,256 | |
| Income taxes expense | |
| (223,237 | ) | |
| (20,042 | ) | |
| (2,746 | ) | |
| (1,008,874 | ) | |
| (1,644,306 | ) | |
| (225,269 | ) |
| Net income | |
| 1,107,688 | | |
| 1,912,667 | | |
| 262,034 | | |
| 4,268,577 | | |
| 6,248,116 | | |
| 855,987 | |
| Net loss attributable to noncontrolling interests | |
| 4,052 | | |
| 3,970 | | |
| 544 | | |
| 16,759 | | |
| 16,198 | | |
| 2,219 | |
| Net income attributable to ordinary shareholders of the
Company | |
| 1,111,740 | | |
| 1,916,637 | | |
| 262,578 | | |
| 4,285,336 | | |
| 6,264,314 | | |
| 858,206 | |
| Net income per ordinary share attributable
to ordinary shareholders of Qifu Technology, Inc. | |
| | | |
| | | |
| | | |
| | | |
| | | |
| | |
| Basic | |
| 3.51 | | |
| 6.70 | | |
| 0.92 | | |
| 13.36 | | |
| 21.02 | | |
| 2.88 | |
| Diluted | |
| 3.44 | | |
| 6.62 | | |
| 0.91 | | |
| 13.04 | | |
| 20.64 | | |
| 2.83 | |
| | |
| | | |
| | | |
| | | |
| | | |
| | | |
| | |
| Net income per
ADS attributable to ordinary shareholders of Qifu Technology, Inc. | |
| | | |
| | | |
| | | |
| | | |
| | | |
| | |
| Basic | |
| 7.02 | | |
| 13.40 | | |
| 1.84 | | |
| 26.72 | | |
| 42.04 | | |
| 5.76 | |
| Diluted | |
| 6.88 | | |
| 13.24 | | |
| 1.82 | | |
| 26.08 | | |
| 41.28 | | |
| 5.66 | |
| | |
| | | |
| | | |
| | | |
| | | |
| | | |
| | |
| Weighted average shares used in calculating net income per ordinary share | |
| | | |
| | | |
| | | |
| | | |
| | | |
| | |
| Basic | |
| 316,325,750 | | |
| 285,872,913 | | |
| 285,872,913 | | |
| 320,749,805 | | |
| 298,012,150 | | |
| 298,012,150 | |
| Diluted | |
| 323,305,948 | | |
| 289,427,077 | | |
| 289,427,077 | | |
| 328,508,945 | | |
| 303,449,864 | | |
| 303,449,864 | |
Unaudited Condensed Consolidated Statements
of Cash Flows
(Amounts in thousands of Renminbi (“RMB”)
and U.S. dollars (“USD”)
except for number of shares and per share data,
or otherwise noted)
| | |
Three months
ended December 31, | | |
Year ended
December 31, | |
| | |
2023 | | |
2024 | | |
2024 | | |
2023 | | |
2024 | | |
2024 | |
| | |
RMB | | |
RMB | | |
USD | | |
RMB | | |
RMB | | |
USD | |
| Net cash provided by operating activities | |
| 2,351,791 | | |
| 3,051,606 | | |
| 418,067 | | |
| 7,118,350 | | |
| 9,343,311 | | |
| 1,280,027 | |
| Net cash used in investing activities | |
| (1,885,694 | ) | |
| (945,611 | ) | |
| (129,548 | ) | |
| (11,147,789 | ) | |
| (7,994,081 | ) | |
| (1,095,184 | ) |
| Net cash (used in) provided by financing activities | |
| (911,621 | ) | |
| (1,873,516 | ) | |
| (256,671 | ) | |
| 1,066,458 | | |
| (2,114,463 | ) | |
| (289,680 | ) |
| Effect of foreign exchange rate changes | |
| (877 | ) | |
| 31,464 | | |
| 4,311 | | |
| 9,615 | | |
| 12,036 | | |
| 1,649 | |
| Net (decrease) increase in cash and cash equivalents | |
| (446,401 | ) | |
| 263,943 | | |
| 36,159 | | |
| (2,953,366 | ) | |
| (753,197 | ) | |
| (103,188 | ) |
| Cash, cash equivalents, and restricted cash, beginning of period | |
| 8,005,398 | | |
| 6,541,857 | | |
| 896,231 | | |
| 10,512,363 | | |
| 7,558,997 | | |
| 1,035,578 | |
| Cash, cash equivalents, and restricted cash, end of period | |
| 7,558,997 | | |
| 6,805,800 | | |
| 932,390 | | |
| 7,558,997 | | |
| 6,805,800 | | |
| 932,390 | |
Unaudited Condensed Consolidated Statements
of Comprehensive (Loss)/Income
(Amounts in thousands of Renminbi (“RMB”)
and U.S. dollars (“USD”)
except for number of shares and per share data,
or otherwise noted)
| | |
Three
months ended December 31, | |
| | |
2023 | | |
2024 | | |
2024 | |
| | |
RMB | | |
RMB | | |
USD | |
| Net income | |
| 1,107,688 | | |
| 1,912,667 | | |
| 262,034 | |
| Other comprehensive income, net of tax of nil: | |
| | | |
| | | |
| | |
| Foreign currency translation adjustment | |
| (3,606 | ) | |
| 145,610 | | |
| 19,948 | |
| Other comprehensive (loss) income | |
| (3,606 | ) | |
| 145,610 | | |
| 19,948 | |
| Total comprehensive income | |
| 1,104,082 | | |
| 2,058,277 | | |
| 281,982 | |
| Comprehensive loss attributable to noncontrolling interests | |
| 4,052 | | |
| 3,970 | | |
| 544 | |
| Comprehensive income attributable to ordinary shareholders | |
| 1,108,134 | | |
| 2,062,247 | | |
| 282,526 | |
| | |
| | | |
| | | |
| | |
| | |
Year ended
December 31, | |
| | |
2023 | | |
2024 | | |
2024 | |
| | |
RMB | | |
RMB | | |
USD | |
| Net income | |
| 4,268,577 | | |
| 6,248,116 | | |
| 855,987 | |
| Other comprehensive income, net of tax of nil: | |
| | | |
| | | |
| | |
| Foreign currency translation adjustment | |
| 17,118 | | |
| 46,534 | | |
| 6,375 | |
| Other comprehensive income | |
| 17,118 | | |
| 46,534 | | |
| 6,375 | |
| Total comprehensive income | |
| 4,285,695 | | |
| 6,294,650 | | |
| 862,362 | |
| Comprehensive loss attributable to noncontrolling interests | |
| 16,759 | | |
| 16,198 | | |
| 2,219 | |
| Comprehensive income attributable to ordinary shareholders | |
| 4,302,454 | | |
| 6,310,848 | | |
| 864,581 | |
Unaudited Reconciliations of GAAP and Non-GAAP
Results
(Amounts in thousands of Renminbi (“RMB”)
and U.S. dollars (“USD”)
except for number of shares and per share data,
or otherwise noted)
| | |
Three
months ended December 31, | |
| | |
2023 | | |
2024 | | |
2024 | |
| | |
RMB | | |
RMB | | |
USD | |
| Reconciliation of Non-GAAP Net Income to Net Income | |
| | |
| | |
| |
| Net income | |
| 1,107,688 | | |
| 1,912,667 | | |
| 262,034 | |
| Add: Share-based compensation expenses | |
| 42,572 | | |
| 59,720 | | |
| 8,182 | |
| Non-GAAP net income | |
| 1,150,260 | | |
| 1,972,387 | | |
| 270,216 | |
| GAAP net income margin | |
| 24.6 | % | |
| 42.7 | % | |
| | |
| Non-GAAP net income margin | |
| 25.6 | % | |
| 44.0 | % | |
| | |
| | |
| | | |
| | | |
| | |
| Net income attributable to shareholders of Qifu Technology,
Inc. | |
| 1,111,740 | | |
| 1,916,637 | | |
| 262,578 | |
| Add: Share-based compensation expenses | |
| 42,572 | | |
| 59,720 | | |
| 8,182 | |
| Non-GAAP net income attributable
to shareholders of Qifu Technology, Inc. | |
| 1,154,312 | | |
| 1,976,357 | | |
| 270,760 | |
| Weighted average ADS used in calculating net income per ordinary
share for both GAAP and non-GAAP EPS -diluted | |
| 161,652,974 | | |
| 144,713,538 | | |
| 144,713,538 | |
| Net income per ADS attributable to ordinary shareholders of
Qifu Technology, Inc. -diluted | |
| 6.88 | | |
| 13.24 | | |
| 1.82 | |
| Non-GAAP net income per ADS attributable to ordinary shareholders
of Qifu Technology, Inc. -diluted | |
| 7.14 | | |
| 13.66 | | |
| 1.87 | |
| | |
| | | |
| | | |
| | |
| Reconciliation of Non-GAAP Income from operations to
Income from operations | |
| | | |
| | | |
| | |
| Income from operations | |
| 1,279,561 | | |
| 1,890,329 | | |
| 258,974 | |
| Add: Share-based compensation expenses | |
| 42,572 | | |
| 59,720 | | |
| 8,182 | |
| Non-GAAP Income from operations | |
| 1,322,133 | | |
| 1,950,049 | | |
| 267,156 | |
| GAAP operating margin | |
| 28.5 | % | |
| 42.2 | % | |
| | |
| Non-GAAP operating margin | |
| 29.4 | % | |
| 43.5 | % | |
| | |
| | |
Year ended
December 31, | |
| | |
2023 | | |
2024 | | |
2024 | |
| | |
RMB | | |
RMB | | |
USD | |
| Reconciliation of Non-GAAP Net Income to Net Income | |
| | |
| | |
| |
| Net income | |
| 4,268,577 | | |
| 6,248,116 | | |
| 855,987 | |
| Add: Share-based compensation expenses | |
| 185,604 | | |
| 167,613 | | |
| 22,963 | |
| Non-GAAP net income | |
| 4,454,181 | | |
| 6,415,729 | | |
| 878,950 | |
| GAAP net income margin | |
| 26.2 | % | |
| 36.4 | % | |
| | |
| Non-GAAP net income margin | |
| 27.3 | % | |
| 37.4 | % | |
| | |
| | |
| | | |
| | | |
| | |
| Net income attributable to shareholders of Qifu Technology,
Inc. | |
| 4,285,336 | | |
| 6,264,314 | | |
| 858,206 | |
| Add: Share-based compensation expenses | |
| 185,604 | | |
| 167,613 | | |
| 22,963 | |
| Non-GAAP net income attributable to shareholders of Qifu
Technology, Inc. | |
| 4,470,940 | | |
| 6,431,927 | | |
| 881,169 | |
| Weighted average ADS used in calculating net income per ordinary
share for both GAAP and non-GAAP EPS -diluted | |
| 164,254,473 | | |
| 151,724,932 | | |
| 151,724,932 | |
| Net income per ADS attributable to ordinary shareholders of
Qifu Technology, Inc. -diluted | |
| 26.08 | | |
| 41.28 | | |
| 5.66 | |
| Non-GAAP net income per ADS attributable to ordinary shareholders
of Qifu Technology, Inc. -diluted | |
| 27.22 | | |
| 42.39 | | |
| 5.81 | |
| | |
| | | |
| | | |
| | |
| Reconciliation of Non-GAAP Income from operations to
Income from operations | |
| | | |
| | | |
| | |
| Income from operations | |
| 4,856,964 | | |
| 7,528,570 | | |
| 1,031,409 | |
| Add: Share-based compensation expenses | |
| 185,604 | | |
| 167,613 | | |
| 22,963 | |
| Non-GAAP Income from operations | |
| 5,042,568 | | |
| 7,696,183 | | |
| 1,054,372 | |
| GAAP operating margin | |
| 29.8 | % | |
| 43.9 | % | |
| | |
| Non-GAAP operating margin | |
| 31.0 | % | |
| 44.8 | % | |
| | |
Grafico Azioni Qifu Technology (NASDAQ:QFIN)
Storico
Da Feb 2025 a Mar 2025

Grafico Azioni Qifu Technology (NASDAQ:QFIN)
Storico
Da Mar 2024 a Mar 2025

