false
0001295401
0001295401
2025-01-30
2025-01-30
iso4217:USD
xbrli:shares
iso4217:USD
xbrli:shares
UNITED STATES
SECURITIES AND EXCHANGE COMMISSION
Washington, D.C. 20549
Form 8-K
Current Report
Pursuant to Section 13 or 15(d) of the Securities
Exchange Act of 1934
Date of Report (Date of earliest event
reported): January 30, 2025
The Bancorp, Inc.
(Exact name of registrant as specified in its charter)
Commission File Number: 000-51018
| Delaware |
|
23-3016517 |
| (State or other jurisdiction of |
|
(IRS Employer |
| incorporation) |
|
Identification No.) |
409 Silverside Road
Wilmington, DE 19809
(Address of principal executive offices, including
zip code)
302-385-5000
(Registrant’s telephone number, including
area code)
(Former name or former address, if changed since
last report)
Check the appropriate box below if the Form 8-K filing is intended
to simultaneously satisfy the filing obligation of the registrant under any of the following provisions:
[_] Written communications pursuant to Rule 425 under the
Securities Act (17 CFR 230.425)
[_] Soliciting material pursuant to Rule 14a-12 under the Exchange Act (17 CFR 240.14a-12)
[_] Pre-commencement communications pursuant to Rule 14d-2(b) under the Exchange Act (17 CFR 240.14d-2(b))
[_] Pre-commencement communications pursuant to Rule 13e-4(c)
under the Exchange Act (17 CFR 240.13e-4(c))
Securities registered pursuant to Section 12(b) of the Act:
| Title of each class |
|
Trading
Symbol(s) |
|
Name of each exchange on which registered |
| Common Stock, par value $1.00 per share |
|
TBBK |
|
Nasdaq Global Select |
Indicate by check mark whether the registrant is an emerging growth
company as defined in Rule 405 of the Securities Act of 1933 (§230.405) or Rule 12b-2 of the Securities Exchange Act of 1934 (§240.12b-2).
[_] Emerging growth company
If an emerging growth company, indicate by check mark if the registrant
has elected not to use the extended transition period for complying with any new or revised financial accounting standards provided pursuant
to Section 13(a) of the Exchange Act. [ ]
| Item 2.02. |
Results of Operations and Financial Condition |
On January 30, 2025, The Bancorp, Inc. (the
"Company") issued a press release regarding its earnings for the three and twelve months ended December 31, 2024. A copy
of this press release is furnished with this report as Exhibit 99.1.
| Item 7.01. |
Regulation FD Disclosure. |
The Company hereby furnishes the information set
forth in the presentation attached hereto as Exhibit 99.2, which is incorporated herein by reference.
The information being furnished pursuant to Item
2.02 and Item 7.01 in this Current Report, including the exhibits hereto, is to be considered “furnished” pursuant to Form
8-K and shall not be deemed “filed” for purposes of Section 18 of the Securities Exchange Act of 1934, as amended, or otherwise
subject to the liabilities of that section. The information in this Current Report shall not be incorporated by reference into any registration
statement or other document pursuant to the Securities Act of 1933, as amended.
| Item 9.01. |
Financial Statements and Exhibits |
SIGNATURES
Pursuant to the requirements of the Securities Exchange Act of 1934, the
registrant has duly caused this report to be signed on its behalf by the undersigned hereunto duly authorized.
| Date:
January 30, 2025 |
The Bancorp, Inc. |
| |
|
|
| |
By: |
/s/ Paul Frenkiel |
| |
Name: |
Paul Frenkiel |
| |
Title: |
Chief Financial Officer and |
| |
|
Secretary |
Exhibit 99.1
The
Bancorp, Inc. Reports Fourth Quarter and Full Year 2024 Financial Results and Updates 2025 Guidance
Wilmington, DE – January 30, 2025 – The Bancorp, Inc. (“The
Bancorp” or the “Company” or “we” or “our”) (NASDAQ: TBBK), a financial holding company, today
reported its financial results for the fourth quarter and full year of 2024.
Recent Developments
On December 31, 2024, the Company's wholly owned subsidiary, The Bancorp
Bank, National Association (the "Bank"), closed on the sale of an $82 million real estate bridge loan (“REBL”) portfolio,
collateralized by apartment buildings. The sale included a $32.5 million classified loan, which was current with respect to monthly payments.
The Bank provided financing to a third-party purchaser, which provided a 25% payment guaranty. The leverage and guaranty provided were
consistent with market terms, and the Bank’s general underwriting standards for similar loans. The resulting weighted average look-through
loan to values (“LTVs”), of the related mortgaged properties are no more than 57% as-is and 55% as-stabilized, which are further
supported by the 25% payment guaranty. The look-through LTVs are the weighted average of LTVs multiplied by the leverage provided by the
Company, based upon appraisals performed within the past 15 months. There was no loss of principal in connection with the sale, although
$1.3 million of accrued interest was reversed in connection therewith. We believe that the sale is an indication of the liquidity of the
portfolio, as further evidenced by “as is” and “as stabilized” LTVs, respectively, of 77% and 68% for total special
mention and substandard REBL loans, based upon appraisals performed within the past 12 months.
Primarily as a result of the aforementioned $32.5 million substandard loan
in that sale, total substandard loans decreased 14%, to $134.4 million at December 31, 2024, from $155.4 million at September 30, 2024.
Substandard loans were further reduced on January 2, 2025 on which date a $12.3 million substandard loan was repaid without loss of principal,
as a result of the sale of the underlying apartment building collateral in Plainfield New Jersey. As noted in the third quarter earnings
release, a significant portion of the REBL portfolio was reviewed during that quarter by a firm specializing in such analysis, which
resulted in no additional Special Mention or Substandard determinations. Additionally, the 100 basis points of Federal Reserve rate reductions
may provide cash flow benefits to floating rate borrowers. Underlying property values as supported by the LTVs noted above, also continue
to facilitate the recapitalization of certain loans from borrowers experiencing cash flow issues, to borrowers with greater financial
capacity. At December 31, 2024, special mention real estate bridge loans amounted to $84.4 million which was unchanged from September
30, 2024.
The majority of the Company’s real estate owned is comprised of an
apartment complex, with a balance as of December 31, 2024 of $41.1 million. That property is under agreement of sale with a sales price
that is expected to cover the Company’s current balance plus the forecasted cost of improvements to the property. The purchaser
has increased the total of earnest money deposits to $1.6 million, from $500,000, in consideration of extending the closing date to March
21, 2025. The Company believes that the purpose for the extension is to allow time for this sale to be included in a larger transaction.
There can be no assurance that the purchaser will consummate the sale of the property, but if not consummated, the earnest money deposits
of $1.6 million would accrue to the Company.
Highlights
| · | The Bancorp reported net income of $55.9 million, or $1.15 per diluted share (“EPS”), for the quarter ended December
31, 2024, compared to net income of $44.0 million, or $0.81 per diluted share, for the quarter ended December 31, 2023, or an EPS
increase of 42%. While net income increased 27% between these periods, outstanding shares were reduced as a result of repurchases, which
were significantly increased in 2024. |
| · | Return on assets and return on equity for the quarter ended December 31, 2024, amounted to 2.6% and 28%, respectively, compared to
2.4% and 22%, respectively, for the quarter ended December 31, 2023 (all percentages “annualized”). |
| · | Net interest income increased 2% to $94.3 million for the quarter ended December 31, 2024, compared to $92.2 million for the quarter
ended December 31, 2023. Fourth quarter 2024 net interest income was reduced by the reversal of $1.3 million of interest related to the
sale of $82.0 million loans as described in “Recent Developments” above. |
| · | Net interest margin amounted to 4.55% for the quarter ended December 31, 2024, compared to 5.26% for the quarter ended December 31,
2023, and 4.78% for the quarter ended September 30, 2024. Net interest margin for fourth quarter 2024 was reduced by the interest reversal
noted directly above. |
| · | Loans, net of deferred fees and costs were $6.11 billion at December 31, 2024, compared to $5.36 billion at December 31, 2023
and $5.91 billion at September 30, 2024. Those changes reflected an increase of 4% quarter over linked quarter and an increase of 14%
year over year. |
| · | Gross dollar volume (“GDV”), representing the total amounts spent on prepaid and debit cards, increased $6.36 billion,
or 19%, to $39.66 billion for the quarter ended December 31, 2024, compared to the quarter ended December 31, 2023. The increase reflected
continued organic growth with existing partners and the impact of clients added within the past year. Total prepaid, debit card, ACH,
and other payment fees increased 16% to $29.2 million for the fourth quarter of 2024 compared to the fourth quarter of 2023. Consumer
credit fintech fees amounted to $3.0 million for the fourth quarter 2024, as a result of our initial entry into credit sponsorship in
2024. |
| · | Small business loans (“SBLs”), including those held at fair value, amounted to $987.0 million at December 31, 2024,
or 12% higher year over year, and 3% higher quarter over linked quarter, excluding the impact of loans with related secured borrowings. |
| · | Direct lease financing balances increased 2% year over year to $700.6 million at December 31, 2024, and decreased 2% from September
30, 2024. |
| · | Reflecting the aforementioned sale of $82.0 million of loans on December 31, 2024, real estate bridge loans of $2.11 billion decreased
4% compared to a $2.19 billion balance at September 30, 2024, and increased 5% compared to the December 31, 2023 balance of $2.00 billion.
These real estate bridge loans consist entirely of rehabilitation loans for apartment buildings. |
| · | Security backed lines of credit (“SBLOC”), insurance backed lines of credit (“IBLOC”), and investment advisor
financing loans collectively decreased 1% year over year and increased 3% quarter over linked quarter to $1.84 billion at December
31, 2024. |
| · | The average interest rate on $7.70 billion of average deposits and interest-bearing liabilities during the fourth quarter of
2024 was 2.31%. Average deposits of $7.55 billion for the fourth quarter of 2024 increased $1.30 billion, or 21% over fourth quarter 2023. |
| · | As of December 31, 2024, tier 1 capital to average assets (leverage), tier 1 capital to risk-weighted assets, total capital to
risk-weighted assets and common equity tier 1 to risk-weighted assets ratios were 9.41%, 13.88%, 14.46% and 13.88%, respectively, compared
to well-capitalized minimums of 5%, 8%, 10% and 6.5%, respectively. The Bancorp Bank, National Association, remains well capitalized under
banking regulations. |
| · | Book value per common share at December 31, 2024 was $16.55 compared to $15.17 per common share at December
31, 2023, an increase of 9%. |
| · | The Bancorp repurchased 919,584 shares of its common stock at an average cost of $54.37 per share during the quarter
ended December 31, 2024. As a result of share repurchases, outstanding shares at December 31, 2024 amounted to 47.7 million, compared
to 53.2 million shares at December 31, 2023, or a reduction of 10%. |
| · | The Bancorp emphasizes safety and soundness and its balance sheet has a risk profile enhanced by the special nature of the collateral
supporting its loan niches, related underwriting, and the characteristics of its funding sources, including those highlighted in the bullets
below. Those loan niches and funding sources have contributed to increased earnings levels, even during periods in which markets have
experienced various economic stresses. |
| · | The vast majority of The Bancorp’s funding is comprised of FDIC-insured and/or small balance accounts, which adjust to only
a portion of changes in rates. The Company also has lines of credit with U.S. government sponsored agencies totaling approximately $3.00
billion as of December 31, 2024, as well as access to other forms of liquidity. |
| · | In its REBL portfolio, the Company has minimal exposure to non-multifamily commercial real estate such as office buildings, and instead
has a portfolio largely comprised of rehabilitation bridge loans for apartment buildings. These loans generally have three-year terms
with two one-year extensions to allow for the rehabilitation work to be completed and rentals stabilized for an extended period, before
being refinanced at lower rates through U.S. Government Sponsored Entities or other lenders. The REBL portfolio consists primarily of
workforce housing, which we consider to be working class apartments at more affordable rental rates. Related collateral values should
accordingly be more stable than higher rent properties, even in stressed economies. While the macro-economic environment has challenged
the multifamily bridge space, the stability of the Company’s REBL portfolio is evidenced by the estimated values of the underlying
collateral. The Company’s $2.1 billion apartment bridge lending portfolio at December 31, 2024, has a weighted average origination
date “as is” loan-to-value ratio of 70%, based on third-party appraisals. Further, the weighted average origination date “as
stabilized” LTV, which measures the estimated value of the apartments after the rehabilitation is complete may provide even greater
protection. |
| · | As part of the underwriting process, The Bancorp reviews prospective borrowers’ previous rehabilitation experience in addition
to overall financial wherewithal. These transactions also include significant borrower equity contributions with required performance
metrics. Underwriting generally includes, but is not limited to, assessment of local market information relating to vacancy
and rental rates, review of post rehabilitation rental rate assumptions against geo-specific affordability indices, negative news searches,
lien searches, visitations by bank personnel and/or designated engineers, and other information sources. |
| · | Rehabilitation progress is monitored through ongoing draw requests and financial reporting covenants. This generally allows for early
identification of potential issues, and expedited action to address on a timely basis. |
| · | Operations and ongoing loan evaluation are overseen by multiple levels of management, in addition to the REBL team’s experienced
professional staff and third-party consultants utilized during the underwriting and asset management process. This oversight includes
a separate loan committee specific to REBL, which is comprised of seasoned and experienced lending professionals who do not directly report
to anyone on the REBL team. There is also a separate loan review department, a surveillance committee and additional staff which evaluate
potential losses under the current expected credit losses methodology (“CECL”), all of which similarly do not report to anyone
on the REBL team. |
| · | SBLOC and IBLOC portfolios are respectively secured by marketable securities and the cash value of life insurance. The majority of
SBA 7(a) loans are government guaranteed, while SBA 504 loans are made with 50%-60% LTVs. |
| · | Additional details regarding our loan portfolios are included in the related tables in this press release, as is the summarization
of the earnings contributions of our payments businesses, which further enhances The Bancorp’s risk profile. The Company’s
risk profile inherent in its loan portfolios, funding and earnings levels, may present opportunities to further increase stockholder value,
while still prudently maintaining capital levels. |
| · | In the second quarter of 2024, the Company purchased approximately $900 million of fixed rate government sponsored entity backed commercial
and residential mortgage securities of varying maturities, with an approximate 5.11% weighted average yield, and estimated weighted average
lives of eight years, to reduce its exposure to lower levels of net interest income. Such purchases would also reduce the additional net
interest income which will result if the Federal Reserve increases rates. While there are many variables and limitations to estimating
exposure to changes in rates, such purchases and continuing fixed rate loan originations are projected to reduce such exposure to modest
levels. In prior years, The Bancorp deferred adding fixed rate securities when yields were particularly low, which has afforded the flexibility
to benefit from, and secure, more advantageous securities and loan rates. |
“2024 was another year of significant Fintech business expansion
and earnings per share growth of 23%”, said Damian Kozlowski, President and CEO of The Bancorp. “Led by the growth in
our Fintech solutions group, we are affirming 2025 guidance of $5.25 a share. The guidance does not include $150 million share of planned
buybacks in 2025, or $37.5 million per quarter. Planned buybacks have been reduced $100 million in 2025 from 2024 to facilitate the repayment
of $96 million of senior secured debt.”
Conference Call Webcast
You may access the LIVE webcast of The Bancorp's Quarterly Earnings Conference
Call at 8:00 AM ET Friday, January 31, 2025, by clicking on the webcast link on The Bancorp's homepage at www.thebancorp.com. or you may
dial 1.800.549.8228, conference ID 18739. You may listen to the replay of the webcast following the live call on The Bancorp's investor
relations website (archived for one year) or telephonically until Friday, February 7, 2025, by dialing 1.888.660.6264, playback code 18739#.
About The Bancorp
The Bancorp, Inc. (NASDAQ: TBBK), headquartered in Wilmington, Delaware,
through its subsidiary, The Bancorp Bank, National Association provides a variety of services including providing non-bank financial companies
with the people, processes, and technology to meet their unique banking needs. Through its Fintech Solutions, Institutional Banking, Commercial
Lending, and Real Estate Bridge Lending businesses, The Bancorp provides partner-focused solutions paired with cutting-edge technology
for companies that range from entrepreneurial startups to Fortune 500 companies. With over 20 years of experience, The Bancorp has become
a leader in the financial services industry, earning recognition as the #1 issuer of prepaid cards in the U.S., a nationwide provider
of bridge financing for real estate capital improvement plans, an SBA National Preferred Lender, a leading provider of securities-backed
lines of credit, with one of the few bank-owned commercial vehicle leasing groups. By its company-wide commitment to excellence, The Bancorp
has also been ranked as one of the 100 Fastest-Growing Companies by Fortune, a Top 50 Employer by Equal Opportunity Magazine and was selected
to be included in the S&P Small Cap 600. For more about The Bancorp, visit https://thebancorp.com/.
Forward-Looking Statements
Statements in this earnings release regarding The Bancorp’s business
that are not historical facts, are “forward-looking statements.” These statements may be identified by the use of forward-looking
terminology, including, but not limited to the words “intend,” “may,” “believe,” “will,”
“expect,” “look,” “anticipate,” “plan,” “estimate,” “continue,”
or similar words. Forward-looking statements include, but are not limited to, statements regarding our annual fiscal 2024 results, our
anticipated 2025 profitability, increased growth and the impact of stock buybacks, relate to our current assumptions, projections and
expectations about our business and future events, including current expectations about important economic, political, and technological
factors, among other factors, and are subject to risks and uncertainties, which could cause the actual results, events, or achievements
to differ materially from those set forth in or implied by the forward-looking statements and related assumptions. Factors that could
cause results to differ from those expressed in the forward-looking statements also include, but are not limited to the risks and uncertainties
referenced or described in The Bancorp’s filings with the Securities and Exchange Commission, including the “Risk Factors”
and “Management’s Discussion and Analysis of Financial Condition and Results of Operations” sections of the Company’s
Annual Report on Form 10-K for the fiscal year ended December 31, 2023 and Quarterly Reports on Forms 10-Q for the periods ended March
31, 2024, June 30, 2024 and September 30, 2024 and other documents that the Company files from time to time with the Securities and Exchange
Commission. The forward-looking statements speak only as of the date of this press release. The Bancorp does not undertake any duty to
publicly revise or update forward-looking statements in this press release to reflect events or circumstances that arise after the date
of this press release, except as may be required under applicable law.
The Bancorp, Inc. Contact
Andres Viroslav
Director, Investor Relations
215-861-7990
andres.viroslav@thebancorp.com
Source: The Bancorp, Inc.
The Bancorp, Inc.
Financial highlights
(unaudited)
| |
Three months ended |
|
Year ended |
| |
December 31, |
|
December 31, |
| Consolidated condensed income statements |
2024 |
|
2023 |
|
2024 |
|
2023 |
| |
(Dollars in thousands, except per share and share data) |
| |
|
|
|
|
|
|
|
|
|
|
|
| Net interest income |
$ |
94,296 |
|
$ |
92,159 |
|
$ |
376,241 |
|
$ |
354,052 |
| Provision for credit losses on non-consumer fintech loans |
|
2,003 |
|
|
4,056 |
|
|
9,319 |
|
|
8,465 |
| Provision for credit losses on consumer fintech loans(1) |
|
19,619 |
|
|
— |
|
|
19,619 |
|
|
— |
| Provision (reversal) for unfunded commitments |
|
(256) |
|
|
258 |
|
|
(596) |
|
|
(135) |
| Provision (reversal) for credit loss on security |
|
(1,000) |
|
|
10,000 |
|
|
(1,000) |
|
|
10,000 |
| Non-interest income |
|
|
|
|
|
|
|
|
|
|
|
| Fintech fees |
|
|
|
|
|
|
|
|
|
|
|
| ACH, card and other payment processing fees |
|
4,740 |
|
|
2,669 |
|
|
14,596 |
|
|
9,822 |
| Prepaid, debit card and related fees |
|
24,465 |
|
|
22,404 |
|
|
97,413 |
|
|
89,417 |
| Consumer credit fintech fees |
|
3,049 |
|
|
— |
|
|
4,789 |
|
|
— |
| Total fintech fees |
|
32,254 |
|
|
25,073 |
|
|
116,798 |
|
|
99,239 |
| Net realized and unrealized gains (losses) on commercial |
|
|
|
|
|
|
|
|
|
|
|
| loans, at fair value |
|
527 |
|
|
(426) |
|
|
2,732 |
|
|
3,745 |
| Leasing related income |
|
1,032 |
|
|
1,556 |
|
|
3,921 |
|
|
6,324 |
| Consumer fintech loan credit enhancement(1) |
|
19,619 |
|
|
— |
|
|
19,619 |
|
|
— |
| Other non-interest income |
|
838 |
|
|
786 |
|
|
3,412 |
|
|
2,786 |
| Total non-interest income |
|
54,270 |
|
|
26,989 |
|
|
146,482 |
|
|
112,094 |
| Non-interest expense |
|
|
|
|
|
|
|
|
|
|
|
| Salaries and employee benefits |
|
33,633 |
|
|
27,628 |
|
|
131,597 |
|
|
121,055 |
| Data processing expense |
|
1,414 |
|
|
1,324 |
|
|
5,666 |
|
|
5,447 |
| Legal expense |
|
856 |
|
|
740 |
|
|
3,365 |
|
|
3,850 |
| FDIC insurance |
|
961 |
|
|
724 |
|
|
3,579 |
|
|
2,957 |
| Software |
|
4,226 |
|
|
4,368 |
|
|
17,913 |
|
|
17,349 |
| Other non-interest expense |
|
10,722 |
|
|
10,826 |
|
|
41,105 |
|
|
40,384 |
| Total non-interest expense |
|
51,812 |
|
|
45,610 |
|
|
203,225 |
|
|
191,042 |
| Income before income taxes |
|
76,388 |
|
|
59,224 |
|
|
292,156 |
|
|
256,774 |
| Income tax expense |
|
20,480 |
|
|
15,196 |
|
|
74,616 |
|
|
64,478 |
| Net income |
|
55,908 |
|
|
44,028 |
|
|
217,540 |
|
|
192,296 |
| |
|
|
|
|
|
|
|
|
|
|
|
| Net income per share - basic |
$ |
1.17 |
|
$ |
0.82 |
|
$ |
4.35 |
|
$ |
3.52 |
| |
|
|
|
|
|
|
|
|
|
|
|
| Net income per share - diluted |
$ |
1.15 |
|
$ |
0.81 |
|
$ |
4.29 |
|
$ |
3.49 |
| Weighted average shares - basic |
|
47,771,547 |
|
|
53,549,138 |
|
|
50,063,620 |
|
|
54,506,065 |
| Weighted average shares - diluted |
|
48,639,936 |
|
|
54,201,312 |
|
|
50,713,140 |
|
|
55,053,497 |
(1) Lending agreements related to
consumer fintech loans had certain provisions accounted for as freestanding credit enhancements which resulted in the company recording
a $19.6 million provision for credit losses and a correlated amount in non-interest income resulting in no impact to net income.
| Condensed consolidated balance sheets |
December 31, |
|
September 30, |
|
June 30, |
|
December 31, |
| |
2024 (unaudited) |
|
2024 (unaudited) |
|
2024 (unaudited) |
|
2023 |
| |
(Dollars in thousands, except share data) |
| Assets: |
|
|
|
|
|
|
|
|
|
|
|
| Cash and cash equivalents |
|
|
|
|
|
|
|
|
|
|
|
| Cash and due from banks |
$ |
6,064 |
|
$ |
8,660 |
|
$ |
5,741 |
|
$ |
4,820 |
| Interest earning deposits at Federal Reserve Bank |
|
564,059 |
|
|
47,105 |
|
|
399,853 |
|
|
1,033,270 |
| Total cash and cash equivalents |
|
570,123 |
|
|
55,765 |
|
|
405,594 |
|
|
1,038,090 |
| |
|
|
|
|
|
|
|
|
|
|
|
| Investment securities, available-for-sale, at fair value, net of $10.0 million allowance for credit loss effective December 31, 2023, and $0 at December 31, 2024 |
|
1,502,860 |
|
|
1,588,289 |
|
|
1,581,006 |
|
|
747,534 |
| Commercial loans, at fair value |
|
223,115 |
|
|
252,004 |
|
|
265,193 |
|
|
332,766 |
| Loans, net of deferred fees and costs |
|
6,113,628 |
|
|
5,906,616 |
|
|
5,605,727 |
|
|
5,361,139 |
| Allowance for credit losses |
|
(31,944) |
|
|
(31,004) |
|
|
(28,575) |
|
|
(27,378) |
| Loans, net |
|
6,081,684 |
|
|
5,875,612 |
|
|
5,577,152 |
|
|
5,333,761 |
| Federal Home Loan Bank, Atlantic Central Bankers Bank, and Federal Reserve Bank stock |
|
15,642 |
|
|
21,717 |
|
|
15,642 |
|
|
15,591 |
| Premises and equipment, net |
|
27,566 |
|
|
28,091 |
|
|
28,038 |
|
|
27,474 |
| Accrued interest receivable |
|
41,713 |
|
|
42,915 |
|
|
43,720 |
|
|
37,534 |
| Intangible assets, net |
|
1,254 |
|
|
1,353 |
|
|
1,452 |
|
|
1,651 |
| Other real estate owned |
|
62,025 |
|
|
61,739 |
|
|
57,861 |
|
|
16,949 |
| Deferred tax asset, net |
|
18,874 |
|
|
9,604 |
|
|
20,556 |
|
|
21,219 |
| Other assets |
|
182,687 |
|
|
157,501 |
|
|
149,187 |
|
|
133,126 |
| Total assets |
$ |
8,727,543 |
|
$ |
8,094,590 |
|
$ |
8,145,401 |
|
$ |
7,705,695 |
| |
|
|
|
|
|
|
|
|
|
|
|
| Liabilities: |
|
|
|
|
|
|
|
|
|
|
|
| Deposits |
|
|
|
|
|
|
|
|
|
|
|
| Demand and interest checking |
$ |
7,434,212 |
|
$ |
6,844,128 |
|
$ |
7,095,391 |
|
$ |
6,630,251 |
| Savings and money market |
|
311,834 |
|
|
81,624 |
|
|
60,297 |
|
|
50,659 |
| Total deposits |
|
7,746,046 |
|
|
6,925,752 |
|
|
7,155,688 |
|
|
6,680,910 |
| |
|
|
|
|
|
|
|
|
|
|
|
| Securities sold under agreements to repurchase |
|
— |
|
|
— |
|
|
— |
|
|
42 |
| Short-term borrowings |
|
— |
|
|
135,000 |
|
|
— |
|
|
— |
| Senior debt |
|
96,214 |
|
|
96,125 |
|
|
96,037 |
|
|
95,859 |
| Subordinated debenture |
|
13,401 |
|
|
13,401 |
|
|
13,401 |
|
|
13,401 |
| Other long-term borrowings |
|
14,081 |
|
|
38,157 |
|
|
38,283 |
|
|
38,561 |
| Other liabilities |
|
68,018 |
|
|
70,829 |
|
|
65,001 |
|
|
69,641 |
| Total liabilities |
$ |
7,937,760 |
|
$ |
7,279,264 |
|
$ |
7,368,410 |
|
$ |
6,898,414 |
| |
|
|
|
|
|
|
|
|
|
|
|
| Shareholders' equity: |
|
|
|
|
|
|
|
|
|
|
|
| Common stock - authorized, 75,000,000 shares of $1.00 par value; 47,713,481 and 53,202,630 shares issued and outstanding at December 31, 2024 and 2023, respectively |
|
47,713 |
|
|
48,231 |
|
|
49,268 |
|
|
53,203 |
| Treasury stock at cost, 402,731 shares at December 31, 2024 and 0 shares at December 31, 2023, respectively |
|
(22,681) |
|
|
— |
|
|
— |
|
|
— |
| Additional paid-in capital |
|
3,233 |
|
|
26,573 |
|
|
72,171 |
|
|
212,431 |
| Retained earnings |
|
779,155 |
|
|
723,247 |
|
|
671,730 |
|
|
561,615 |
| Accumulated other comprehensive (loss) income |
|
(17,637) |
|
|
17,275 |
|
|
(16,178) |
|
|
(19,968) |
| Total shareholders' equity |
|
789,783 |
|
|
815,326 |
|
|
776,991 |
|
|
807,281 |
| |
|
|
|
|
|
|
|
|
|
|
|
| Total liabilities and shareholders' equity |
$ |
8,727,543 |
|
$ |
8,094,590 |
|
$ |
8,145,401 |
|
$ |
7,705,695 |
| Average balance sheet and net interest income |
Three months ended December 31, 2024 |
|
Three months ended December 31, 2023 |
| |
(Dollars in thousands; unaudited) |
| |
Average |
|
|
|
Average |
|
Average |
|
|
|
Average |
| Assets: |
Balance |
|
Interest |
|
Rate |
|
Balance |
|
Interest |
|
Rate |
| |
|
|
|
|
|
|
|
|
|
|
|
|
|
|
|
|
| Interest earning assets: |
|
|
|
|
|
|
|
|
|
|
|
|
|
|
|
|
| Loans, net of deferred fees and costs(1) |
$ |
6,193,762 |
|
$ |
112,908 |
|
|
7.29% |
|
$ |
5,583,467 |
|
$ |
112,334 |
|
8.05% |
| Leases-bank qualified(2) |
|
5,728 |
|
|
143 |
|
|
9.99% |
|
|
4,658 |
|
|
109 |
|
9.36% |
| Investment securities-taxable |
|
1,556,698 |
|
|
19,341 |
|
|
4.97% |
|
|
747,384 |
|
|
10,258 |
|
5.49% |
| Investment securities-nontaxable(2) |
|
5,221 |
|
|
82 |
|
|
6.28% |
|
|
2,895 |
|
|
49 |
|
6.77% |
| Interest earning deposits at Federal Reserve Bank |
|
527,849 |
|
|
6,378 |
|
|
4.83% |
|
|
677,524 |
|
|
9,356 |
|
5.52% |
| Net interest earning assets |
|
8,289,258 |
|
|
138,852 |
|
|
6.70% |
|
|
7,015,928 |
|
|
132,106 |
|
7.53% |
| |
|
|
|
|
|
|
|
|
|
|
|
|
|
|
|
|
| Allowance for credit losses |
|
(30,829) |
|
|
|
|
|
|
|
|
(24,070) |
|
|
|
|
|
| Other assets |
|
291,977 |
|
|
|
|
|
|
|
|
356,785 |
|
|
|
|
|
| |
$ |
8,550,406 |
|
|
|
|
|
|
|
$ |
7,348,643 |
|
|
|
|
|
| |
|
|
|
|
|
|
|
|
|
|
|
|
|
|
|
|
| Liabilities and Shareholders' Equity: |
|
|
|
|
|
|
|
|
|
|
|
|
|
|
|
|
| Deposits: |
|
|
|
|
|
|
|
|
|
|
|
|
|
|
|
|
| Demand and interest checking |
$ |
7,443,308 |
|
$ |
41,436 |
|
|
2.23% |
|
$ |
6,204,048 |
|
$ |
37,830 |
|
2.44% |
| Savings and money market |
|
111,231 |
|
|
1,078 |
|
|
3.88% |
|
|
46,428 |
|
|
392 |
|
3.38% |
| Total deposits |
|
7,554,539 |
|
|
42,514 |
|
|
2.25% |
|
|
6,250,476 |
|
|
38,222 |
|
2.45% |
| |
|
|
|
|
|
|
|
|
|
|
|
|
|
|
|
|
| Short-term borrowings |
|
9,673 |
|
|
125 |
|
|
5.17% |
|
|
2,717 |
|
|
37 |
|
5.45% |
| Repurchase agreements |
|
— |
|
|
— |
|
|
— |
|
|
41 |
|
|
— |
|
— |
| Long-term borrowings |
|
25,886 |
|
|
360 |
|
|
5.56% |
|
|
10,144 |
|
|
125 |
|
4.94% |
| Subordinated debentures |
|
13,401 |
|
|
275 |
|
|
8.21% |
|
|
13,401 |
|
|
296 |
|
8.84% |
| Senior debt |
|
96,156 |
|
|
1,234 |
|
|
5.13% |
|
|
95,808 |
|
|
1,234 |
|
5.15% |
| Total deposits and liabilities |
|
7,699,655 |
|
|
44,508 |
|
|
2.31% |
|
|
6,372,587 |
|
|
39,914 |
|
2.51% |
| |
|
|
|
|
|
|
|
|
|
|
|
|
|
|
|
|
| Other liabilities |
|
48,196 |
|
|
|
|
|
|
|
|
185,572 |
|
|
|
|
|
| Total liabilities |
|
7,747,851 |
|
|
|
|
|
|
|
|
6,558,159 |
|
|
|
|
|
| |
|
|
|
|
|
|
|
|
|
|
|
|
|
|
|
|
| Shareholders' equity |
|
802,555 |
|
|
|
|
|
|
|
|
790,484 |
|
|
|
|
|
| |
$ |
8,550,406 |
|
|
|
|
|
|
|
$ |
7,348,643 |
|
|
|
|
|
| Net interest income on tax equivalent basis(2) |
|
|
|
$ |
94,344 |
|
|
|
|
|
|
|
$ |
92,192 |
|
|
| |
|
|
|
|
|
|
|
|
|
|
|
|
|
|
|
|
| Tax equivalent adjustment |
|
|
|
|
48 |
|
|
|
|
|
|
|
|
33 |
|
|
| |
|
|
|
|
|
|
|
|
|
|
|
|
|
|
|
|
| Net interest income |
|
|
|
$ |
94,296 |
|
|
|
|
|
|
|
$ |
92,159 |
|
|
| Net interest margin(2) |
|
|
|
|
|
|
|
4.55% |
|
|
|
|
|
|
|
5.26% |
| (1) Includes commercial loans, at fair value. All periods include non-accrual loans. |
| (2) Full taxable equivalent basis, using 21% respective statutory federal tax rates in 2024 and 2023. |
| Average balance sheet and net interest income |
Year ended December 31, 2024 |
|
Year ended December 31, 2023 |
| |
(Dollars in thousands; unaudited) |
| |
Average |
|
|
|
|
Average |
|
Average |
|
|
|
Average |
| Assets: |
Balance |
|
Interest |
|
|
Rate |
|
Balance |
|
Interest |
|
Rate |
| |
|
|
|
|
|
|
|
|
|
|
|
|
|
|
|
|
| Interest earning assets: |
|
|
|
|
|
|
|
|
|
|
|
|
|
|
|
|
| Loans, net of deferred fees and costs(1) |
$ |
5,920,643 |
|
$ |
458,405 |
|
|
7.74% |
|
$ |
5,724,679 |
|
$ |
436,343 |
|
7.62% |
| Leases-bank qualified(2) |
|
5,064 |
|
|
522 |
|
|
10.31% |
|
|
4,106 |
|
|
388 |
|
9.45% |
| Investment securities-taxable |
|
1,331,234 |
|
|
66,262 |
|
|
4.98% |
|
|
766,906 |
|
|
39,078 |
|
5.10% |
| Investment securities-nontaxable(2) |
|
3,487 |
|
|
237 |
|
|
6.80% |
|
|
3,118 |
|
|
193 |
|
6.19% |
| Interest earning deposits at Federal Reserve Bank |
|
497,180 |
|
|
26,326 |
|
|
5.30% |
|
|
649,873 |
|
|
33,627 |
|
5.17% |
| Net interest earning assets |
|
7,757,608 |
|
|
551,752 |
|
|
7.11% |
|
|
7,148,682 |
|
|
509,629 |
|
7.13% |
| |
|
|
|
|
|
|
|
|
|
|
|
|
|
|
|
|
| Allowance for credit losses |
|
(28,707) |
|
|
|
|
|
|
|
|
(23,412) |
|
|
|
|
|
| Other assets |
|
308,814 |
|
|
|
|
|
|
|
|
292,501 |
|
|
|
|
|
| |
$ |
8,037,715 |
|
|
|
|
|
|
|
$ |
7,417,771 |
|
|
|
|
|
| |
|
|
|
|
|
|
|
|
|
|
|
|
|
|
|
|
| Liabilities and Shareholders' Equity: |
|
|
|
|
|
|
|
|
|
|
|
|
|
|
|
|
| Deposits: |
|
|
|
|
|
|
|
|
|
|
|
|
|
|
|
|
| Demand and interest checking |
$ |
6,875,368 |
|
$ |
161,841 |
|
|
2.35% |
|
$ |
6,308,509 |
|
$ |
144,814 |
|
2.30% |
| Savings and money market |
|
71,962 |
|
|
2,531 |
|
|
3.52% |
|
|
78,074 |
|
|
2,857 |
|
3.66% |
| Time deposits |
|
— |
|
|
— |
|
|
— |
|
|
20,794 |
|
|
858 |
|
4.13% |
| Total deposits |
|
6,947,330 |
|
|
164,372 |
|
|
2.37% |
|
|
6,407,377 |
|
|
148,529 |
|
2.32% |
| |
|
|
|
|
|
|
|
|
|
|
|
|
|
|
|
|
| Short-term borrowings |
|
44,220 |
|
|
2,469 |
|
|
5.58% |
|
|
5,739 |
|
|
271 |
|
4.72% |
| Repurchase agreements |
|
3 |
|
|
— |
|
|
— |
|
|
41 |
|
|
— |
|
— |
| Long-term borrowings |
|
35,232 |
|
|
2,420 |
|
|
6.87% |
|
|
9,995 |
|
|
507 |
|
5.07% |
| Subordinated debentures |
|
13,401 |
|
|
1,155 |
|
|
8.62% |
|
|
13,401 |
|
|
1,121 |
|
8.37% |
| Senior debt |
|
96,027 |
|
|
4,935 |
|
|
5.14% |
|
|
96,864 |
|
|
5,027 |
|
5.19% |
| Total deposits and liabilities |
|
7,136,213 |
|
|
175,351 |
|
|
2.46% |
|
|
6,533,417 |
|
|
155,455 |
|
2.38% |
| |
|
|
|
|
|
|
|
|
|
|
|
|
|
|
|
|
| Other liabilities |
|
102,970 |
|
|
|
|
|
|
|
|
133,698 |
|
|
|
|
|
| Total liabilities |
|
7,239,183 |
|
|
|
|
|
|
|
|
6,667,115 |
|
|
|
|
|
| |
|
|
|
|
|
|
|
|
|
|
|
|
|
|
|
|
| Shareholders' equity |
|
798,532 |
|
|
|
|
|
|
|
|
750,656 |
|
|
|
|
|
| |
$ |
8,037,715 |
|
|
|
|
|
|
|
$ |
7,417,771 |
|
|
|
|
|
| Net interest income on tax equivalent basis(2) |
|
|
|
$ |
376,401 |
|
|
|
|
|
|
|
$ |
354,174 |
|
|
| |
|
|
|
|
|
|
|
|
|
|
|
|
|
|
|
|
| Tax equivalent adjustment |
|
|
|
|
160 |
|
|
|
|
|
|
|
|
122 |
|
|
| |
|
|
|
|
|
|
|
|
|
|
|
|
|
|
|
|
| Net interest income |
|
|
|
$ |
376,241 |
|
|
|
|
|
|
|
$ |
354,052 |
|
|
| Net interest margin(2) |
|
|
|
|
|
|
|
4.85% |
|
|
|
|
|
|
|
4.95% |
| (1) Includes commercial loans, at fair value. All periods include non-accrual loans. |
| (2) Full taxable equivalent basis, using 21% respective statutory federal tax rates in 2024 and 2023. |
| Allowance for credit losses |
Year ended |
| |
December 31, |
|
December 31, |
| |
2024 (unaudited) |
|
2023 |
| |
(Dollars in thousands) |
| |
|
|
|
|
|
| Balance in the allowance for credit losses at beginning of period |
$ |
27,378 |
|
$ |
22,374 |
| |
|
|
|
|
|
| Loans charged-off: |
|
|
|
|
|
| SBA non-real estate |
|
708 |
|
|
871 |
| SBA commercial mortgage |
|
— |
|
|
76 |
| Direct lease financing |
|
4,575 |
|
|
3,666 |
| IBLOC |
|
— |
|
|
24 |
| Consumer - home equity |
|
10 |
|
|
— |
| Consumer fintech(1) |
|
19,619 |
|
|
— |
| Other loans |
|
8 |
|
|
3 |
| Total |
|
24,920 |
|
|
4,640 |
| |
|
|
|
|
|
| Recoveries: |
|
|
|
|
|
| SBA non-real estate |
|
229 |
|
|
475 |
| SBA commercial mortgage |
|
— |
|
|
75 |
| Direct lease financing |
|
318 |
|
|
330 |
| Consumer - home equity |
|
1 |
|
|
299 |
| Total |
|
548 |
|
|
1,179 |
| Net charge-offs |
|
24,372 |
|
|
3,461 |
| Provision for credit losses on non-consumer fintech loans |
|
9,319 |
|
|
8,465 |
| Provision for credit losses on consumer fintech loans(1) |
|
19,619 |
|
|
— |
| |
|
|
|
|
|
| Balance in allowance for credit losses at end of period |
$ |
31,944 |
|
$ |
27,378 |
| Net charge-offs/average loans |
|
0.43% |
|
|
0.07% |
| Net charge-offs/average assets |
|
0.30% |
|
|
0.05% |
| |
|
|
|
|
|
| Excluding the $19,619 of consumer fintech loans: |
|
|
|
|
|
| Net charge-offs/average loans |
|
0.08% |
|
|
|
| Net charge-offs/average assets |
|
0.06% |
|
|
|
(1) Lending agreements related to
consumer fintech loans had certain provisions accounted for as freestanding credit enhancements which resulted in the company recording
a $19.6 million provision for credit losses and a correlated amount in non-interest income resulting in no impact to net income.
| Loan portfolio |
December 31, |
|
September 30, |
|
June 30, |
|
December 31, |
| |
2024 (unaudited) |
|
2024 (unaudited) |
|
2024 (unaudited) |
|
2023 |
| |
(Dollars in thousands) |
| |
|
|
|
|
|
|
|
|
|
|
|
| SBL non-real estate |
$ |
190,322 |
|
$ |
179,915 |
|
$ |
171,893 |
|
$ |
137,752 |
| SBL commercial mortgage |
|
662,091 |
|
|
665,608 |
|
|
647,894 |
|
|
606,986 |
| SBL construction |
|
34,685 |
|
|
30,158 |
|
|
30,881 |
|
|
22,627 |
| Small business loans |
|
887,098 |
|
|
875,681 |
|
|
850,668 |
|
|
767,365 |
| Direct lease financing |
|
700,553 |
|
|
711,836 |
|
|
711,403 |
|
|
685,657 |
| SBLOC / IBLOC(1) |
|
1,564,018 |
|
|
1,543,215 |
|
|
1,558,095 |
|
|
1,627,285 |
| Advisor financing(2) |
|
273,896 |
|
|
248,422 |
|
|
238,831 |
|
|
221,612 |
| Real estate bridge loans |
|
2,109,041 |
|
|
2,189,761 |
|
|
2,119,324 |
|
|
1,999,782 |
| Consumer fintech(3) |
|
454,357 |
|
|
280,092 |
|
|
70,081 |
|
|
— |
| Other loans(4) |
|
111,328 |
|
|
46,586 |
|
|
46,592 |
|
|
50,638 |
| |
|
6,100,291 |
|
|
5,895,593 |
|
|
5,594,994 |
|
|
5,352,339 |
| Unamortized loan fees and costs |
|
13,337 |
|
|
11,023 |
|
|
10,733 |
|
|
8,800 |
| Total loans, including unamortized fees and costs |
$ |
6,113,628 |
|
$ |
5,906,616 |
|
$ |
5,605,727 |
|
$ |
5,361,139 |
| Small business portfolio |
December 31, |
|
September 30, |
|
June 30, |
|
December 31, |
| |
2024 (unaudited) |
|
2024 (unaudited) |
|
2024 (unaudited) |
|
2023 |
| |
|
(Dollars in thousands) |
| |
|
|
|
|
|
|
|
|
|
|
|
| SBL, including unamortized fees and costs |
$ |
897,077 |
|
$ |
885,263 |
|
$ |
860,226 |
|
$ |
776,867 |
| SBL, included in loans, at fair value |
|
89,902 |
|
|
93,888 |
|
|
104,146 |
|
|
119,287 |
| Total small business loans(5) |
$ |
986,979 |
|
$ |
979,151 |
|
$ |
964,372 |
|
$ |
896,154 |
(1) SBLOC
loans are collateralized by marketable securities, while IBLOC are collateralized by the cash surrender value of insurance policies. At
December 31, 2024 and December 31, 2023, IBLOC loans amounted to $548.1 million and $646.9 million, respectively.
(2) In
2020 The Bancorp began originating loans to investment advisors for purposes of debt refinancing, acquisition of another firm or internal
succession. Maximum loan amounts are subject to loan-to-value ratios of 70% of the business enterprise value based on a third-party
valuation, but may be increased depending upon the debt service coverage ratio. Personal guarantees and blanket business liens are obtained
as appropriate.
(3) Consumer fintech loans consist of $201.1
million of secured credit card loans, with the balance comprised of other short-term extensions of credit.
(4) Includes
demand deposit overdrafts reclassified as loan balances totaling $1.2 million and $1.7 million at December 31, 2024 and December 31, 2023,
respectively. Estimated overdraft charge-offs and recoveries are reflected in the allowance for credit losses and are immaterial.
(5) The
SBLs held at fair value are comprised of the government guaranteed portion of 7(a) Program loans at the dates indicated.
Small business loans as of December 31, 2024
| |
|
Loan principal |
| |
|
(Dollars in millions) |
| U.S. government guaranteed portion of SBA loans(1) |
|
$ |
385 |
| PPP loans(1) |
|
|
1 |
| Commercial mortgage SBA(2) |
|
|
354 |
| Construction SBA(3) |
|
|
12 |
| Non-guaranteed portion of U.S. government guaranteed 7(a) Program loans(4) |
|
|
115 |
| Non-SBA SBLs |
|
|
100 |
| Other(5) |
|
|
9 |
| Total principal |
|
$ |
976 |
| Unamortized fees and costs |
|
|
11 |
| Total SBLs |
|
$ |
987 |
(1) Includes
the portion of SBA 7(a) Program loans and PPP loans which have been guaranteed by the U.S. government, and therefore are assumed to have
no credit risk.
(2) Substantially
all these loans are made under the 504 Program, which dictates origination date LTV percentages, generally 50%-60%, to which The Bancorp
adheres.
(3) Includes
$11 million in 504 Program first mortgages with an origination date LTV of 50%-60%, and $1 million in SBA interim loans with an approved
SBA post-construction full takeout/payoff.
(4) Includes
the unguaranteed portion of 7(a) Program loans which are 70% or more guaranteed by the U.S. government. SBA 7(a) Program loans are not
made on the basis of real estate LTV; however, they are subject to SBA's "All Available Collateral" rule which mandates that
to the extent a borrower or its 20% or greater principals have available collateral (including personal residences), the collateral must
be pledged to fully collateralize the loan, after applying SBA-determined liquidation rates. In addition, all 7(a) Program loans and 504
Program loans require the personal guaranty of all 20% or greater owners.
(5) Comprised of $9 million of loans sold that do not qualify
for true sale accounting.
Small business loans by type as of December 31, 2024
(Excludes government guaranteed portion of SBA 7(a) Program and PPP loans)
| |
|
SBL commercial mortgage(1) |
|
SBL construction(1) |
|
SBL non-real estate |
|
Total |
|
|
% Total |
| |
|
(Dollars in millions) |
| Hotels (except casino hotels) and motels |
|
$ |
87 |
|
$ |
— |
|
$ |
— |
|
$ |
87 |
|
|
15% |
| Funeral homes and funeral services |
|
|
36 |
|
|
— |
|
|
34 |
|
|
70 |
|
|
12% |
| Full-service restaurants |
|
|
29 |
|
|
2 |
|
|
2 |
|
|
33 |
|
|
6% |
| Child day care services |
|
|
23 |
|
|
1 |
|
|
1 |
|
|
25 |
|
|
4% |
| Car washes |
|
|
12 |
|
|
5 |
|
|
— |
|
|
17 |
|
|
3% |
| Homes for the elderly |
|
|
16 |
|
|
— |
|
|
— |
|
|
16 |
|
|
3% |
| Outpatient mental health and substance abuse centers |
|
|
15 |
|
|
— |
|
|
— |
|
|
15 |
|
|
3% |
| Gasoline stations with convenience stores |
|
|
15 |
|
|
— |
|
|
— |
|
|
15 |
|
|
3% |
| General line grocery merchant wholesalers |
|
|
13 |
|
|
— |
|
|
— |
|
|
13 |
|
|
2% |
| Fitness and recreational sports centers |
|
|
8 |
|
|
— |
|
|
2 |
|
|
10 |
|
|
2% |
| Nursing care facilities |
|
|
9 |
|
|
— |
|
|
— |
|
|
9 |
|
|
2% |
| Lawyer's office |
|
|
9 |
|
|
— |
|
|
— |
|
|
9 |
|
|
2% |
| Plumbing, heating, and air-conditioning contractors |
|
|
8 |
|
|
— |
|
|
1 |
|
|
9 |
|
|
2% |
| Used car dealers |
|
|
7 |
|
|
— |
|
|
— |
|
|
7 |
|
|
1% |
| All other specialty trade contractors |
|
|
6 |
|
|
— |
|
|
1 |
|
|
7 |
|
|
1% |
| Caterers |
|
|
7 |
|
|
— |
|
|
— |
|
|
7 |
|
|
1% |
| Limited-service restaurants |
|
|
4 |
|
|
— |
|
|
3 |
|
|
7 |
|
|
1% |
| General warehousing and storage |
|
|
6 |
|
|
— |
|
|
— |
|
|
6 |
|
|
1% |
| Automotive body, paint, and interior repair |
|
|
5 |
|
|
— |
|
|
— |
|
|
5 |
|
|
1% |
| Appliance repair and maintenance |
|
|
6 |
|
|
— |
|
|
— |
|
|
6 |
|
|
1% |
| Other accounting services |
|
|
5 |
|
|
— |
|
|
— |
|
|
5 |
|
|
1% |
| Offices of dentists |
|
|
5 |
|
|
— |
|
|
— |
|
|
5 |
|
|
1% |
| Other miscellaneous durable goods merchant |
|
|
5 |
|
|
— |
|
|
— |
|
|
5 |
|
|
1% |
| Packaged frozen food merchant wholesalers |
|
|
5 |
|
|
— |
|
|
— |
|
|
5 |
|
|
1% |
| Other(2) |
|
|
147 |
|
|
12 |
|
|
29 |
|
|
188 |
|
|
30% |
| Total |
|
$ |
488 |
|
$ |
20 |
|
$ |
73 |
|
$ |
581 |
|
|
100% |
(1) Of the SBL
commercial mortgage and SBL construction loans, $141 million represents the total of the non-guaranteed portion of SBA 7(a) Program loans
and non-SBA loans. The balance of those categories represents SBA 504 Program loans with 50%-60% origination date LTVs. SBL Commercial
excludes $9 million of loans sold that do not qualify for true sale accounting.
(2) Loan
types of less than $5 million are spread over approximately one hundred different business types.
State diversification as of December 31, 2024
(Excludes government guaranteed portion of SBA 7(a) Program loans and PPP
loans)
| |
|
SBL commercial mortgage(1) |
|
SBL construction(1) |
|
SBL non-real estate |
|
Total |
|
|
% Total |
| |
|
|
(Dollars in millions) |
| California |
|
$ |
131 |
|
$ |
3 |
|
$ |
6 |
|
$ |
140 |
|
|
24% |
| Florida |
|
|
77 |
|
|
8 |
|
|
4 |
|
|
89 |
|
|
15% |
| North Carolina |
|
|
44 |
|
|
— |
|
|
4 |
|
|
48 |
|
|
8% |
| New York |
|
|
34 |
|
|
— |
|
|
2 |
|
|
36 |
|
|
6% |
| Pennsylvania |
|
|
19 |
|
|
— |
|
|
13 |
|
|
32 |
|
|
6% |
| Texas |
|
|
23 |
|
|
3 |
|
|
6 |
|
|
32 |
|
|
6% |
| New Jersey |
|
|
23 |
|
|
— |
|
|
7 |
|
|
30 |
|
|
5% |
| Georgia |
|
|
25 |
|
|
2 |
|
|
1 |
|
|
28 |
|
|
5% |
| Other States |
|
|
112 |
|
|
4 |
|
|
30 |
|
|
146 |
|
|
25% |
| Total |
|
$ |
488 |
|
$ |
20 |
|
$ |
73 |
|
$ |
581 |
|
|
100% |
(1) Of the SBL commercial
mortgage and SBL construction loans, $141 million represents the total of the non-guaranteed
portion of SBA 7(a) Program loans and non-SBA loans. The balance of those categories represents SBA 504 Program loans with 50%-60% origination
date LTVs. SBL Commercial excludes $9 million of loans that do not qualify for true sale accounting.
Top 10 loans as of December 31, 2024
| Type(1) |
|
State |
|
SBL commercial mortgage |
|
| |
|
(Dollars in millions) |
| General line grocery merchant wholesalers |
|
|
CA |
|
$ |
13 |
|
| Funeral homes and funeral services |
|
|
ME |
|
|
13 |
|
| Funeral homes and funeral services |
|
|
PA |
|
|
12 |
|
| Outpatient mental health and substance abuse center |
|
|
FL |
|
|
10 |
|
| Hotel |
|
|
FL |
|
|
8 |
|
| Lawyer's office |
|
|
CA |
|
|
8 |
|
| Hotel |
|
|
VA |
|
|
7 |
|
| Hotel |
|
|
NC |
|
|
7 |
|
| Used car dealer |
|
|
CA |
|
|
7 |
|
| General warehousing and storage |
|
|
PA |
|
|
6 |
|
| Total |
|
|
|
|
$ |
91 |
|
(1) The table above does
not include loans to the extent that they are U.S. government guaranteed.
Commercial real estate loans, excluding SBA loans, are as follows including
LTV at origination:
Type as of December 31, 2024
| Type |
|
|
# Loans |
|
|
Balance |
|
Weighted average origination date LTV |
|
Weighted average interest rate |
| |
|
|
(Dollars in millions) |
| Real estate bridge loans (multifamily apartment loans recorded at amortized cost)(1) |
|
|
169 |
|
$ |
2,109 |
|
70% |
|
8.73% |
| |
|
|
|
|
|
|
|
|
|
|
| Non-SBA commercial real estate loans, at fair value: |
|
|
|
|
|
|
|
|
|
|
| Multifamily (apartment bridge loans)(1) |
|
|
5 |
|
$ |
94 |
|
70% |
|
7.61% |
| Hospitality (hotels and lodging) |
|
|
1 |
|
|
19 |
|
66% |
|
9.75% |
| Retail |
|
|
2 |
|
|
12 |
|
72% |
|
8.19% |
| Other |
|
|
2 |
|
|
9 |
|
71% |
|
4.96% |
| |
|
|
10 |
|
|
134 |
|
70% |
|
7.79% |
| Fair value adjustment |
|
|
|
|
|
(1) |
|
|
|
|
| Total non-SBA commercial real estate loans, at fair value |
|
|
|
|
|
133 |
|
|
|
|
| Total commercial real estate loans |
|
|
|
|
$ |
2,242 |
|
70% |
|
8.67% |
(1) In the third quarter
of 2021, we resumed the origination of bridge loans for multi-family apartment rehabilitation which comprise these categories. Such loans
held at fair value were originally intended for sale, but are now being retained on the balance sheet. In addition to “as is”
origination date appraisals, on which the weighted average origination date LTVs are based, third-party appraisers also estimated “as
stabilized” values, which represents additional potential collateral value as rehabilitation progresses, and units are re-leased
at stabilized rental rates. The weighted average origination date “as stabilized” LTV was estimated at 61%.
| State diversification as of December 31, 2024 |
|
|
15 largest loans as of December 31, 2024 |
| State |
|
Balance |
|
|
Origination date LTV |
|
|
State |
|
|
Balance |
|
Origination date LTV |
| (Dollars in millions) |
|
|
(Dollars in millions) |
| Texas |
|
$ |
693 |
|
|
71% |
|
|
Texas |
|
|
$ |
46 |
|
75% |
| Georgia |
|
|
276 |
|
|
70% |
|
|
Tennessee |
|
|
|
40 |
|
72% |
| Florida |
|
|
236 |
|
|
68% |
|
|
Michigan |
|
|
|
38 |
|
62% |
| Indiana |
|
|
128 |
|
|
71% |
|
|
Texas |
|
|
|
37 |
|
64% |
| New Jersey |
|
|
121 |
|
|
69% |
|
|
Texas |
|
|
|
36 |
|
67% |
| Michigan |
|
|
104 |
|
|
65% |
|
|
Florida |
|
|
|
35 |
|
72% |
| Ohio |
|
|
85 |
|
|
70% |
|
|
New Jersey |
|
|
|
34 |
|
62% |
| Other States each <$65 million |
|
|
599 |
|
|
70% |
|
|
Pennsylvania |
|
|
|
34 |
|
63% |
| Total |
|
$ |
2,242 |
|
|
70% |
|
|
Indiana |
|
|
|
34 |
|
76% |
| |
|
|
|
|
|
|
|
|
Texas |
|
|
|
33 |
|
62% |
| |
|
|
|
|
|
|
|
|
Oklahoma |
|
|
|
31 |
|
78% |
| |
|
|
|
|
|
|
|
|
Texas |
|
|
|
31 |
|
77% |
| |
|
|
|
|
|
|
|
|
New Jersey |
|
|
|
31 |
|
71% |
| |
|
|
|
|
|
|
|
|
Michigan |
|
|
|
31 |
|
66% |
| |
|
|
|
|
|
|
|
|
Georgia |
|
|
|
29 |
|
69% |
| |
|
|
|
|
|
|
|
|
15 largest commercial real estate loans |
|
|
$ |
520 |
|
69% |
Institutional banking loans outstanding at December 31, 2024
| Type |
Principal |
|
% of total |
| |
|
(Dollars in millions) |
|
|
| SBLOC |
$ |
1,016 |
|
55% |
| IBLOC |
|
548 |
|
30% |
| Advisor financing |
|
274 |
|
15% |
| Total |
$ |
1,838 |
|
100% |
For SBLOC, we generally lend up to 50% of the value of equities and 80%
for investment grade securities. While the value of equities has fallen in excess of 30% in recent years, the reduction in collateral
value of brokerage accounts collateralizing SBLOC loans generally has been less, for two reasons. First, many collateral accounts are
“balanced” and accordingly have a component of debt securities, which have either not decreased in value as much as equities,
or in some cases may have increased in value. Second, many of these accounts have the benefit of professional investment advisors who
provided some protection against market downturns, through diversification and other means. Additionally, borrowers often utilize only
a portion of collateral value, which lowers the percentage of principal to collateral.
Top 10 SBLOC loans at December 31, 2024
| |
Principal amount |
|
% Principal to collateral |
| |
(Dollars in millions) |
| |
$ |
10 |
|
36% |
| |
|
9 |
|
53% |
| |
|
9 |
|
15% |
| |
|
8 |
|
86% |
| |
|
8 |
|
46% |
| |
|
7 |
|
21% |
| |
|
7 |
|
32% |
| |
|
6 |
|
21% |
| |
|
6 |
|
37% |
| |
|
6 |
|
42% |
| Total and weighted average |
$ |
76 |
|
39% |
Insurance backed lines of credit (IBLOC)
IBLOC loans are backed by the cash value of eligible life insurance policies
which have been assigned to us. We generally lend up to 95% of such cash value. Our underwriting standards require approval of the
insurance companies which carry the policies backing these loans. Currently, fifteen insurance companies have been approved and, as of
January 15, 2025, all were rated A- (Excellent) or better by AM BEST.
Direct lease financing by type as of December 31, 2024
| |
|
Principal balance(1) |
|
% Total |
| |
|
(Dollars in millions) |
|
|
| Government agencies and public institutions(2) |
$ |
133 |
|
19% |
| Construction |
|
118 |
|
17% |
| Waste management and remediation services |
|
97 |
|
14% |
| Real estate and rental and leasing |
|
87 |
|
12% |
| Health care and social assistance |
|
29 |
|
4% |
| Professional, scientific, and technical services |
|
22 |
|
3% |
| Other services (except public administration) |
|
21 |
|
3% |
| Wholesale trade |
|
20 |
|
3% |
| General freight trucking |
|
19 |
|
3% |
| Finance and insurance |
|
14 |
|
2% |
| Transit and other transportation |
|
13 |
|
2% |
| Mining, quarrying, and oil and gas extraction |
|
9 |
|
1% |
| Other |
|
119 |
|
17% |
| Total |
$ |
701 |
|
100% |
(1) Of
the total $701 million of direct lease financing, $640 million consisted of vehicle leases with the remaining balance consisting of equipment
leases.
(2) Includes
public universities as well as school districts.
Direct lease financing by state as of December 31, 2024
| State |
|
Principal balance |
|
% Total |
| |
|
(Dollars in millions) |
|
|
| Florida |
$ |
109 |
|
16% |
| New York |
|
65 |
|
9% |
| Utah |
|
52 |
|
7% |
| Connecticut |
|
48 |
|
7% |
| California |
|
46 |
|
7% |
| Pennsylvania |
|
43 |
|
6% |
| New Jersey |
|
38 |
|
5% |
| North Carolina |
|
37 |
|
5% |
| Maryland |
|
37 |
|
5% |
| Texas |
|
25 |
|
4% |
| Idaho |
|
20 |
|
3% |
| Washington |
|
15 |
|
2% |
| Ohio |
|
14 |
|
2% |
| Georgia |
|
14 |
|
2% |
| Alabama |
|
13 |
|
2% |
| Other States |
|
125 |
|
18% |
| Total |
$ |
701 |
|
100% |
| Capital ratios |
Tier 1 capital |
|
Tier 1 capital |
|
Total capital |
|
Common equity |
| |
to average
assets ratio |
|
to risk-weighted assets ratio |
|
to risk-weighted assets ratio |
|
tier 1 to risk weighted assets |
| As of December 31, 2024 |
|
|
|
|
|
|
|
| The Bancorp, Inc. |
9.41% |
|
13.88% |
|
14.46% |
|
13.88% |
| The Bancorp Bank, National Association |
10.38% |
|
15.29% |
|
15.87% |
|
15.29% |
| "Well capitalized" institution (under federal regulations-Basel III) |
5.00% |
|
8.00% |
|
10.00% |
|
6.50% |
| |
|
|
|
|
|
|
|
| As of December 31, 2023 |
|
|
|
|
|
|
|
| The Bancorp, Inc. |
11.19% |
|
15.66% |
|
16.23% |
|
15.66% |
| The Bancorp Bank, National Association |
12.37% |
|
17.35% |
|
17.92% |
|
17.35% |
| "Well capitalized" institution (under federal regulations-Basel III) |
5.00% |
|
8.00% |
|
10.00% |
|
6.50% |
| |
Three months ended |
|
Year ended |
| |
December 31, |
|
December 31, |
| |
2024 |
|
2023 |
|
2024 |
|
2023 |
| Selected operating ratios |
|
|
|
|
|
|
|
|
|
|
|
| Return on average assets(1) |
|
2.60% |
|
|
2.38% |
|
|
2.71% |
|
|
2.59% |
| Return on average equity(1) |
|
27.71% |
|
|
22.10% |
|
|
27.24% |
|
|
25.62% |
| Net interest margin |
|
4.55% |
|
|
5.26% |
|
|
4.85% |
|
|
4.95% |
(1) Annualized
| Book value per share table |
December 31, |
|
September 30, |
|
|
June 30, |
|
December 31, |
| |
2024 |
|
2024 |
|
2024 |
|
2023 |
| Book value per share |
$ |
16.55 |
|
$ |
16.90 |
|
$ |
15.77 |
|
$ |
15.17 |
| Loan delinquency and other real estate owned |
December 31, 2024 |
| |
30-59 days past due |
|
60-89 days past due |
|
90+ days still accruing |
|
Non-accrual |
|
Total past due |
|
Current |
|
Total loans |
| SBL non-real estate |
$ |
229 |
|
$ |
— |
|
$ |
871 |
|
$ |
2,635 |
|
$ |
3,735 |
|
$ |
186,587 |
|
$ |
190,322 |
| SBL commercial mortgage |
|
— |
|
|
— |
|
|
336 |
|
|
4,885 |
|
|
5,221 |
|
|
656,870 |
|
|
662,091 |
| SBL construction |
|
— |
|
|
— |
|
|
— |
|
|
1,585 |
|
|
1,585 |
|
|
33,100 |
|
|
34,685 |
| Direct lease financing |
|
7,069 |
|
|
1,923 |
|
|
1,088 |
|
|
6,026 |
|
|
16,106 |
|
|
684,447 |
|
|
700,553 |
| SBLOC / IBLOC |
|
20,991 |
|
|
1,808 |
|
|
3,322 |
|
|
503 |
|
|
26,624 |
|
|
1,537,394 |
|
|
1,564,018 |
| Advisor financing |
|
— |
|
|
— |
|
|
— |
|
|
— |
|
|
— |
|
|
273,896 |
|
|
273,896 |
| Real estate bridge loans(1) |
|
— |
|
|
— |
|
|
— |
|
|
12,300 |
|
|
12,300 |
|
|
2,096,741 |
|
|
2,109,041 |
| Consumer fintech |
|
13,419 |
|
|
681 |
|
|
213 |
|
|
— |
|
|
14,313 |
|
|
440,044 |
|
|
454,357 |
| Other loans |
|
49 |
|
|
— |
|
|
— |
|
|
— |
|
|
49 |
|
|
111,279 |
|
|
111,328 |
| Unamortized loan fees and costs |
|
— |
|
|
— |
|
|
— |
|
|
— |
|
|
— |
|
|
13,337 |
|
|
13,337 |
| |
$ |
41,757 |
|
$ |
4,412 |
|
$ |
5,830 |
|
$ |
27,934 |
|
$ |
79,933 |
|
$ |
6,033,695 |
|
$ |
6,113,628 |
(1) The $12.3 million shown in the non-accrual column for real
estate bridge loans was repaid without loss of principal in the first quarter of 2025. The table above does not include an $11.2 million
loan accounted for at fair value, and, as such, not reflected in delinquency tables. In the third quarter of 2024, the borrower notified
the Company that he would no longer be making payments on the loan, which is collateralized by a vacant retail property. Based upon a
July 2024 appraisal, the “as is” LTV is 84% and the “as stabilized” LTV is 62%. Since 2021, real estate bridge
lending originations have consisted of apartment buildings, while this loan was originated previously. In January 2025, two loans totaling
$9.8 million were transferred to non-accrual and were accordingly classified as substandard.
Other loan information
Of the $84.4 million special mention and $134.4 million substandard loans
at December 31, 2024, $13.2 million was modified in the fourth quarter of 2024 and received a reduction in interest rate and a combination
of full and partial payment deferrals. Not included in that modification total were $27.6 million of balances which we recapitalized with
a new borrower, who negotiated payment deferrals and rate reductions. The “as is” and “as stabilized” LTVs for
the $13.2 million balance were 80% and 69%, respectively, while weighted average LTVs for the $27.6 million were 79% and 70%, respectively.
These LTVs are based upon appraisals performed within the past twelve months.
Other real estate owned year to date activity
| |
December 31, 2024 |
| Beginning balance |
$ |
16,949 |
| Transfer from loans, net |
|
42,120 |
| Transfer from commercial loans, at fair value |
|
2,863 |
| Sales |
|
(1,602) |
| Advances |
|
1,695 |
| Ending balance |
$ |
62,025 |
| |
|
December 31, |
|
|
September 30, |
|
|
June 30, |
|
|
December 31, |
| |
|
2024 |
|
|
2024 |
|
|
2024 |
|
|
2023 |
| |
|
(Dollars in thousands) |
| Asset quality ratios: |
|
|
|
|
|
|
|
|
|
|
|
| Nonperforming loans to total loans(1) |
|
0.55% |
|
|
0.52% |
|
|
0.34% |
|
|
0.25% |
| Nonperforming assets to total assets(1) |
|
1.10% |
|
|
1.14% |
|
|
0.95% |
|
|
0.39% |
| Allowance for credit losses to total loans |
|
0.52% |
|
|
0.52% |
|
|
0.51% |
|
|
0.51% |
(1) In the first quarter of 2024, a $39.4 million apartment
building rehabilitation bridge loan with a December 31, 2024 balance of $41.1 million was transferred to nonaccrual status. On April 2,
2024, the same loan was transferred from nonaccrual status to other real estate owned. We intend to complete the improvements, which have
already begun, on the underlying apartment building. During the time that improvements are being completed, the Company intends to have
a property manager lease improved units as they become available, prior to the sale of the property. The $41.1 million loan balance compares
to a September 2023 third-party “as is” appraisal of $47.8 million, or an 83% “as is” LTV, after considering the
$1.6 million of earnest money deposits in connections with the property’s sale in process. Additional potential collateral value
may further increase as construction progresses, and units are re-leased at stabilized rental rates. Please see “Recent Developments”
which summarizes the agreement of sale for this property.
| Gross dollar volume (GDV)(1) |
Three months ended |
| |
December 31, |
|
September 30, |
|
June 30, |
|
December 31, |
| |
2024 |
|
2024 |
|
2024 |
|
2023 |
| |
|
(Dollars in thousands) |
| Prepaid and debit card GDV |
$ |
39,656,909 |
|
$ |
37,898,006 |
|
$ |
37,139,200 |
|
$ |
33,292,350 |
| |
|
|
|
|
|
|
|
|
|
|
|
(1) Gross dollar volume represents the total dollar amount spent
on prepaid and debit cards issued by The Bancorp Bank, N.A.
| Business line quarterly summary: |
| Quarter ended December 31, 2024 |
| (Dollars in millions) |
| |
|
|
|
Balances |
|
|
|
|
| |
|
|
|
|
|
% Growth |
|
|
|
|
| Major business lines |
|
Average approximate rates(1) |
|
Balances(2) |
|
Year over Year |
|
Linked quarter annualized |
|
|
|
|
| Loans |
|
|
|
|
|
|
|
|
|
|
|
|
| Institutional banking(3) |
|
6.5% |
|
$ 1,838 |
|
(1%) |
|
10% |
|
|
|
|
| Small business lending(4) |
|
7.5% |
|
987 |
|
12% |
|
11% |
|
|
|
|
| Leasing |
|
8.1% |
|
701 |
|
2% |
|
(6%) |
|
|
|
|
| Commercial real estate (non-SBA loans, at fair value) |
|
7.8% |
|
133 |
|
nm |
|
nm |
|
|
|
|
| Real estate bridge loans (recorded at book value) |
|
8.7% |
|
2,109 |
|
5% |
|
(15%) |
|
|
|
|
| Consumer fintech loans - interest bearing |
|
5.3% |
|
19 |
|
nm |
|
nm |
|
|
|
|
| Consumer fintech loans - non-interest bearing(5) |
|
— |
|
435 |
|
nm |
|
nm |
|
|
|
|
| Weighted average yield |
|
7.2% |
|
$ 6,222 |
|
|
|
|
|
Non-interest income |
| |
|
|
|
|
|
|
|
|
|
|
|
% Growth |
| Deposits: Fintech solutions group |
|
|
|
|
|
|
|
|
|
Current quarter |
|
Year over Year |
| Prepaid and debit card issuance, consumer fintech loan fees, and other payments |
|
2.2% |
|
$ 6,985 |
|
16% |
|
nm |
|
$ 32.3 |
|
29% |
(1) Average rates are for the three months ended December 31,
2024.
(2) Loan and deposit categories are based on period-end and
average quarterly balances, respectively.
(3) Institutional Banking loans are comprised of SBLOC loans
collateralized by marketable securities, IBLOC loans collateralized by the cash surrender value of eligible life insurance policies, and
investment advisor financing.
(4) Small Business Lending is substantially comprised of SBA-guaranteed
loans. Growth rates exclude the impact of $9 million of loans that do not qualify for true sale accounting at December 31, 2024 compared
to $29 million at the prior year and prior quarter end.
(5) Income related to non-interest-bearing balances is included
in non-interest income.
Summary of credit lines available
The Bancorp maintains lines of credit exceeding potential liquidity requirements
as follows. The Bancorp also has access to other substantial sources of liquidity.
| |
December 31, 2024 |
| |
|
(Dollars in thousands) |
| Federal Reserve Bank |
$ |
1,987,218 |
| Federal Home Loan Bank |
|
1,015,541 |
| Total lines of credit available |
$ |
3,002,759 |
Estimated insured vs uninsured deposits
The vast majority of The Bancorp’s deposits are insured and low balance
and accordingly do not constitute the liquidity risk experienced by certain institutions. Accordingly, the deposit base is comprised as
follows.
| |
December 31, 2024 |
| Insured |
|
94% |
| Low balance accounts |
|
3% |
| Other uninsured |
|
3% |
| Total deposits |
|
100% |
Calculation of efficiency ratio (non-GAAP)(1)
| |
Three months ended |
|
Year ended |
| |
December 31, |
|
December 31, |
|
December 31, |
|
December 31, |
| |
2024 |
|
2023 |
|
2024 |
|
2023 |
| |
(Dollars in thousands) |
| Net interest income |
$ |
94,296 |
|
$ |
92,159 |
|
$ |
376,241 |
|
$ |
354,052 |
| Non-interest income(2) |
|
34,651 |
|
|
26,989 |
|
|
126,863 |
|
|
112,094 |
| Total revenue |
$ |
128,947 |
|
$ |
119,148 |
|
$ |
503,104 |
|
$ |
466,146 |
| Non-interest expense |
$ |
51,812 |
|
$ |
45,610 |
|
$ |
203,225 |
|
$ |
191,042 |
| |
|
|
|
|
|
|
|
|
|
|
|
| Efficiency ratio |
|
40% |
|
|
38% |
|
|
40% |
|
|
41% |
| |
|
|
|
|
|
|
|
|
|
|
|
| (1) The efficiency ratio is calculated by dividing GAAP total non-interest expense by the total of GAAP net interest income and non-interest income. This ratio compares revenues generated with the amount of expense required to generate such revenues and may be used as one measure of overall efficiency. |
|
(2) Excludes $19.6 million in 2024.
Lending agreements related to consumer fintech loans had certain provisions accounted for as freestanding credit enhancements which resulted
in the company recording a $19.6 million provision for credit losses and a correlated amount in non-interest income resulting in no impact
to net income.
|
Exhibit 99.2

THE BANCORP INVESTOR PRESENTATION JANUARY 2025
2 DISCLOSURES Statements in this presentation regarding The Bancorp, Inc.’s (“The Bancorp”) business , that are not historical facts, are “forward - looking statements.” These statements may be identified by the use of forward - looking terminology, including the words “intend,” “may,” “believe,” “will,” “expect,” “look,” “anticipate,” “plan,” “estimate,” “continue,” or similar words. Forward - looking statements include but are not limited to, statements regarding our annual fiscal 2024 results, profitability, and increased volumes, and relate to our current assumptions, projections, and expectations about our business and future events, including current expectations about important economic, political, and technological factors, among other factors, and are subject to risks and uncertainties, which could cause the actual results, events, or achievements to differ materially from those set forth in or implied by the forward - looking statements and related assumptions. Factors that could cause results to differ from those expressed in the forward - looking statements also include, but are not limited to, the risks and uncertainties referenced or described in The Bancorp’s filings with the Securities and Exchange Commission, including the “Risk Factors” and “Management’s Discussion and Analysis of Financial Condition and Results of Operations” sections of the Company’s Annual Report on Form 10 - K for the fiscal year ended December 31, 2023 and other documents that the Company files from time to time with the Securities and Exchange Commission. The Bancorp does not undertake any duty to publicly revise or update forward - looking statements in this presentation to reflect events or circumstances that arise after the date of this presentation, except as may be required under applicable law. This presentation contains information regarding financial results that is calculated and presented on the basis of methodologies other than in accordance with accounting principles generally accepted in the United States (“GAAP”), such as those identified in the Appendix. As a result, such information may not conform to SEC Regulations, including Regulation S - X, and may be adjusted and presented differently in filings with the SEC. Any non - GAAP financial measures used in this presentation are in addition to, and should not be considered superior to, or a substitute for, financial statements prepared in accordance with GAAP. Non - GAAP financial measures are subject to significant inherent limitations. The non - GAAP measures presented herein may not be comparable to similar non - GAAP measures presented by other companies. This presentation includes market, industry and economic data which was obtained from various publicly available sources and other sources believed by the Company to be true. Although the Company believes it to be reliable, the Company has not independently verified any of the data from third party sources referred to in this presentation or analyzed or verified the underlying reports relied upon or referred to by such sources, or ascertained the underlying economic and other assumptions relied upon by such sources. The Company believes that its market, industry, and economic data is accurate and that its estimates and assumptions are reasonable, but there can be no assurance as to the accuracy or completeness thereof. Past performance is not indicative nor a guarantee of future results. Copies of the documents filed by The Bancorp with the SEC are available free of charge from the website of the SEC at www.sec.gov as well as on The Bancorp’s website at www.thebancorp.com . FORWARD LOOKING STATEMENTS & OTHER DISCLOSURES
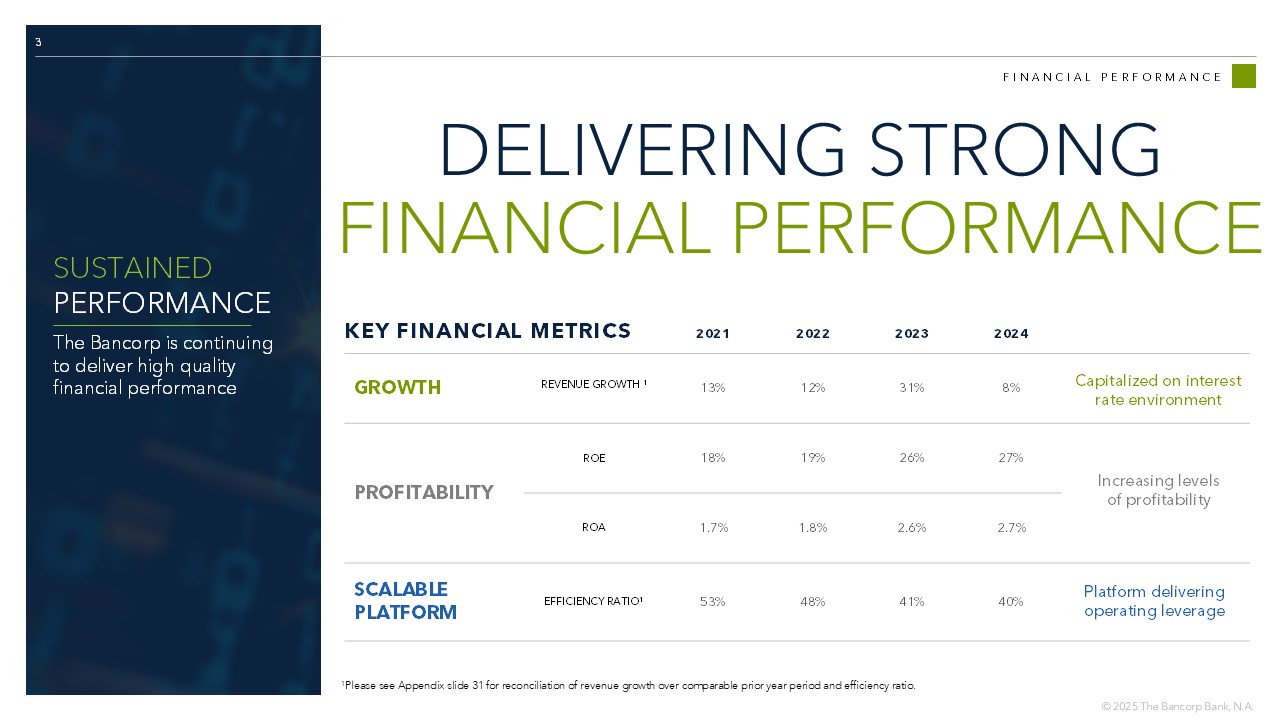
3 FINANCIAL PERFORMANCE DELIVERING STRONG FINANCIAL PERFORMANCE 2024 2023 2022 2021 8% 31% 12% 13% REVENUE GROWTH 1 GROWTH 27% 26% 19% 18% ROE PROFITABILITY 2.7% 2.6% 1.8% 1.7% ROA 40% 41% 48% 53% EFFICIENCY RATIO 1 SCALABLE PLATFORM KEY FINANCIAL METRICS 1 Please see Appendix slide 31 for reconciliation of revenue growth over comparable prior year period and efficiency ratio. Increasing levels of profitability Platform delivering operating leverage Capitalized on interest rate environment SUSTAINED PERFORMANCE The Bancorp is continuing to deliver high quality financial performance
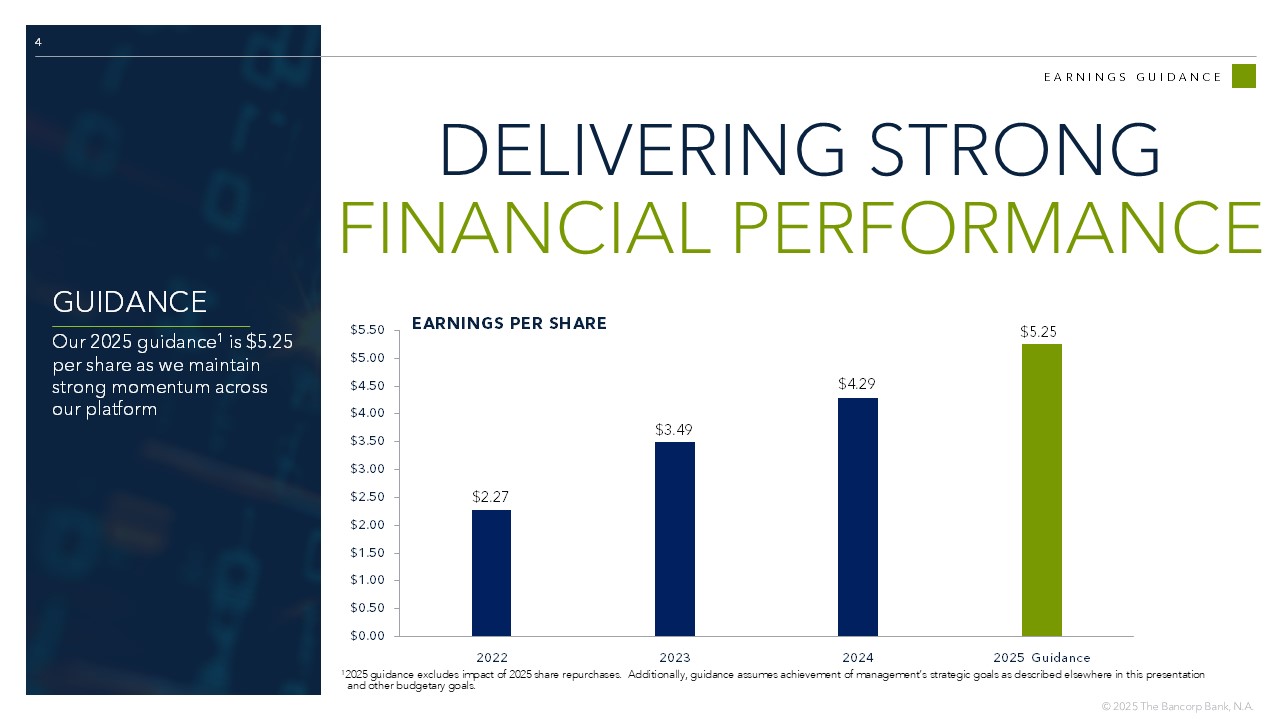
4 EARNINGS GUIDANCE DELIVERING STRONG FINANCIAL PERFORMANCE GUIDANCE Our 2025 guidance 1 is $5.25 per share as we maintain strong momentum across our platform 1 2025 guidance excludes impact of 2025 share repurchases. Additionally, guidance assumes achievement of management’s strategic goals as described elsewhere in this presentation and other budgetary goals. $0.00 $0.50 $1.00 $1.50 $2.00 $2.50 $3.00 $3.50 $4.00 $4.50 $5.00 $5.50 2022 2023 2024 2025 Guidance EARNINGS PER SHARE $5.25 $2.27 $3.49 $4.29
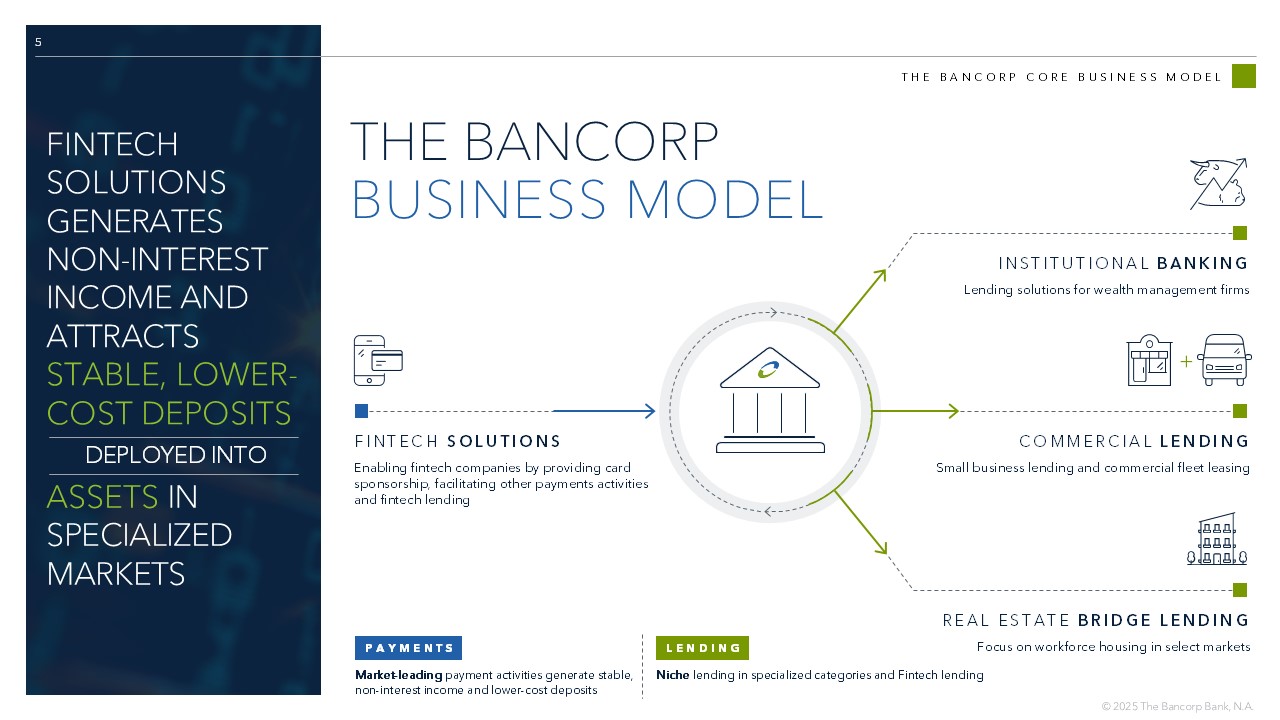
5 THE BANCORP CORE BUSINESS MODEL FINTECH SOLUTIONS GENERATES NON - INTEREST INCOME AND ATTRACTS STABLE, LOWER - COST DEPOSITS DEPLOYED INTO ASSETS IN SPECIALIZED MARKETS THE BANCORP BUSINESS MODEL FINTECH SOLUTIONS Enabling fintech companies by providing card sponsorship, facilitating other payments activities and fintech lending COMMERCIAL LENDING Small business lending and commercial fleet leasing + INSTITUTIONAL BANKING Lending solutions for wealth management firms REAL ESTATE BRIDGE LENDING Focus on workforce housing in select markets PAYMENTS Market - leading payment activities generate stable, non - interest income and lower - cost deposits LENDING Niche lending in specialized categories and Fintech lending
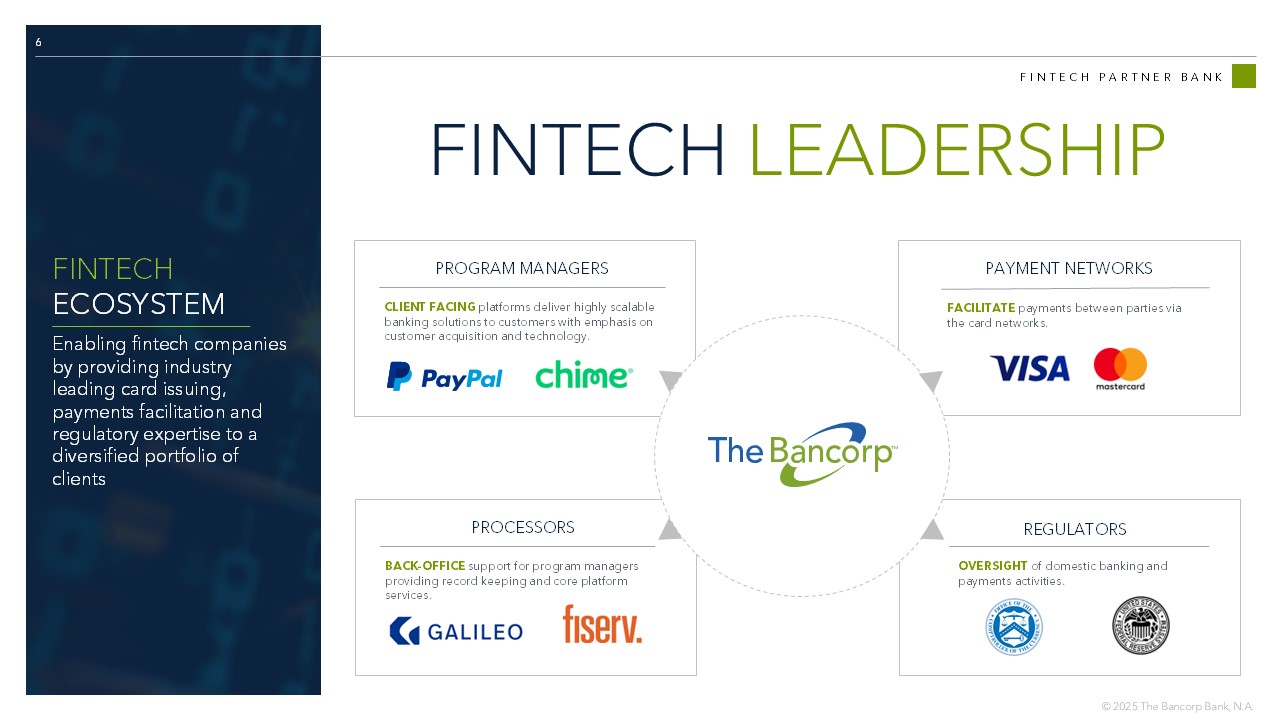
6 FINTECH PARTNER BANK FINTECH LEADERSHIP PAYMENT NETWORKS FACILITATE payments between parties via the card networks. PROGRAM MANAGERS CLIENT FACING platforms deliver highly scalable banking solutions to customers with emphasis on customer acquisition and technology. REGULATORS OVERSIGHT of domestic banking and payments activities. PROCESSORS BACK - OFFICE support for program managers providing record keeping and core platform services. FINTECH ECOSYSTEM Enabling fintech companies by providing industry leading card issuing, payments facilitation and regulatory expertise to a diversified portfolio of clients
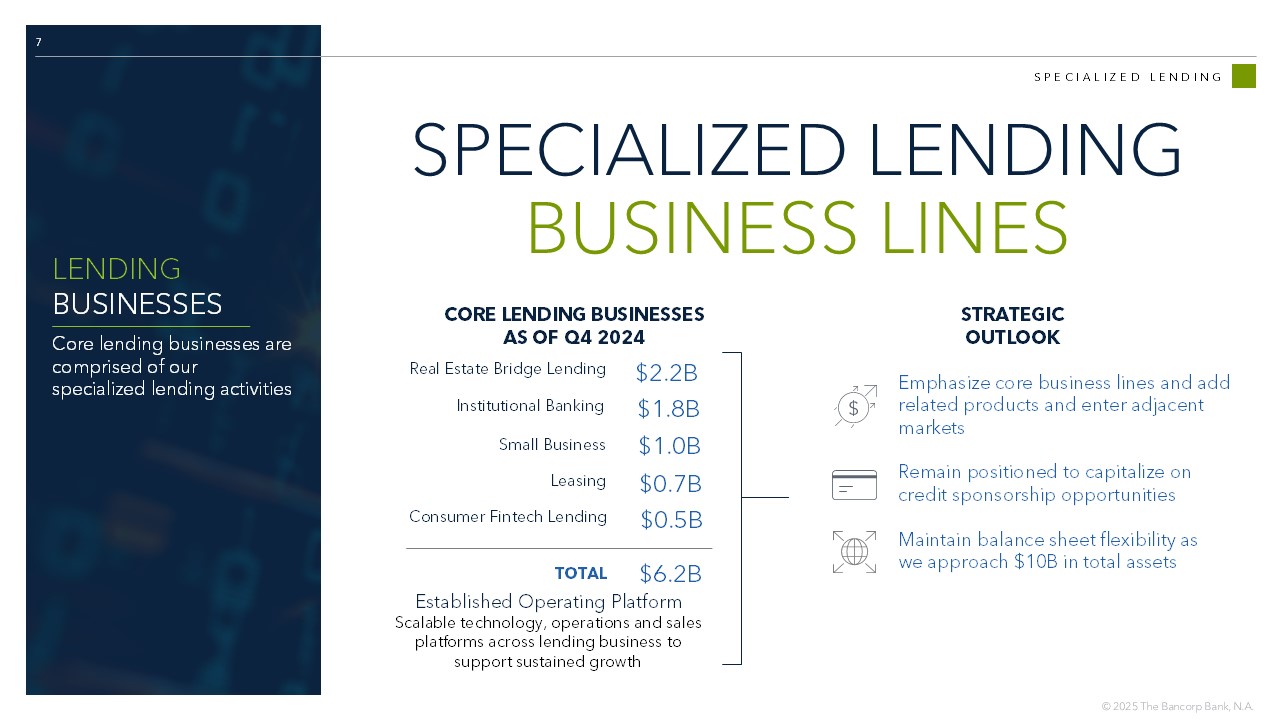
7 SPECIALIZED LENDING SPECIALIZED LENDING BUSINESS LINES LENDING BUSINESSES Core lending businesses are comprised of our specialized lending activities Institutional Banking $1.8B Emphasize core business lines and add related products and enter adjacent markets Remain positioned to capitalize on credit sponsorship opportunities Maintain balance sheet flexibility as we approach $10B in total assets Real Estate Bridge Lending $2.2B Small Business $1.0B Leasing $ 0.7B CORE LENDING BUSINESSES AS OF Q4 2024 TOTAL $ 6.2 B Established Operating Platform Scalable technology, operations and sales platforms across lending business to support sustained growth STRATEGIC OUTLOOK Consumer Fintech Lending $ 0.5B
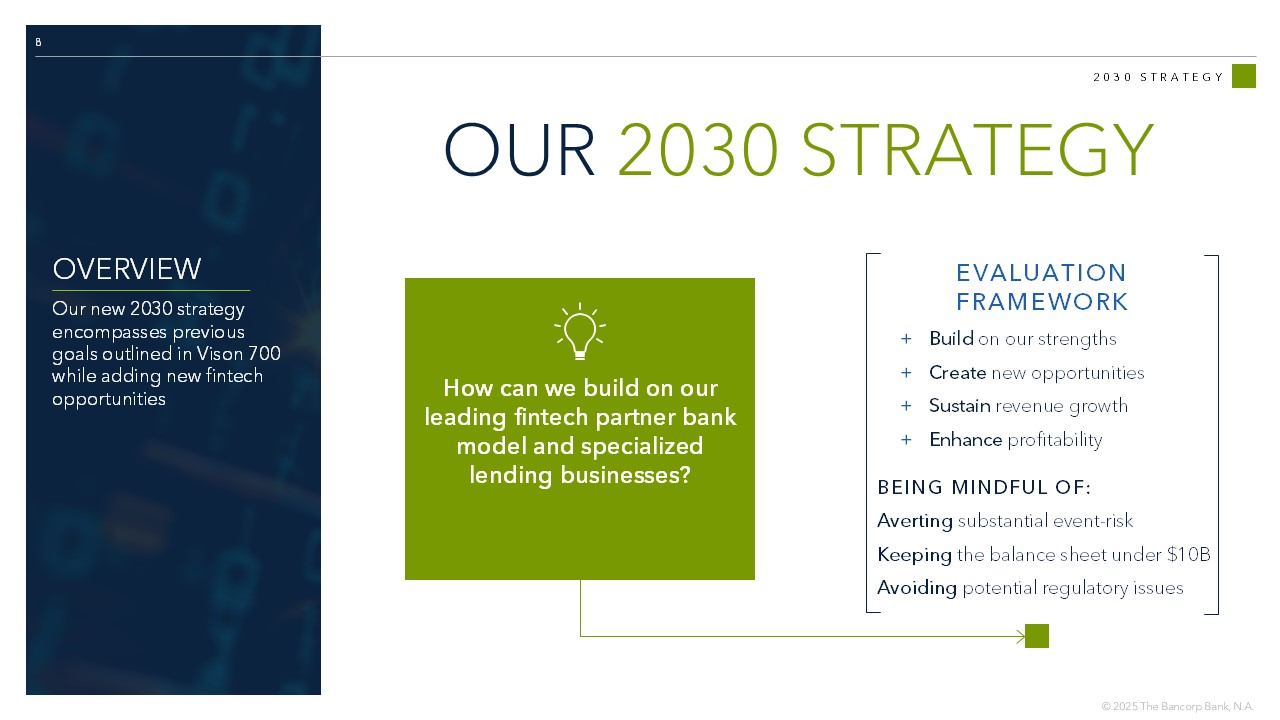
8 2030 STRATEGY OUR 2030 STRATEGY OVERVIEW Our new 2030 strategy encompasses previous goals outlined in Vison 700 while adding new fintech opportunities Build on our strengths Create new opportunities Sustain revenue growth Enhance profitability Averting substantial event - risk Keeping the balance sheet under $10B Avoiding potential regulatory issues + + + + EVALUATION FRAMEWORK BEING MINDFUL OF: How can we build on our leading fintech partner bank model and specialized lending businesses?
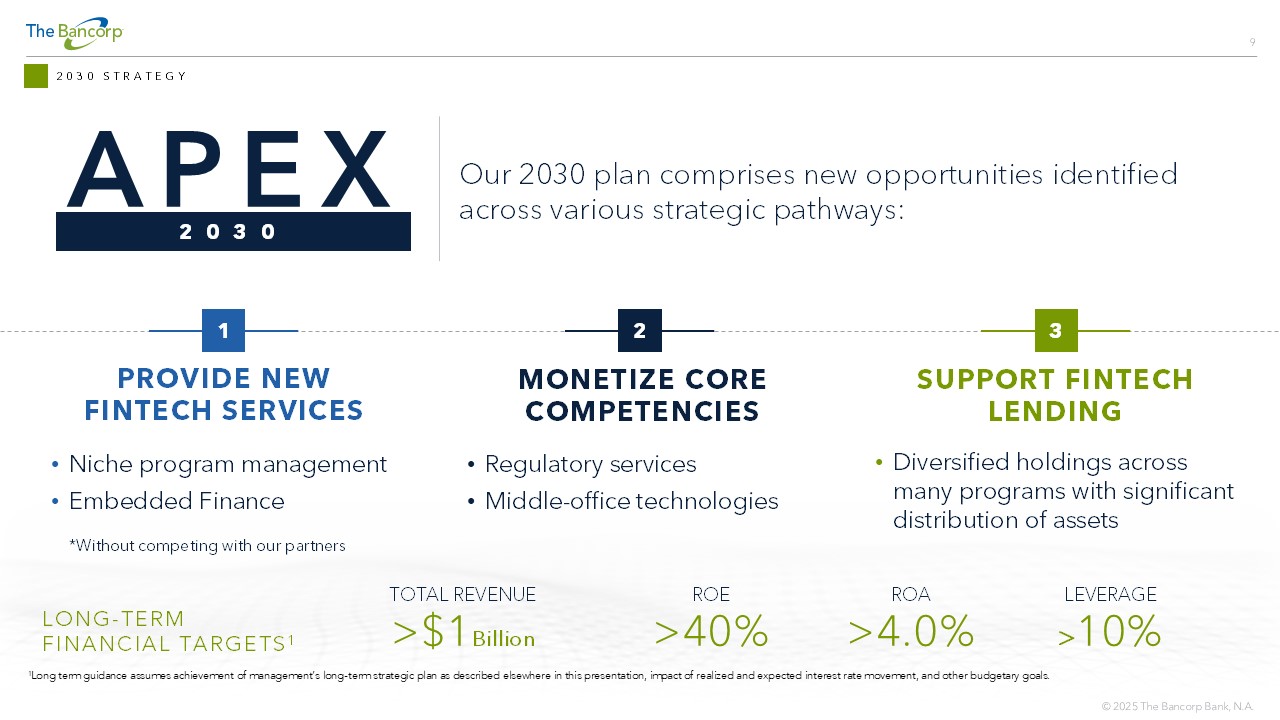
2030 STRATEGY *Without competing with our partners 1 PROVIDE NEW FINTECH SERVICES 3 SUPPORT FINTECH LENDING 2 MONETIZE CORE COMPETENCIES Our 2030 plan comprises new opportunities identified across various strategic pathways: 1 Long term guidance assumes achievement of management’s long - term strategic plan as described elsewhere in this presentation, imp act of realized and expected interest rate movement, and other budgetary goals. TOTAL REVENUE >$1 Billion ROE >40% ROA >4.0% LEVERAGE > 10% LONG - TERM FINANCIAL TARGETS 1 • Niche program management • Embedded Finance • Regulatory services • Middle - office technologies • Diversified holdings across many programs with significant distribution of assets APEX 2030

FINTECH SOLUTIONS: DEPOSIT & FEE GENERATION
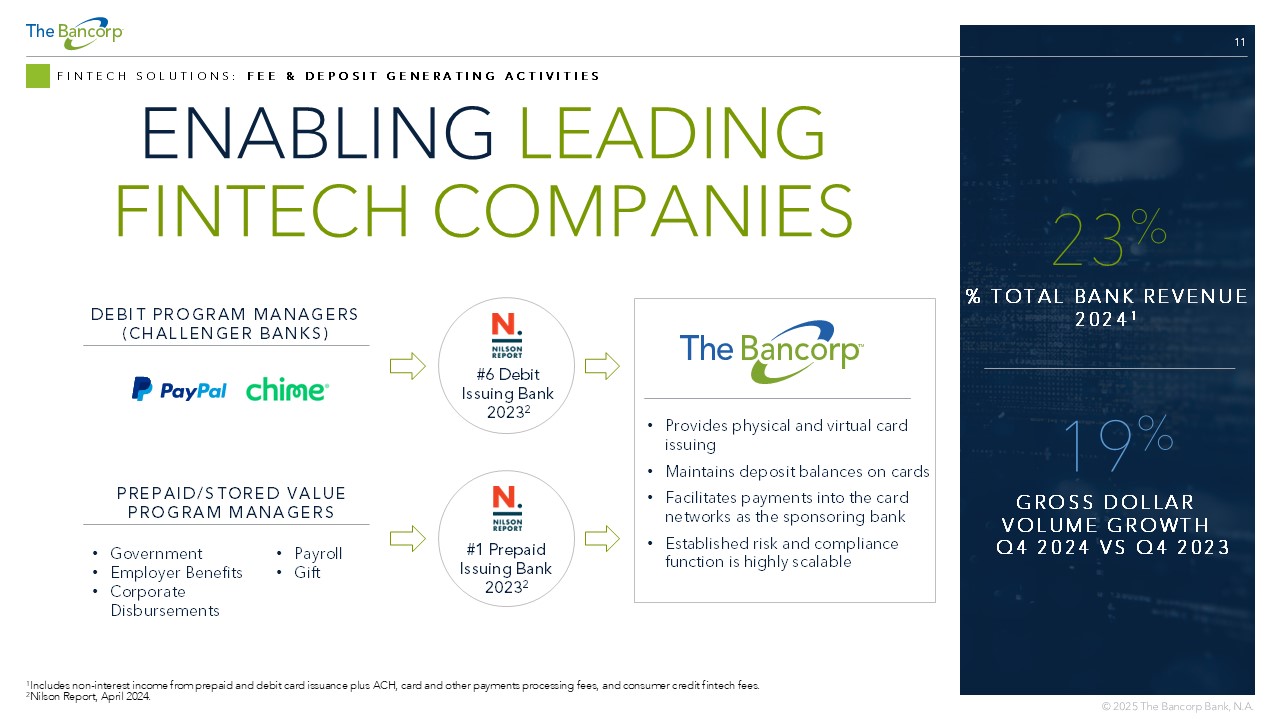
11 FINTECH SOLUTIONS: FEE & DEPOSIT GENERATING ACTIVITIES ENABLING LEADING FINTECH COMPANIES DEBIT PROGRAM MANAGERS (CHALLENGER BANKS) PREPAID/STORED VALUE PROGRAM MANAGERS • Provides physical and virtual card issuing • Maintains deposit balances on cards • Facilitates payments into the card networks as the sponsoring bank • Established risk and compliance function is highly scalable #6 Debit Issuing Bank 2023 2 #1 Prepaid Issuing Bank 2023 2 • Government • Employer Benefits • Corporate Disbursements • Payroll • Gift 1 Includes non - interest income from prepaid and debit card issuance plus ACH, card and other payments processing fees, and consume r credit fintech fees. 2 Nilson Report, April 2024. % TOTAL BANK REVENUE 2024 1 23 % GROSS DOLLAR VOLUME GROWTH Q4 2024 VS Q4 2023 19 %
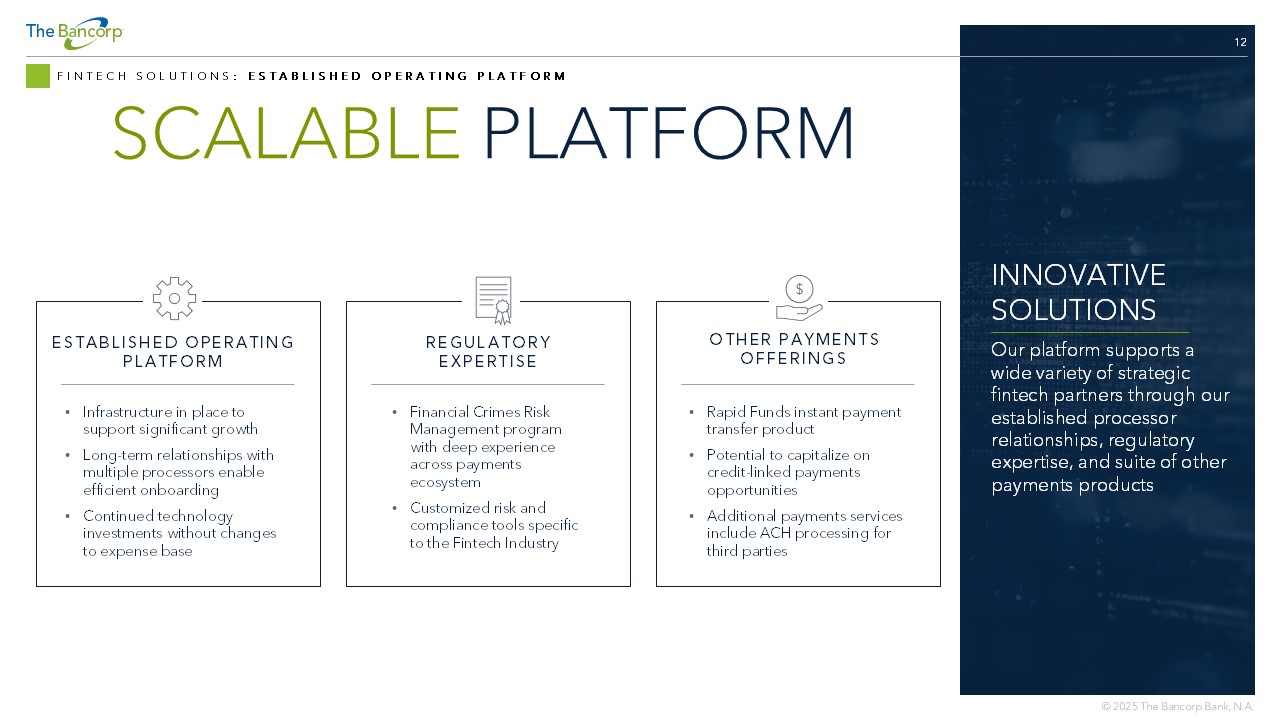
12 FINTECH SOLUTIONS : ESTABLISHED OPERATING PLATFORM SCALABLE PLATFORM ESTABLISHED OPERATING PLATFORM • Infrastructure in place to support significant growth • Long - term relationships with multiple processors enable efficient onboarding • Continued technology investments without changes to expense base REGULATORY EXPERTISE • Financial Crimes Risk Management program with deep experience across payments ecosystem • Customized risk and compliance tools specific to the Fintech Industry OTHER PAYMENTS OFFERINGS • Rapid Funds instant payment transfer product • Potential to capitalize on credit - linked payments opportunities • Additional payments services include ACH processing for third parties INNOVATIVE SOLUTIONS Our platform supports a wide variety of strategic fintech partners through our established processor relationships, regulatory expertise, and suite of other payments products
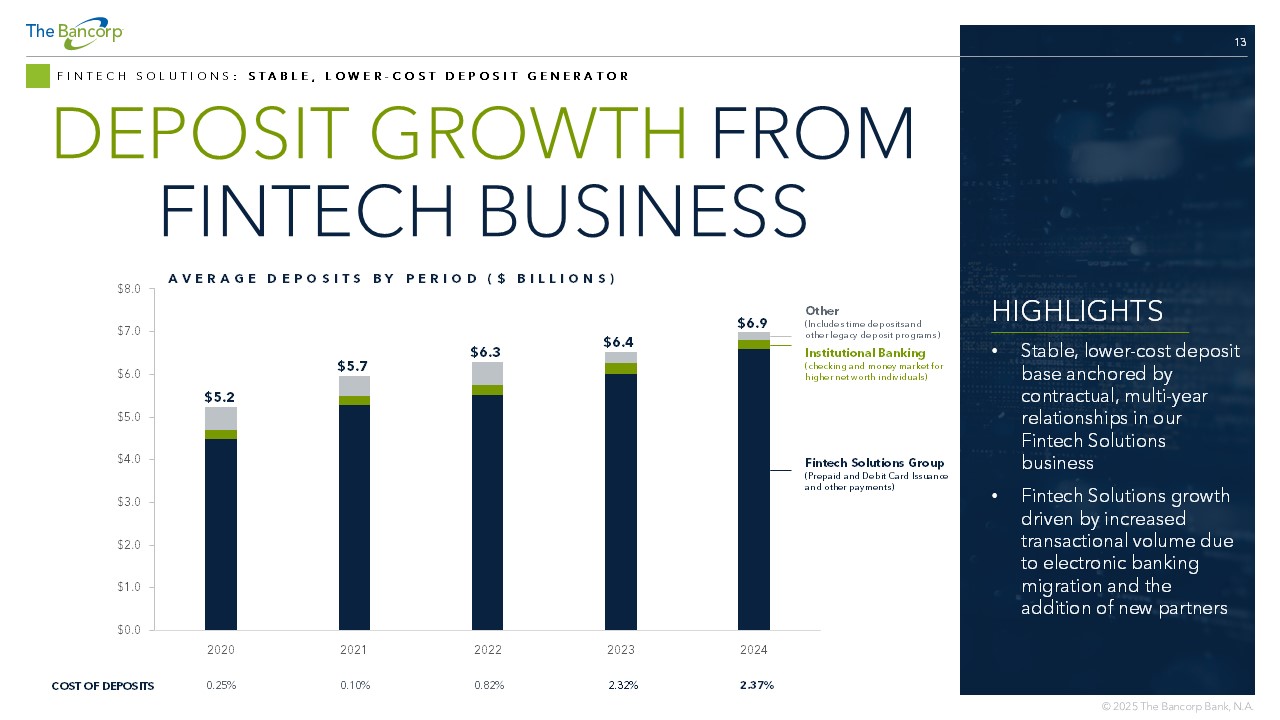
13 FINTECH SOLUTIONS : STABLE, LOWER - COST DEPOSIT GENERATOR DEPOSIT GROWTH FROM FINTECH BUSINESS HIGHLIGHTS • Stable, lower - cost deposit base anchored by contractual, multi - year relationships in our Fintech Solutions business • Fintech Solutions growth driven by increased transactional volume due to electronic banking migration and the addition of new partners $0.0 $1.0 $2.0 $3.0 $4.0 $5.0 $6.0 $7.0 $8.0 2020 2021 2022 2023 2024 AVERAGE DEPOSITS BY PERIOD ($ BILLIONS) Fintech Solutions Group (Prepaid and Debit Card Issuance and other payments) Institutional Banking (checking and money market for higher net worth individuals) Other (Includes time deposits and other legacy deposit programs) 2.37% 2.32% 0.82% 0.10% 0.25% COST OF DEPOSITS $5.2 $5.7 $6.3 $6.4 $6.9
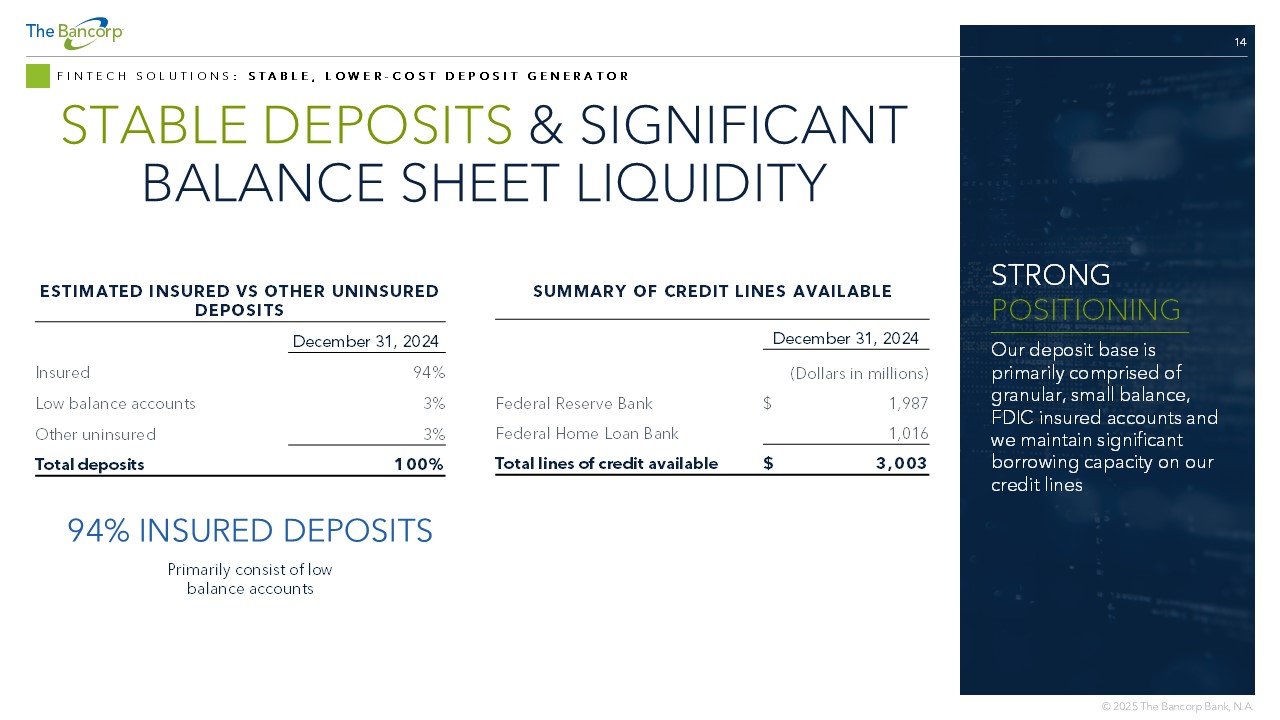
14 FINTECH SOLUTIONS : STABLE, LOWER - COST DEPOSIT GENERATOR STABLE DEPOSITS & SIGNIFICANT BALANCE SHEET LIQUIDITY STRONG POSITIONING Our deposit base is primarily comprised of granular, small balance, FDIC insured accounts and we maintain significant borrowing capacity on our credit lines ESTIMATED INSURED VS OTHER UNINSURED DEPOSITS December 31, 2024 94% Insured 3% Low balance accounts 3% Other uninsured 100% Total deposits SUMMARY OF CREDIT LINES AVAILABLE December 31, 2024 (Dollars in millions) 1,987 $ Federal Reserve Bank 1,016 Federal Home Loan Bank 3,003 $ Total lines of credit available 94% INSURED DEPOSITS Primarily consist of low balance accounts

LOANS, LEASES & SUPPORTING COLLATERAL
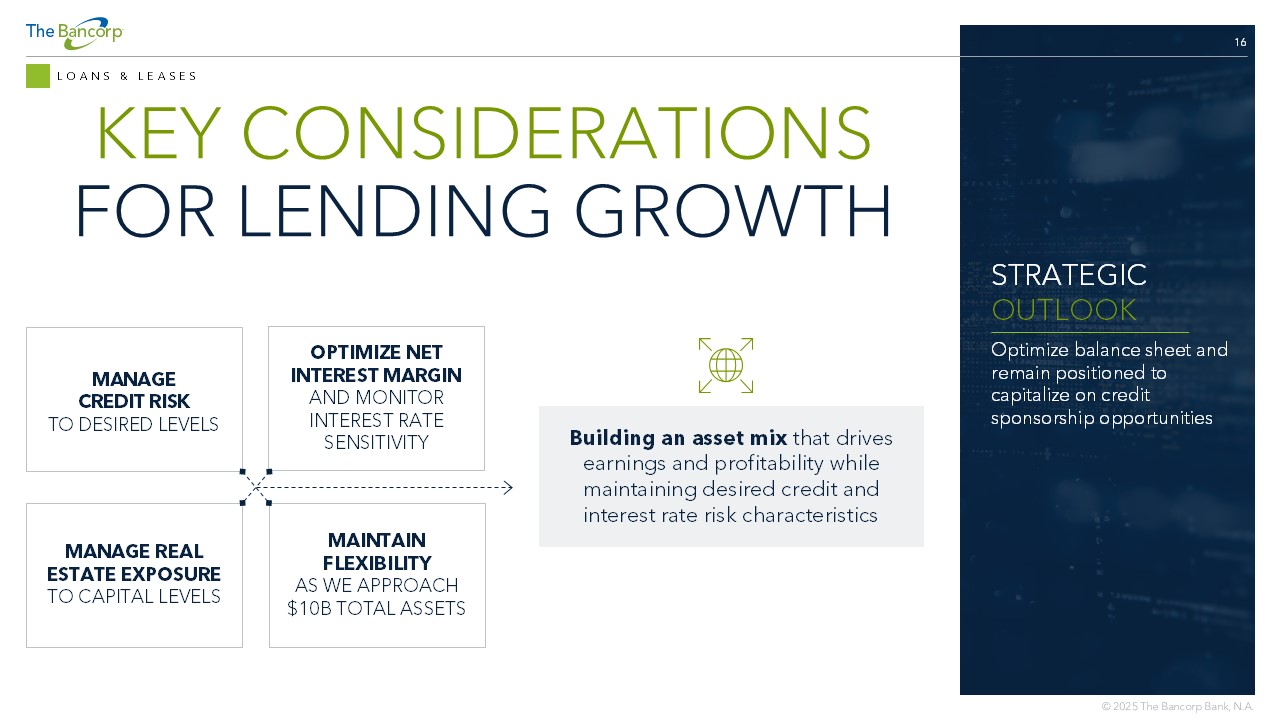
16 LOANS & LEASES STRATEGIC OUTLOOK Optimize balance sheet and r emain positioned to capitalize on credit sponsorship opportunities KEY CONSIDERATIONS FOR LENDING GROWTH MANAGE CREDIT RISK TO DESIRED LEVELS OPTIMIZE NET INTEREST MARGIN AND MONITOR INTEREST RATE SENSITIVITY MANAGE REAL ESTATE EXPOSURE TO CAPITAL LEVELS MAINTAIN FLEXIBILITY AS WE APPROACH $10B TOTAL ASSETS Building an asset mix that drives earnings and profitability while maintaining desired credit and interest rate risk characteristics
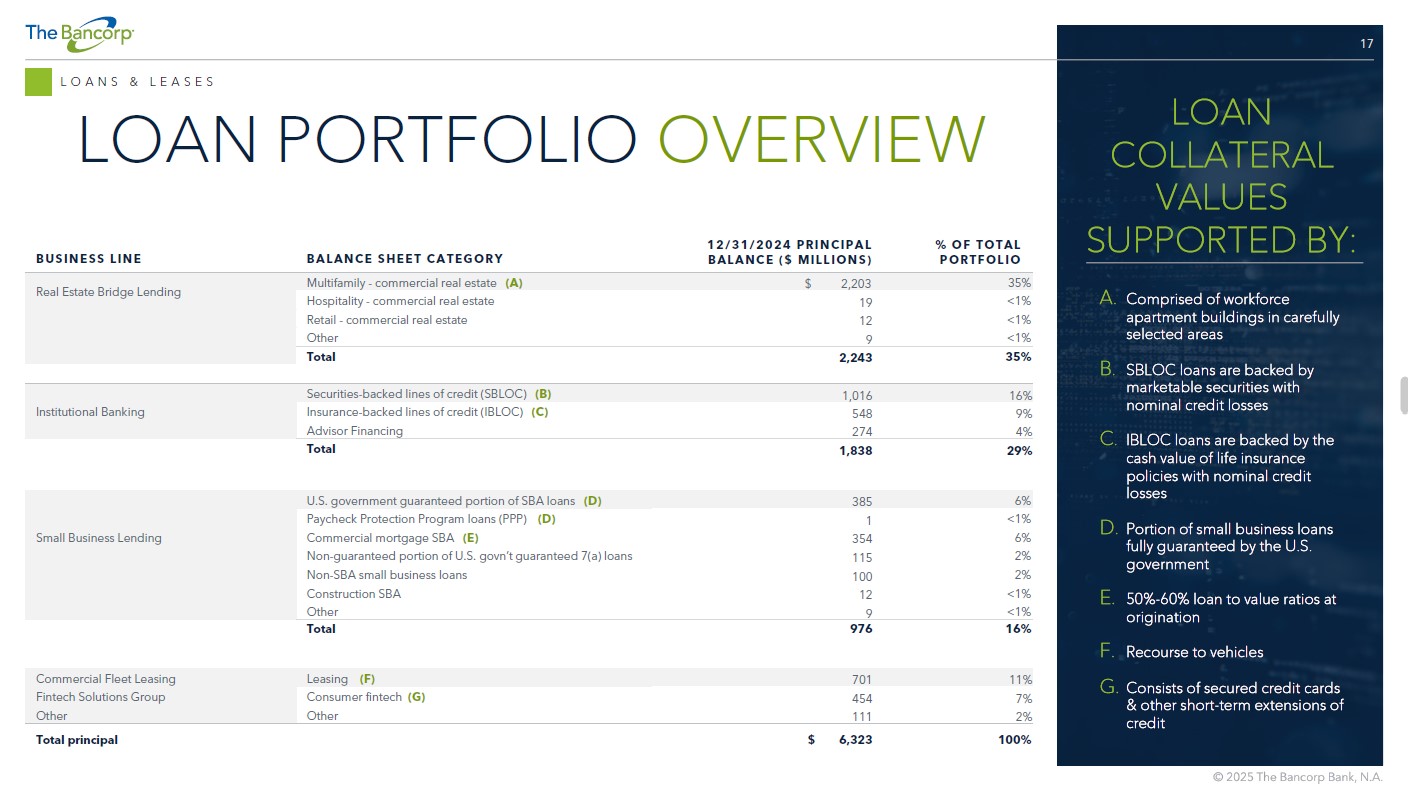
17 LOANS & LEASES LOAN PORTFOLIO OVERVIEW % OF TOTAL PORTFOLIO 12/31/2024 PRINCIPAL BALANCE ($ MILLIONS) BALANCE SHEET CATEGORY BUSINESS LINE 35% $ 2,203 Multifamily - commercial real estate (A) Real Estate Bridge Lending <1% 19 Hospitality - commercial real estate <1% 12 Retail - commercial real estate <1% 9 Other 35% 2,243 Total 16% 1,016 Securities - backed lines of credit (SBLOC) ( B) Institutional Banking 9% 548 Insurance - backed lines of credit (IBLOC) (C) 4% 274 Advisor Financing 29% 1,838 Total 6% 385 U.S. government guaranteed portion of SBA loans ( D) Small Business Lending <1% 1 Pay check Protection Program loans (PPP) ( D) 6% 354 Commercial mortgage SBA ( E) 2% 115 Non - guaranteed portion of U.S. govn’t guaranteed 7(a) loans 2% 100 Non - SBA small business loans <1% 12 Construction SBA <1% 9 Other 16% 976 Total 11% 701 Leasing ( F) Commercial Fleet Leasing 7% 454 Consumer fintech ( G) Fintech Solutions Group 2% 111 Other Other 100% $ 6,323 Total principal LOAN COLLATERAL VALUES SUPPORTED BY: A. Comprised of workforce apartment buildings in carefully selected areas B. SBLOC loans are backed by marketable securities with nominal credit losses C. IBLOC loans are backed by the cash value of life insurance policies with nominal credit losses D. Portion of small business loans fully guaranteed by the U.S. government E. 50% - 60% loan to value ratios at origination F. Recourse to vehicles G. Consists of secured credit cards & other short - term extensions of credit
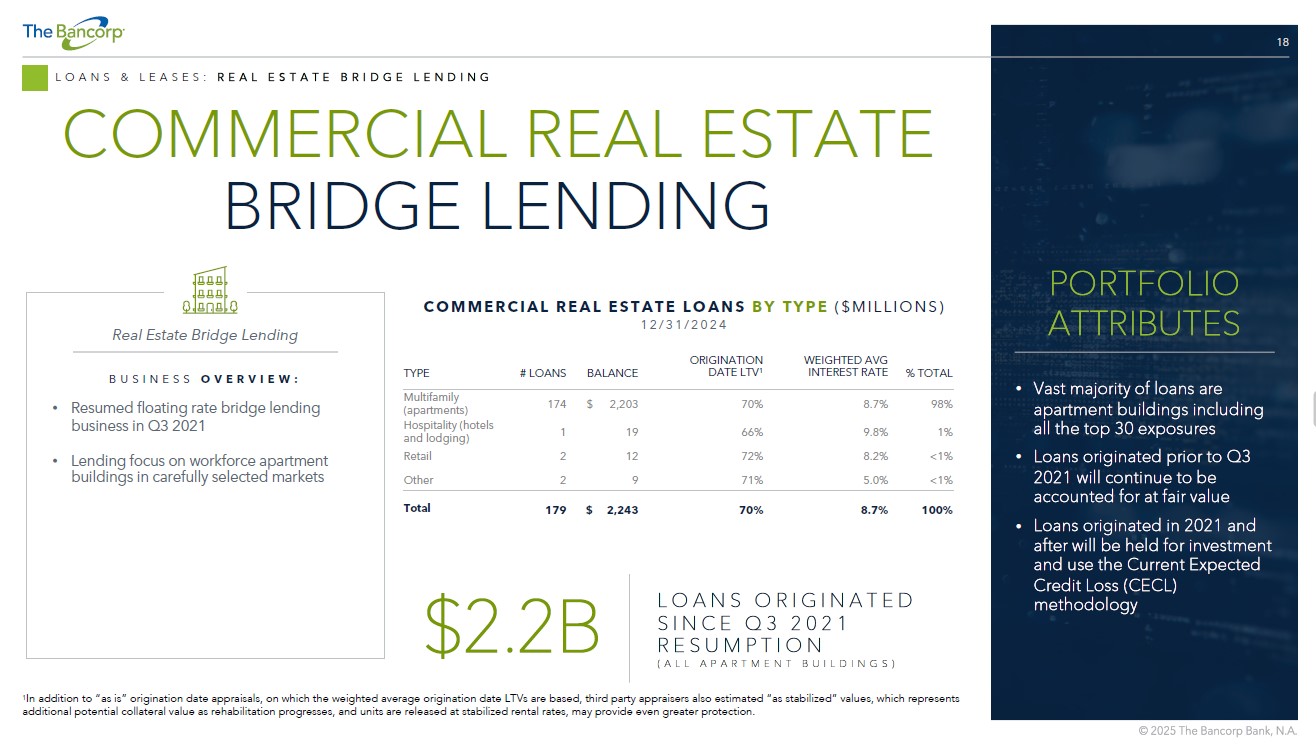
18 LOANS & LEASES: REAL ESTATE BRIDGE LENDING COMMERCIAL REAL ESTATE BRIDGE LENDING % TOTAL WEIGHTED AVG INTEREST RATE ORIGINATION DATE LTV 1 BALANCE # LOANS TYPE 98% 8.7% 70% $ 2,203 174 Multifamily (apartments) 1% 9.8% 66% 19 1 Hospitality (hotels and lodging) <1% 8.2% 72% 12 2 Retail <1% 5.0% 71% 9 2 Other 100% 8.7% 70% $ 2,243 179 Total COMMERCIAL REAL ESTATE LOANS BY TYPE ($MILLIONS) 12/31/2024 $2.2B PORTFOLIO LOANS ORIGINATED SINCE Q3 2021 RESUMPTION (ALL APARTMENT BUILDINGS) BUSINESS OVERVIEW: • Resumed floating rate bridge lending business in Q3 2021 • Lending focus on workforce apartment buildings in carefully selected markets Real Estate Bridge Lending • Vast majority of loans are apartment buildings including all the top 30 exposures • Loans originated prior to Q3 2021 will continue to be accounted for at fair value • Loans originated in 2021 and after will be held for investment and use the Current Expected Credit Loss (CECL) methodology PORTFOLIO ATTRIBUTES 1 In addition to “as is” origination date appraisals, on which the weighted average origination date LTVs are based, third part y a ppraisers also estimated “as stabilized” values, which represents additional potential collateral value as rehabilitation progresses, and units are released at stabilized rental rates, may pr ovi de even greater protection.
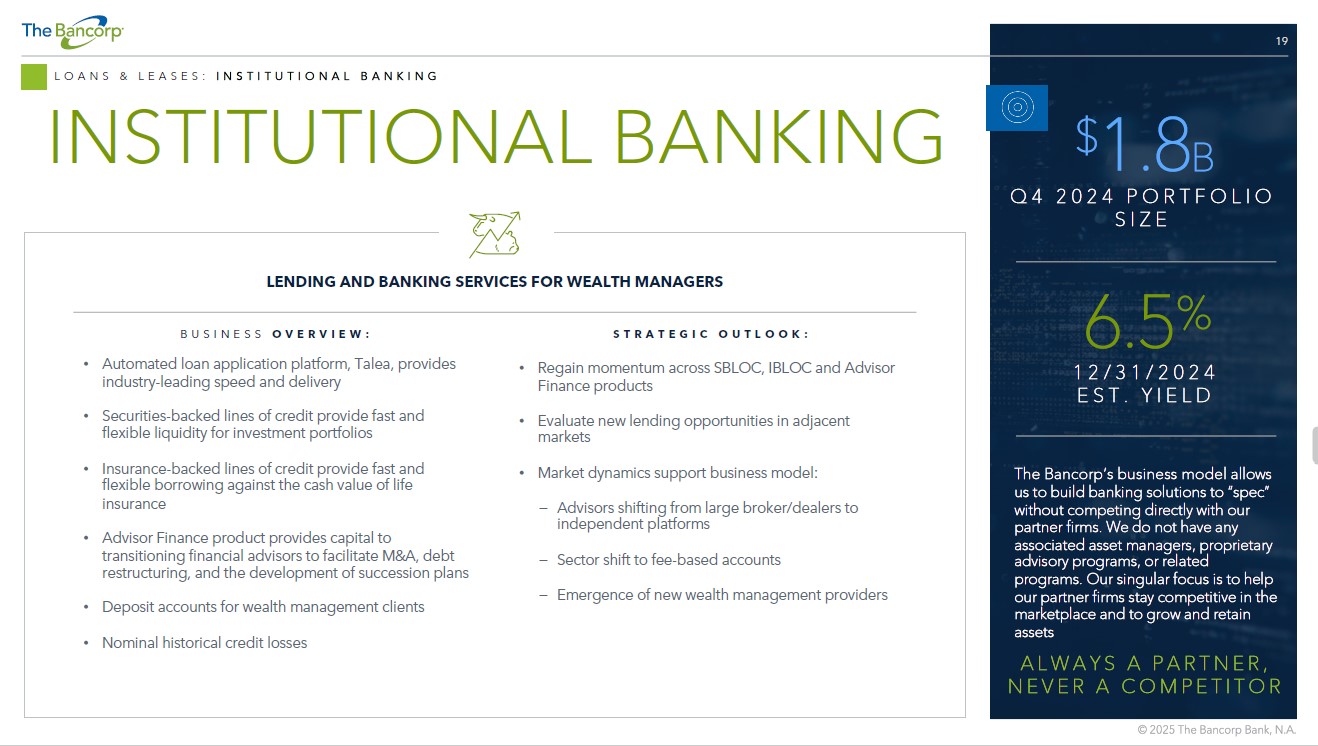
19 LOANS & LEASES: INSTITUTIONAL BANKING INSTITUTIONAL BANKING BUSINESS OVERVIEW: • Automated loan application platform, Talea, provides industry - leading speed and delivery • Securities - backed lines of credit provide fast and flexible liquidity for investment portfolios • Insurance - backed lines of credit provide fast and flexible borrowing against the cash value of life insurance • Advisor Finance product provides capital to transitioning financial advisors to facilitate M&A, debt restructuring, and the development of succession plans • Deposit accounts for wealth management clients • Nominal historical credit losses STRATEGIC OUTLOOK: • Regain momentum across SBLOC, IBLOC and Advisor Finance products • Evaluate new lending opportunities in adjacent markets • Market dynamics support business model: − Advisors shifting from large broker/dealers to independent platforms − Sector shift to fee - based accounts − Emergence of new wealth management providers LENDING AND BANKING SERVICES FOR WEALTH MANAGERS The Bancorp’s business model allows us to build banking solutions to “spec” without competing directly with our partner firms. We do not have any associated asset managers, proprietary advisory programs, or related programs. Our singular focus is to help our partner firms stay competitive in the marketplace and to grow and retain assets ALWAYS A PARTNER, NEVER A COMPETITOR $ 1.8 B Q4 2024 PORTFOLIO SIZE 6.5 % 12/31/2024 EST. YIELD
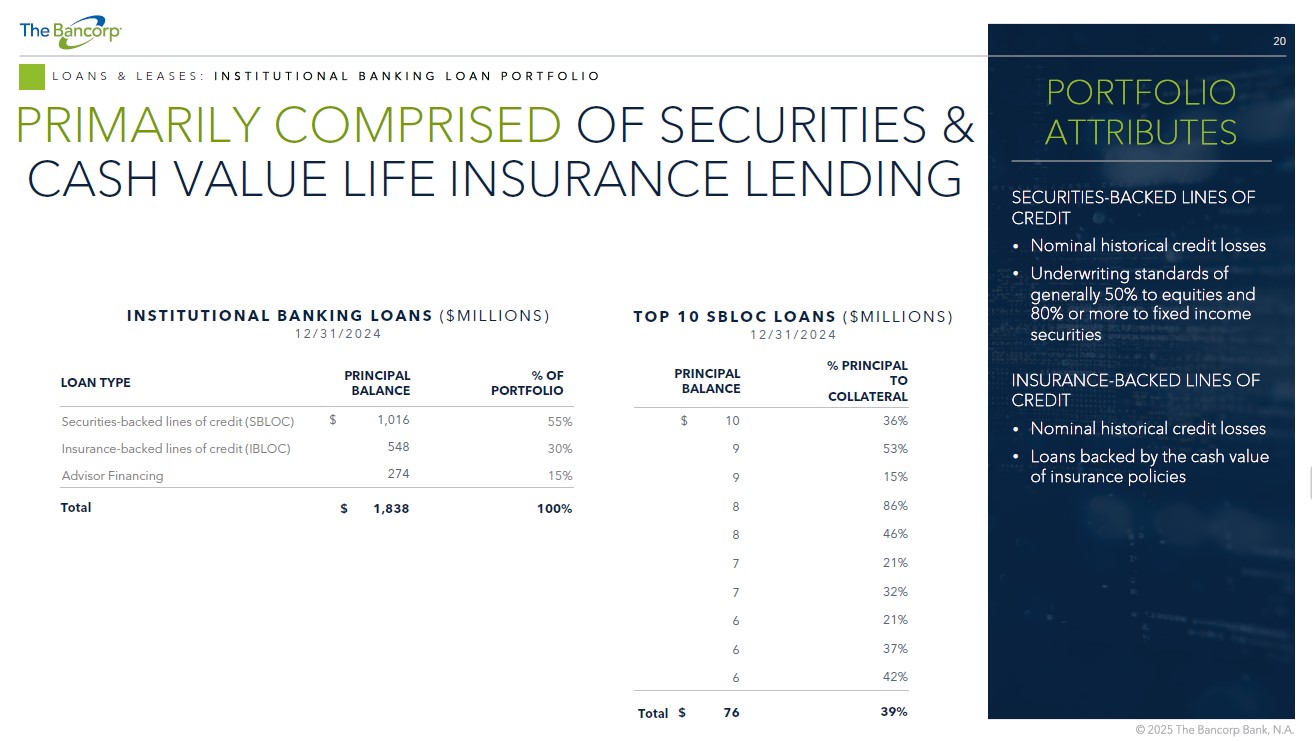
20 LOANS & LEASES: INSTITUTIONAL BANKING LOAN PORTFOLIO PRIMARILY COMPRISED OF SECURITIES & CASH VALUE LIFE INSURANCE LENDING % OF PORTFOLIO PRINCIPAL BALANCE LOAN TYPE 55% $ 1,016 Securities - backed lines of credit (SBLOC) 30% 548 Insurance - backed lines of credit (IBLOC) 15% 274 Advisor Financing 100% $ 1,838 Total INSTITUTIONAL BANKING LOANS ($MILLIONS) 12/31/2024 % PRINCIPAL TO COLLATERAL PRINCIPAL BALANCE 36% $ 10 53% 9 15% 9 86% 8 46% 8 21% 7 32% 7 21% 6 37% 6 42% 6 39% $ 76 Total TOP 10 SBLOC LOANS ($MILLIONS) 12/31/2024 SECURITIES - BACKED LINES OF CREDIT • Nominal historical credit losses • Underwriting standards of generally 50% to equities and 80% or more to fixed income securities INSURANCE - BACKED LINES OF CREDIT • Nominal historical credit losses • Loans backed by the cash value of insurance policies PORTFOLIO ATTRIBUTES
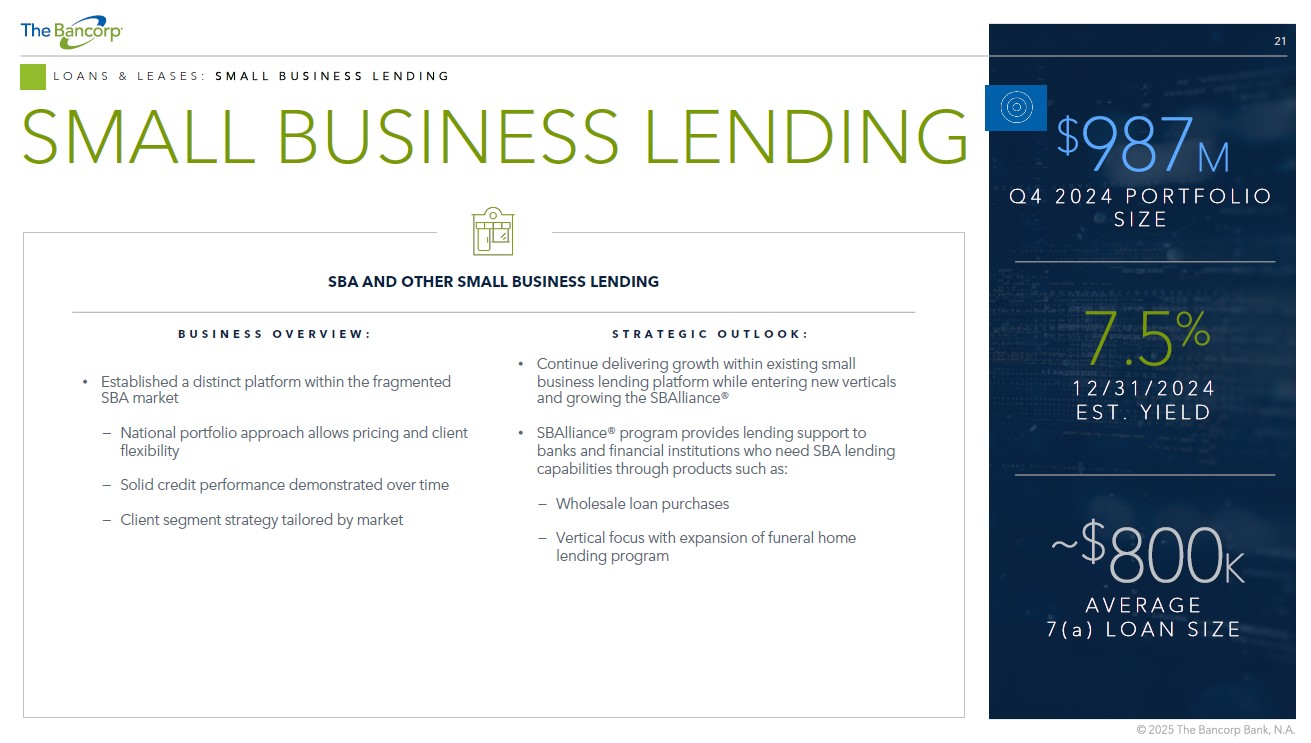
21 LOANS & LEASES: SMALL BUSINESS LENDING SMALL BUSINESS LENDING $ 987 M Q4 2024 PORTFOLIO SIZE 7.5 % 12/31/2024 EST. YIELD BUSINESS OVERVIEW: • Established a distinct platform within the fragmented SBA market − National portfolio approach allows pricing and client flexibility − Solid credit performance demonstrated over time − Client segment strategy tailored by market STRATEGIC OUTLOOK: • Continue delivering growth within existing small business lending platform while entering new verticals and growing the SBAlliance ® • SBAlliance ® program provides lending support to banks and financial institutions who need SBA lending capabilities through products such as: − Wholesale loan purchases − Vertical focus with expansion of funeral home lending program SBA AND OTHER SMALL BUSINESS LENDING ~$ 800 K AVERAGE 7(a) LOAN SIZE
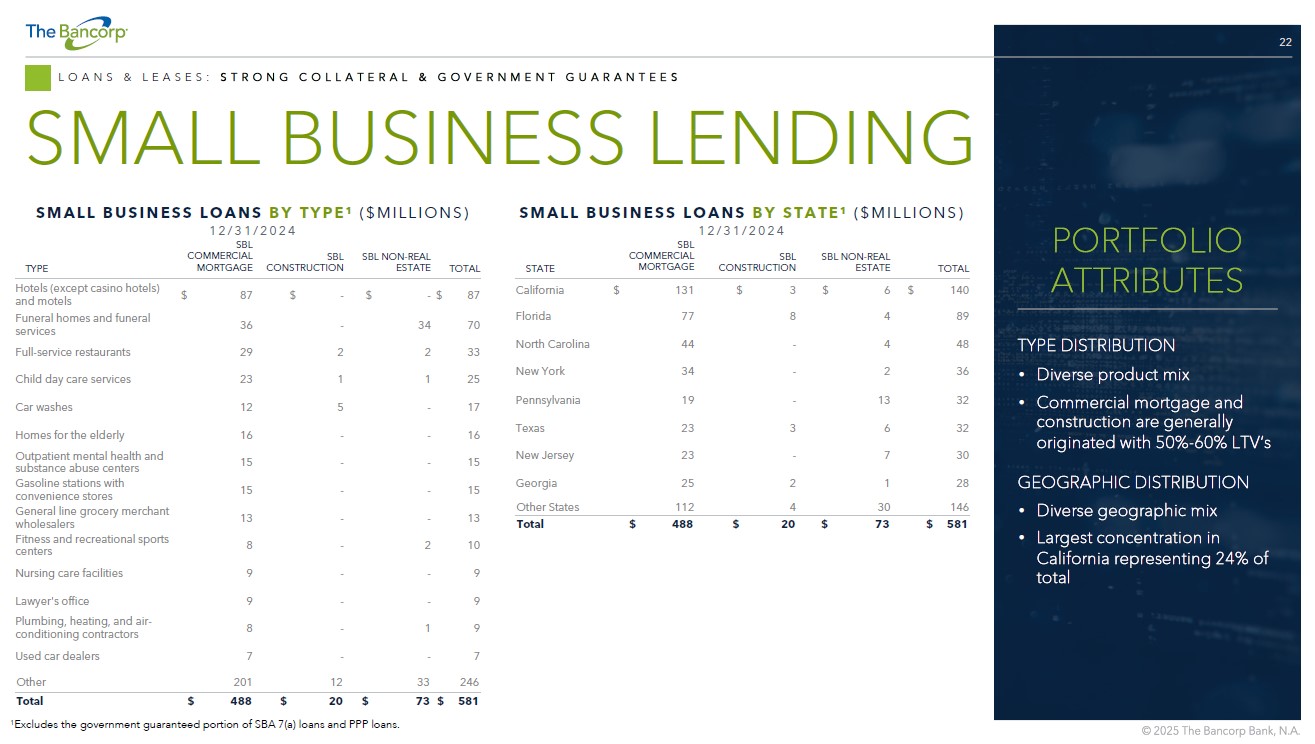
22 LOANS & LEASES: STRONG COLLATERAL & GOVERNMENT GUARANTEES SMALL BUSINESS LENDING SMALL BUSINESS LOANS BY TYPE 1 ($MILLIONS) 12/31/2024 SMALL BUSINESS LOANS BY STATE 1 ($MILLIONS) 12/31/2024 TOTAL SBL NON - REAL ESTATE SBL CONSTRUCTION SBL COMMERCIAL MORTGAGE STATE $ 140 $ 6 $ 3 $ 131 California 89 4 8 77 Florida 48 4 - 44 North Carolina 36 2 - 34 New York 32 13 - 19 Pennsylvania 32 6 3 23 Texas 30 7 - 23 New Jersey 28 1 2 25 Georgia 146 30 4 112 Other States $ 581 $ 73 $ 20 $ 488 Total TOTAL SBL NON - REAL ESTATE SBL CONSTRUCTION SBL COMMERCIAL MORTGAGE TYPE $ 87 $ - $ - $ 87 Hotels (except casino hotels) and motels 70 34 - 36 Funeral homes and funeral services 33 2 2 29 Full - service restaurants 25 1 1 23 Child day care services 17 - 5 12 Car washes 16 - - 16 Homes for the elderly 15 - - 15 Outpatient mental health and substance abuse centers 15 - - 15 Gasoline stations with convenience stores 13 - - 13 General line grocery merchant wholesalers 10 2 - 8 Fitness and recreational sports centers 9 - - 9 Nursing care facilities 9 - - 9 Lawyer's office 9 1 - 8 Plumbing, heating, and air - conditioning contractors 7 - - 7 Used car dealers 246 33 12 201 Other $ 581 $ 73 $ 20 $ 488 Total 1 Excludes the government guaranteed portion of SBA 7(a) loans and PPP loans. TYPE DISTRIBUTION • Diverse product mix • Commercial mortgage and construction are generally originated with 50% - 60% LTV’s GEOGRAPHIC DISTRIBUTION • Diverse geographic mix • Largest concentration in California representing 24% of total PORTFOLIO ATTRIBUTES
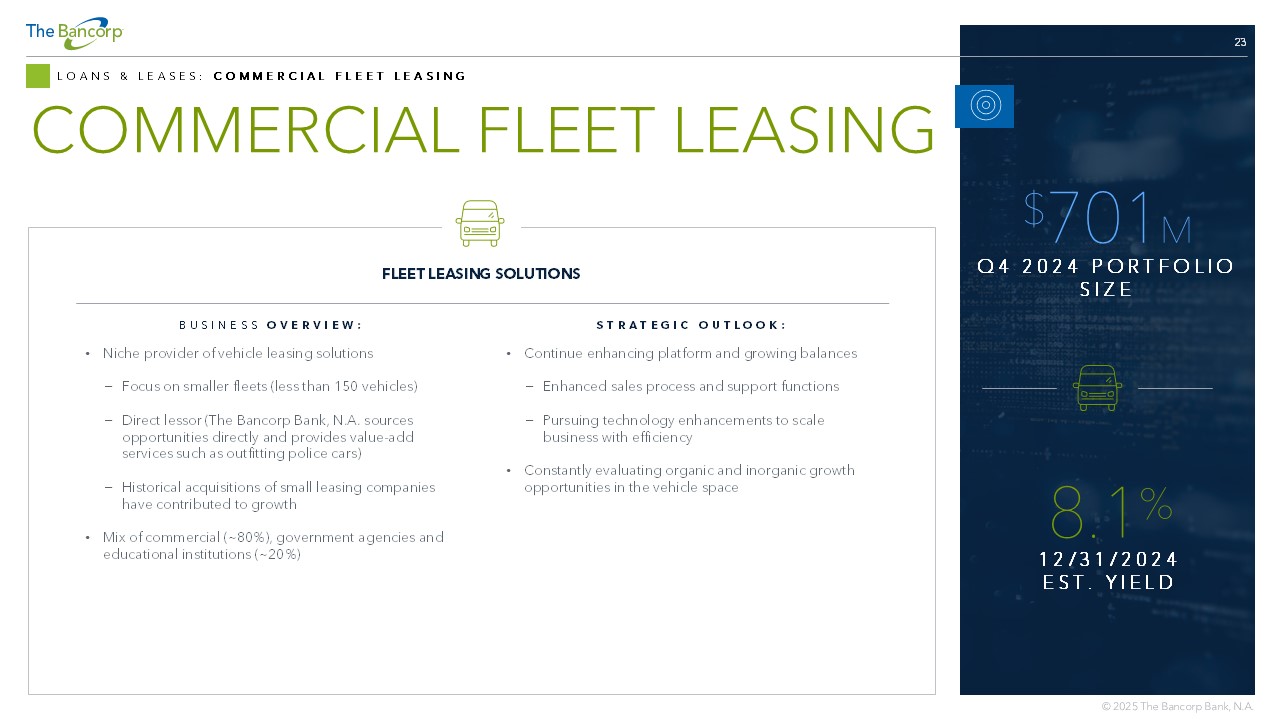
23 LOANS & LEASES: COMMERCIAL FLEET LEASING COMMERCIAL FLEET LEASING BUSINESS OVERVIEW: • Niche provider of vehicle leasing solutions − Focus on smaller fleets (less than 150 vehicles) − Direct lessor (The Bancorp Bank, N.A. sources opportunities directly and provides value - add services such as outfitting police cars) − Historical acquisitions of small leasing companies have contributed to growth • Mix of commercial (~80%), government agencies and educational institutions (~20%) STRATEGIC OUTLOOK: • Continue enhancing platform and growing balances − Enhanced sales process and support functions − Pursuing technology enhancements to scale business with efficiency • Constantly evaluating organic and inorganic growth opportunities in the vehicle space FLEET LEASING SOLUTIONS $ 701 M Q4 2024 PORTFOLIO SIZE 8.1 % 12/31/2024 EST. YIELD
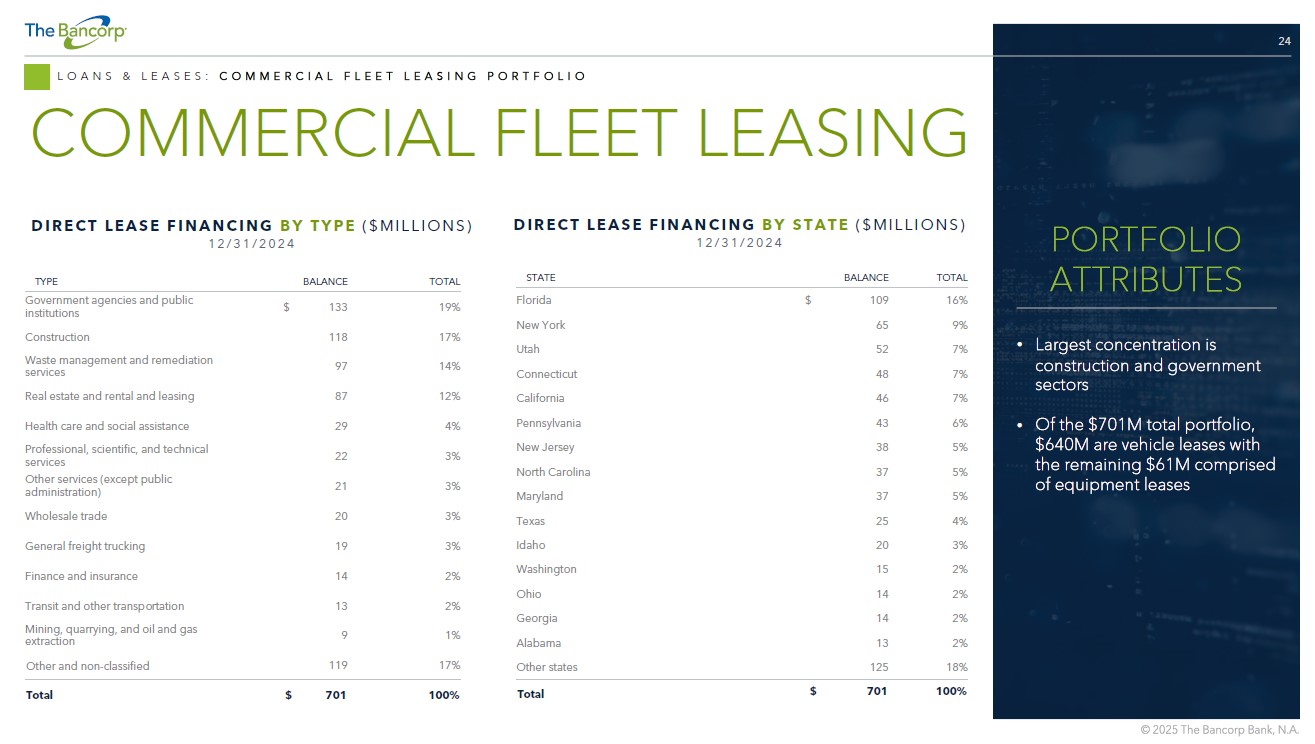
24 TOTAL BALANCE STATE 16% $ 109 Florida 9% 65 New York 7% 52 Utah 7% 48 Connecticut 7% 46 California 6% 43 Pennsylvania 5% 38 New Jersey 5% 37 North Carolina 5% 37 Maryland 4% 25 Texas 3% 20 Idaho 2% 15 Washington 2% 14 Ohio 2% 14 Georgia 2% 13 Alabama 18% 125 Other states 100% $ 701 Total LOANS & LEASES: COMMERCIAL FLEET LEASING PORTFOLIO COMMERCIAL FLEET LEASING • Largest concentration is construction and government sectors • Of the $701M total portfolio, $640M are vehicle leases with the remaining $61M comprised of equipment leases PORTFOLIO ATTRIBUTES TOTAL BALANCE TYPE 19% $ 133 Government agencies and public institutions 17% 118 Construction 14% 97 Waste management and remediation services 12% 87 Real estate and rental and leasing 4% 29 Health care and social assistance 3% 22 Professional, scientific, and technical services 3% 21 Other services (except public administration) 3% 20 Wholesale trade 3% 19 General freight trucking 2% 14 Finance and insurance 2% 13 Transit and other transportation 1% 9 Mining, quarrying, and oil and gas extraction 17% 119 Other and non - classified 100% $ 701 Total DIRECT LEASE FINANCING BY STATE ($MILLIONS) 12/31/2024 DIRECT LEASE FINANCING BY TYPE ($MILLIONS) 12/31/2024

FINANCIAL REVIEW
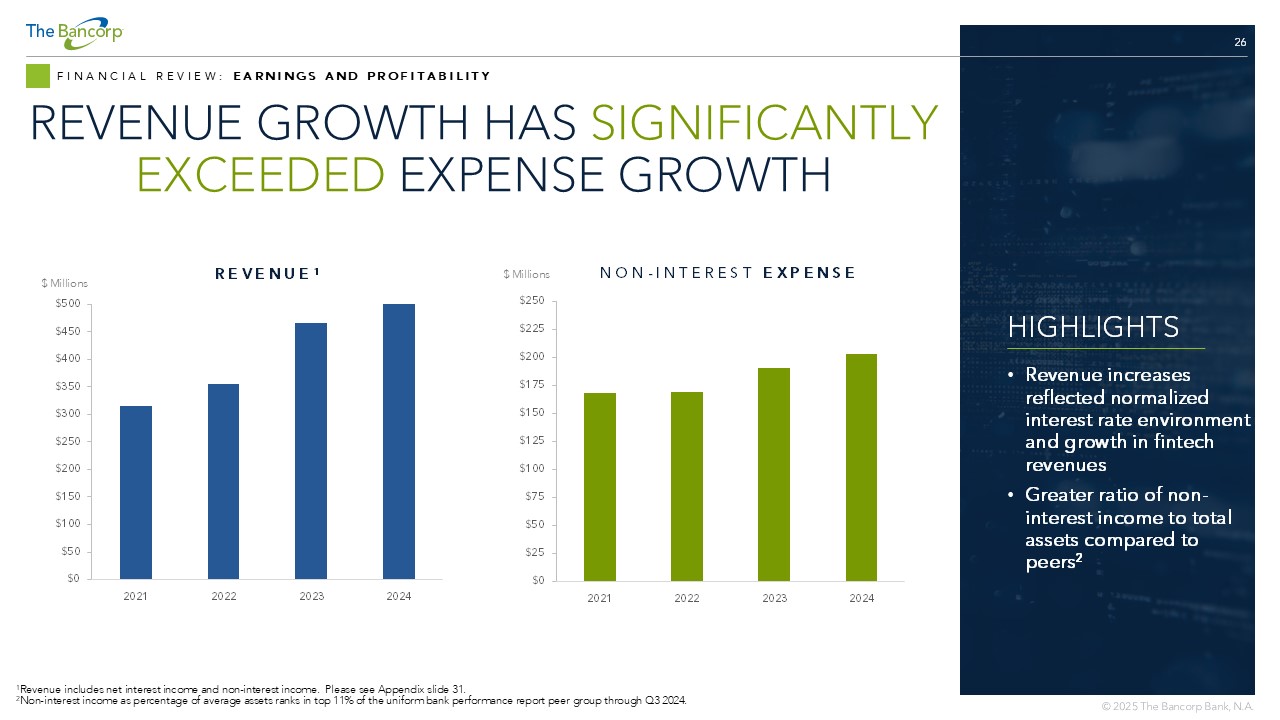
26 FINANCIAL REVIEW: EARNINGS AND PROFITABILITY REVENUE GROWTH HAS SIGNIFICANTLY EXCEEDED EXPENSE GROWTH 1 Revenue includes net interest income and non - interest income. Please see Appendix slide 31. 2 Non - interest income as percentage of average assets ranks in top 11% of the uniform bank performance report peer group through Q 3 2024. $0 $25 $50 $75 $100 $125 $150 $175 $200 $225 $250 2021 2022 2023 2024 NON - INTEREST EXPENSE $ Millions $0 $50 $100 $150 $200 $250 $300 $350 $400 $450 $500 2021 2022 2023 2024 REVENUE 1 $ Millions HIGHLIGHTS • Revenue increases reflected normalized interest rate environment and growth in fintech revenues • Greater ratio of non - interest income to total assets compared to peers 2
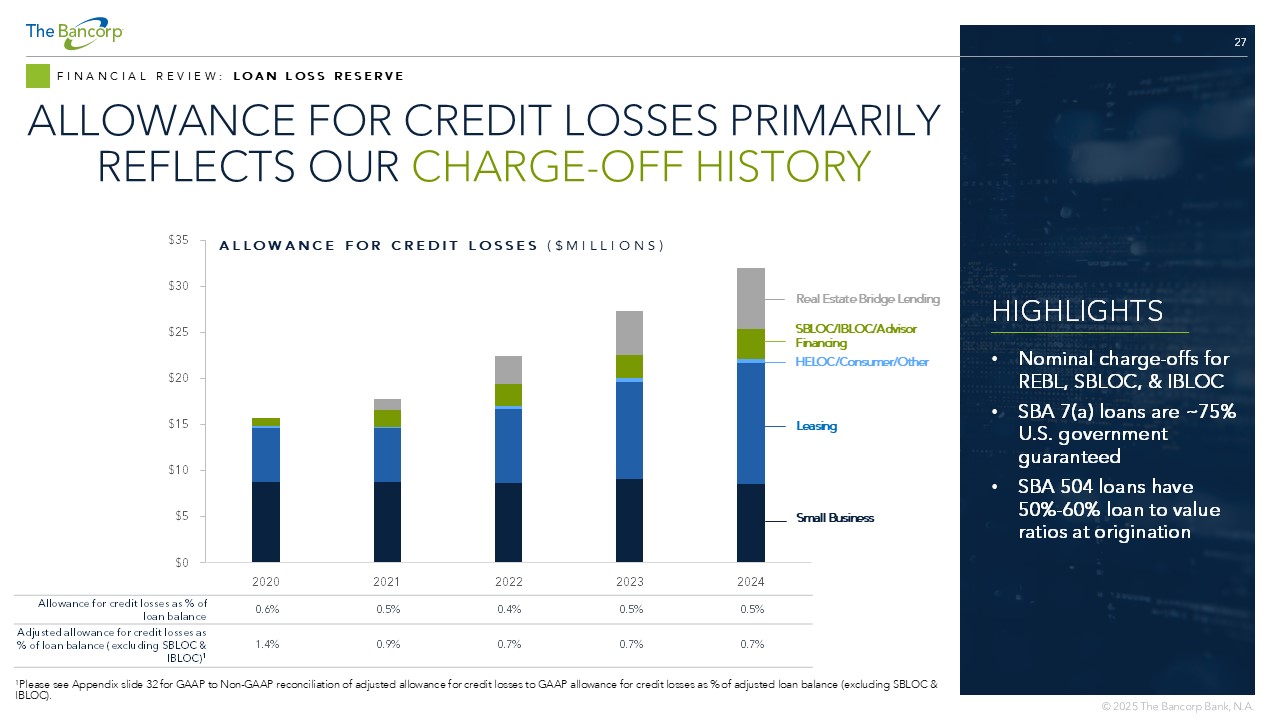
27 FINANCIAL REVIEW: LOAN LOSS RESERVE ALLOWANCE FOR CREDIT LOSSES PRIMARILY REFLECTS OUR CHARGE - OFF HISTORY 1 Please see Appendix slide 32 for GAAP to Non - GAAP reconciliation of adjusted allowance for credit losses to GAAP allowance for c redit losses as % of adjusted loan balance (excluding SBLOC & IBLOC). HIGHLIGHTS • Nominal charge - offs for REBL, SBLOC, & IBLOC • SBA 7(a) loans are ~75% U.S. government guaranteed • SBA 504 loans have 50% - 60% loan to value ratios at origination $0 $5 $10 $15 $20 $25 $30 $35 2020 2021 2022 2023 2024 ALLOWANCE FOR CREDIT LOSSES ($MILLIONS) Small Business HELOC/Consumer/Other SBLOC/IBLOC/Advisor Financing 0.5% 0.5% 0.4% 0.5% 0.6% Allowance for credit losses as % of loan balance 0.7% 0.7% 0.7% 0.9% 1.4% Adjusted allowance for credit losses as % of loan balance (excluding SBLOC & IBLOC) 1 Leasing Real Estate Bridge Lending
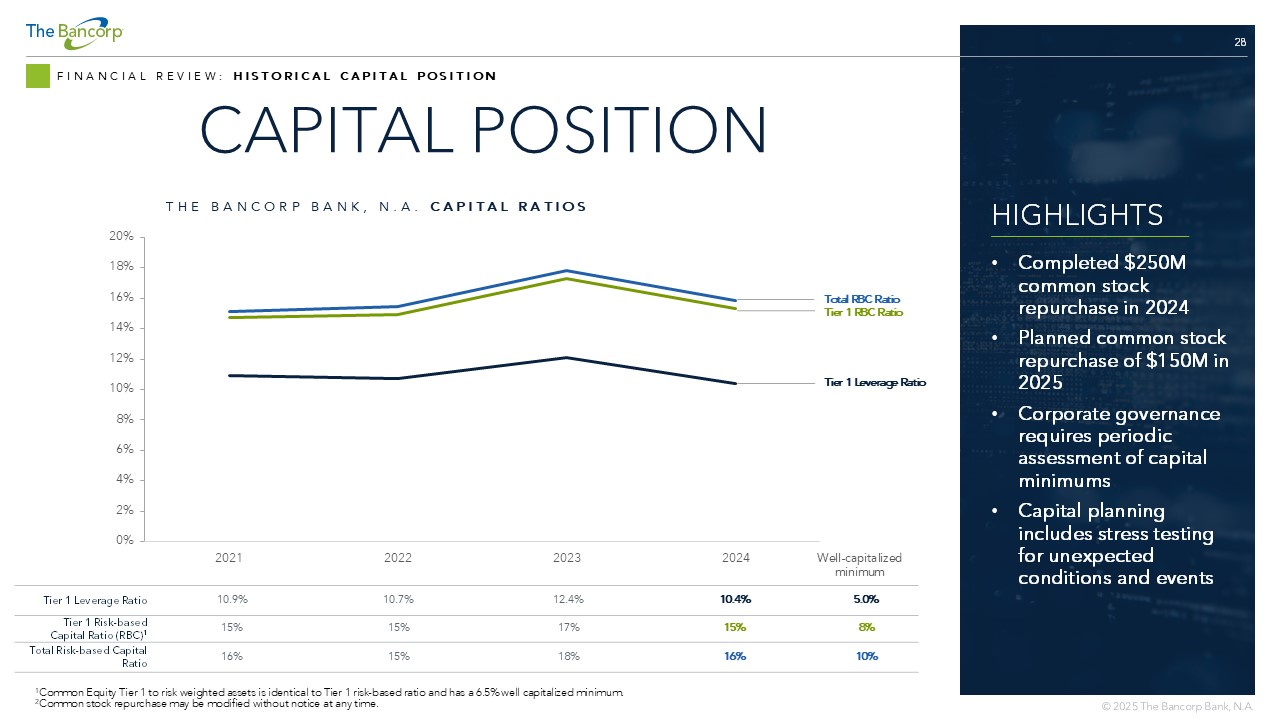
28 FINANCIAL REVIEW: HISTORICAL CAPITAL POSITION CAPITAL POSITION HIGHLIGHTS • Completed $250M common stock repurchase in 2024 • Planned common stock repurchase of $150M in 2025 • Corporate governance requires periodic assessment of capital minimums • Capital planning includes stress testing for unexpected conditions and events 0% 2% 4% 6% 8% 10% 12% 14% 16% 18% 20% 2021 2022 2023 2024 5.0% 10.4% 12.4% 10.7% 10.9% Tier 1 Leverage Ratio 8% 15% 17% 15% 15% Tier 1 Risk - based Capital Ratio (RBC) 1 10% 16% 18% 15% 16% Total Risk - based Capital Ratio Tier 1 RBC Ratio Total RBC Ratio Tier 1 Leverage Ratio THE BANCORP BANK, N.A. CAPITAL RATIOS Well - capitalized minimum 1 Common Equity Tier 1 to risk weighted assets is identical to Tier 1 risk - based ratio and has a 6.5% well capitalized minimum. 2 Common stock repurchase may be modified without notice at any time.
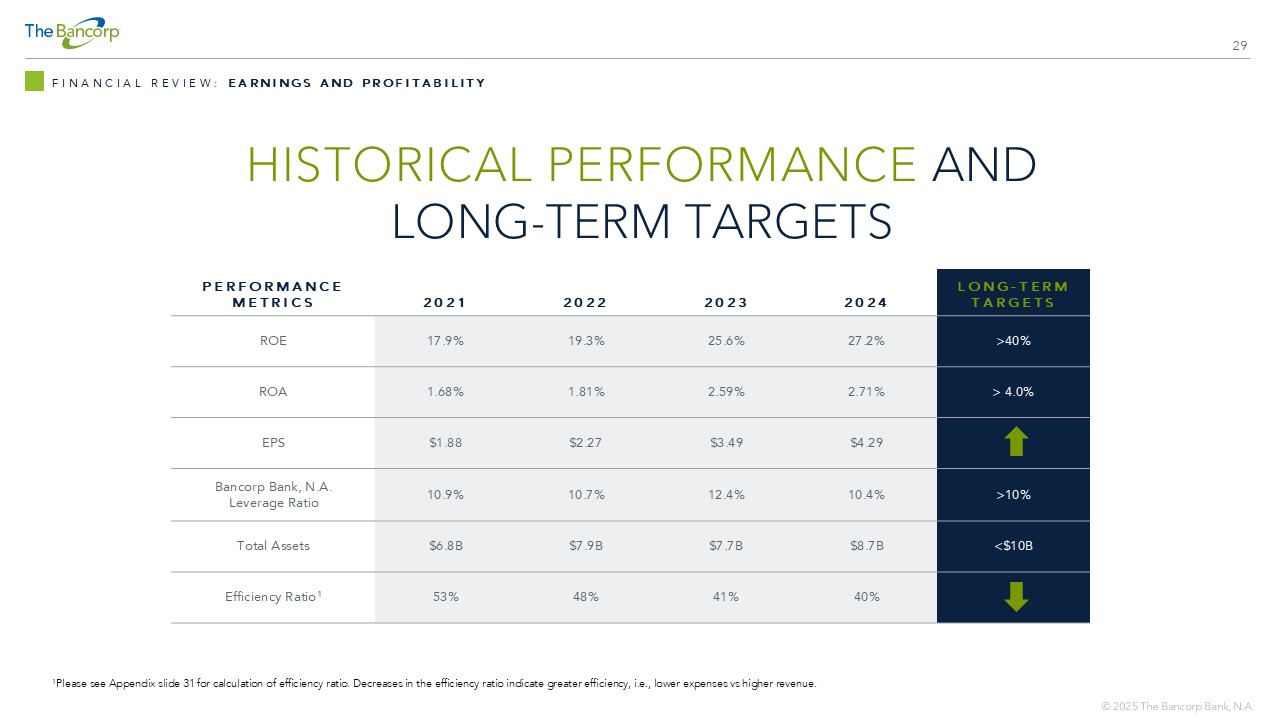
29 HISTORICAL PERFORMANCE AND LONG - TERM TARGETS FINANCIAL REVIEW: EARNINGS AND PROFITABILITY LONG - TERM TARGETS 2024 2023 2022 2021 PERFORMANCE METRICS >40% 27.2% 25.6% 19.3% 17.9% ROE > 4.0% 2.71% 2.59% 1.81% 1.68% ROA $4.29 $3.49 $2.27 $1.88 EPS >10% 10.4% 12.4% 10.7% 10.9% Bancorp Bank, N.A. Leverage Ratio <$10B $8.7B $7.7B $7.9B $6.8B Total Assets 40% 41% 48% 53% Efficiency Ratio 1 1 Please see Appendix slide 31 for calculation of efficiency ratio. Decreases in the efficiency ratio indicate greater efficien cy, i.e., lower expenses vs higher revenue.

APPENDIX
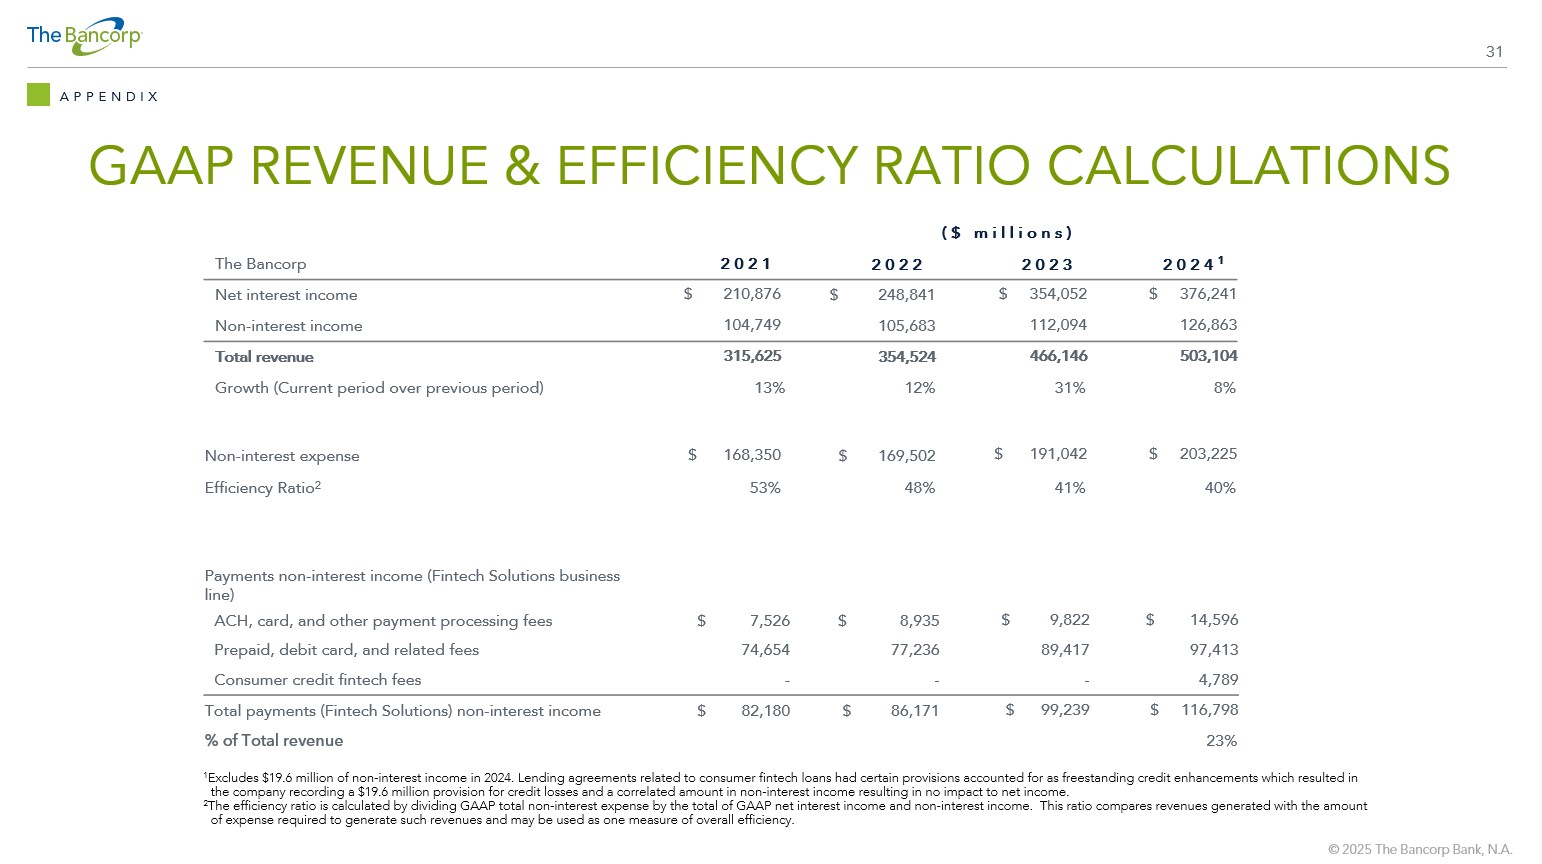
31 GAAP REVENUE & EFFICIENCY RATIO CALCULATIONS APPENDIX ($ millions) 2024 1 2023 2022 2021 The Bancorp $ 376,241 $ 354,052 $ 248,841 $ 210,876 Net interest income 126,863 112,094 105,683 104,749 Non - interest income 503,104 466,146 354,524 315,625 Total revenue 8% 31% 12% 13% Growth (Current period over previous period) $ 203,225 $ 191,042 $ 169,502 $ 168,350 Non - interest expense 40% 41% 48% 53% Efficiency Ratio 2 Payments non - interest income (Fintech Solutions business line) $ 14,596 $ 9,822 $ 8,935 $ 7,526 ACH, card, and other payment processing fees 97,413 89,417 77,236 74,654 Prepaid, debit card, and related fees 4,789 - - - Consumer credit fintech fees $ 116,798 $ 99,239 $ 86,171 $ 82,180 Total payments (Fintech Solutions) non - interest income 23% % of Total revenue 1 Excludes $19.6 million of non - interest income in 2024. Lending agreements related to consumer fintech loans had certain provisio ns accounted for as freestanding credit enhancements which resulted in the company recording a $19.6 million provision for credit losses and a correlated amount in non - interest income resulting in no impact to net income. 2 The efficiency ratio is calculated by dividing GAAP total non - interest expense by the total of GAAP net interest income and non - interest income. This ratio compares revenues generated with the amount of expense required to generate such revenues and may be used as one measure of overall efficiency.
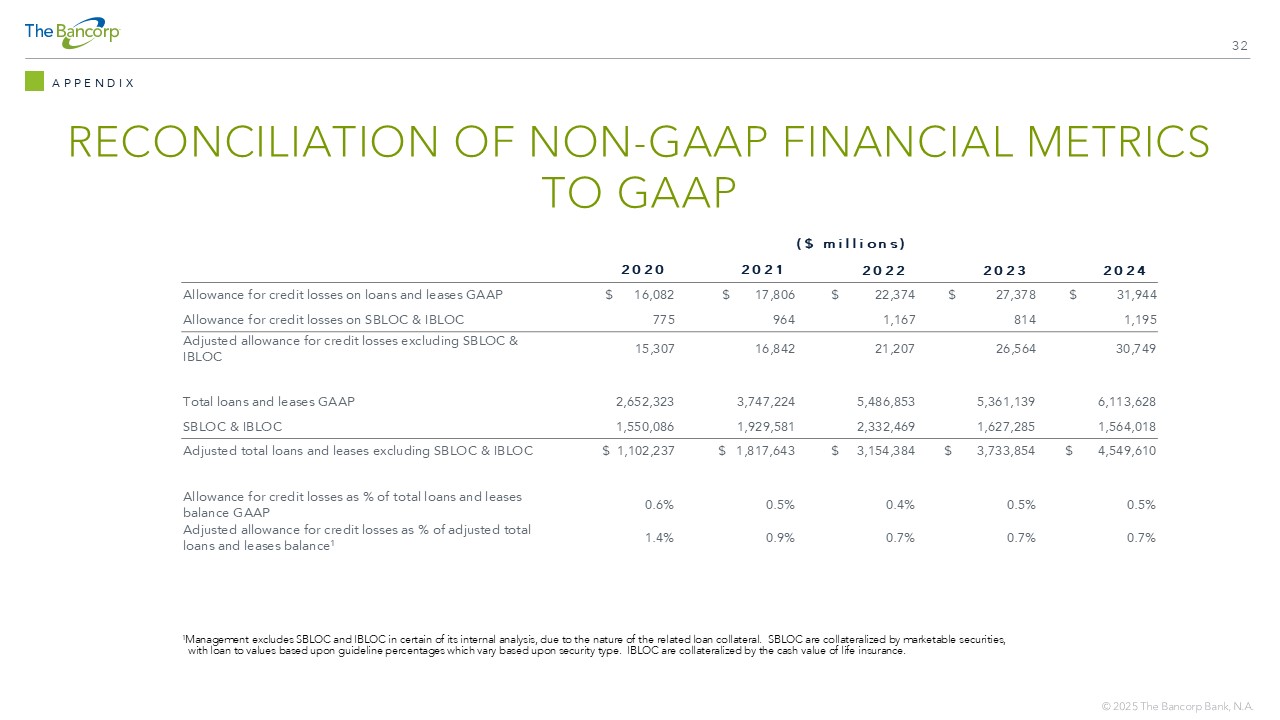
32 RECONCILIATION OF NON - GAAP FINANCIAL METRICS TO GAAP APPENDIX ($ millions) 2024 2023 2022 2021 2020 $ 31,944 $ 27,378 $ 22,374 $ 17,806 $ 16,082 Allowance for credit losses on loans and leases GAAP 1,195 814 1,167 964 775 Allowance for credit losses on SBLOC & IBLOC 30,749 26,564 21,207 16,842 15,307 Adjusted allowance for credit losses excluding SBLOC & IBLOC 6,113,628 5,361,139 5,486,853 3,747,224 2,652,323 Total loans and leases GAAP 1,564,018 1,627,285 2,332,469 1,929,581 1,550,086 SBLOC & IBLOC $ 4,549,610 $ 3,733,854 $ 3,154,384 $ 1,817,643 $ 1,102,237 Adjusted total loans and leases excluding SBLOC & IBLOC 0.5% 0.5% 0.4% 0.5% 0.6% Allowance for credit losses as % of total loans and leases balance GAAP 0.7% 0.7% 0.7% 0.9% 1.4% Adjusted allowance for credit losses as % of adjusted total loans and leases balance 1 1 Management excludes SBLOC and IBLOC in certain of its internal analysis, due to the nature of the related loan collateral. S BLO C are collateralized by marketable securities, with loan to values based upon guideline percentages which vary based upon security type. IBLOC are collateralized by the ca sh value of life insurance.
v3.24.4
| X |
- DefinitionBoolean flag that is true when the XBRL content amends previously-filed or accepted submission.
| Name: |
dei_AmendmentFlag |
| Namespace Prefix: |
dei_ |
| Data Type: |
xbrli:booleanItemType |
| Balance Type: |
na |
| Period Type: |
duration |
|
| X |
- DefinitionFor the EDGAR submission types of Form 8-K: the date of the report, the date of the earliest event reported; for the EDGAR submission types of Form N-1A: the filing date; for all other submission types: the end of the reporting or transition period. The format of the date is YYYY-MM-DD.
| Name: |
dei_DocumentPeriodEndDate |
| Namespace Prefix: |
dei_ |
| Data Type: |
xbrli:dateItemType |
| Balance Type: |
na |
| Period Type: |
duration |
|
| X |
- DefinitionThe type of document being provided (such as 10-K, 10-Q, 485BPOS, etc). The document type is limited to the same value as the supporting SEC submission type, or the word 'Other'.
| Name: |
dei_DocumentType |
| Namespace Prefix: |
dei_ |
| Data Type: |
dei:submissionTypeItemType |
| Balance Type: |
na |
| Period Type: |
duration |
|
| X |
- DefinitionAddress Line 1 such as Attn, Building Name, Street Name
| Name: |
dei_EntityAddressAddressLine1 |
| Namespace Prefix: |
dei_ |
| Data Type: |
xbrli:normalizedStringItemType |
| Balance Type: |
na |
| Period Type: |
duration |
|
| X |
- Definition
+ References
+ Details
| Name: |
dei_EntityAddressCityOrTown |
| Namespace Prefix: |
dei_ |
| Data Type: |
xbrli:normalizedStringItemType |
| Balance Type: |
na |
| Period Type: |
duration |
|
| X |
- DefinitionCode for the postal or zip code
| Name: |
dei_EntityAddressPostalZipCode |
| Namespace Prefix: |
dei_ |
| Data Type: |
xbrli:normalizedStringItemType |
| Balance Type: |
na |
| Period Type: |
duration |
|
| X |
- DefinitionName of the state or province.
| Name: |
dei_EntityAddressStateOrProvince |
| Namespace Prefix: |
dei_ |
| Data Type: |
dei:stateOrProvinceItemType |
| Balance Type: |
na |
| Period Type: |
duration |
|
| X |
- DefinitionA unique 10-digit SEC-issued value to identify entities that have filed disclosures with the SEC. It is commonly abbreviated as CIK. Reference 1: http://www.xbrl.org/2003/role/presentationRef
-Publisher SEC
-Name Exchange Act
-Number 240
-Section 12
-Subsection b-2
| Name: |
dei_EntityCentralIndexKey |
| Namespace Prefix: |
dei_ |
| Data Type: |
dei:centralIndexKeyItemType |
| Balance Type: |
na |
| Period Type: |
duration |
|
| X |
- DefinitionIndicate if registrant meets the emerging growth company criteria. Reference 1: http://www.xbrl.org/2003/role/presentationRef
-Publisher SEC
-Name Exchange Act
-Number 240
-Section 12
-Subsection b-2
| Name: |
dei_EntityEmergingGrowthCompany |
| Namespace Prefix: |
dei_ |
| Data Type: |
xbrli:booleanItemType |
| Balance Type: |
na |
| Period Type: |
duration |
|
| X |
- DefinitionCommission file number. The field allows up to 17 characters. The prefix may contain 1-3 digits, the sequence number may contain 1-8 digits, the optional suffix may contain 1-4 characters, and the fields are separated with a hyphen.
| Name: |
dei_EntityFileNumber |
| Namespace Prefix: |
dei_ |
| Data Type: |
dei:fileNumberItemType |
| Balance Type: |
na |
| Period Type: |
duration |
|
| X |
- DefinitionTwo-character EDGAR code representing the state or country of incorporation.
| Name: |
dei_EntityIncorporationStateCountryCode |
| Namespace Prefix: |
dei_ |
| Data Type: |
dei:edgarStateCountryItemType |
| Balance Type: |
na |
| Period Type: |
duration |
|
| X |
- DefinitionThe exact name of the entity filing the report as specified in its charter, which is required by forms filed with the SEC. Reference 1: http://www.xbrl.org/2003/role/presentationRef
-Publisher SEC
-Name Exchange Act
-Number 240
-Section 12
-Subsection b-2
| Name: |
dei_EntityRegistrantName |
| Namespace Prefix: |
dei_ |
| Data Type: |
xbrli:normalizedStringItemType |
| Balance Type: |
na |
| Period Type: |
duration |
|
| X |
- DefinitionThe Tax Identification Number (TIN), also known as an Employer Identification Number (EIN), is a unique 9-digit value assigned by the IRS. Reference 1: http://www.xbrl.org/2003/role/presentationRef
-Publisher SEC
-Name Exchange Act
-Number 240
-Section 12
-Subsection b-2
| Name: |
dei_EntityTaxIdentificationNumber |
| Namespace Prefix: |
dei_ |
| Data Type: |
dei:employerIdItemType |
| Balance Type: |
na |
| Period Type: |
duration |
|
| X |
- DefinitionLocal phone number for entity.
| Name: |
dei_LocalPhoneNumber |
| Namespace Prefix: |
dei_ |
| Data Type: |
xbrli:normalizedStringItemType |
| Balance Type: |
na |
| Period Type: |
duration |
|
| X |
- DefinitionBoolean flag that is true when the Form 8-K filing is intended to satisfy the filing obligation of the registrant as pre-commencement communications pursuant to Rule 13e-4(c) under the Exchange Act. Reference 1: http://www.xbrl.org/2003/role/presentationRef
-Publisher SEC
-Name Exchange Act
-Number 240
-Section 13e
-Subsection 4c
| Name: |
dei_PreCommencementIssuerTenderOffer |
| Namespace Prefix: |
dei_ |
| Data Type: |
xbrli:booleanItemType |
| Balance Type: |
na |
| Period Type: |
duration |
|
| X |
- DefinitionBoolean flag that is true when the Form 8-K filing is intended to satisfy the filing obligation of the registrant as pre-commencement communications pursuant to Rule 14d-2(b) under the Exchange Act. Reference 1: http://www.xbrl.org/2003/role/presentationRef
-Publisher SEC
-Name Exchange Act
-Number 240
-Section 14d
-Subsection 2b
| Name: |
dei_PreCommencementTenderOffer |
| Namespace Prefix: |
dei_ |
| Data Type: |
xbrli:booleanItemType |
| Balance Type: |
na |
| Period Type: |
duration |
|
| X |
- DefinitionTitle of a 12(b) registered security. Reference 1: http://www.xbrl.org/2003/role/presentationRef
-Publisher SEC
-Name Exchange Act
-Number 240
-Section 12
-Subsection b
| Name: |
dei_Security12bTitle |
| Namespace Prefix: |
dei_ |
| Data Type: |
dei:securityTitleItemType |
| Balance Type: |
na |
| Period Type: |
duration |
|
| X |
- DefinitionName of the Exchange on which a security is registered. Reference 1: http://www.xbrl.org/2003/role/presentationRef
-Publisher SEC
-Name Exchange Act
-Number 240
-Section 12
-Subsection d1-1
| Name: |
dei_SecurityExchangeName |
| Namespace Prefix: |
dei_ |
| Data Type: |
dei:edgarExchangeCodeItemType |
| Balance Type: |
na |
| Period Type: |
duration |
|
| X |
- DefinitionBoolean flag that is true when the Form 8-K filing is intended to satisfy the filing obligation of the registrant as soliciting material pursuant to Rule 14a-12 under the Exchange Act. Reference 1: http://www.xbrl.org/2003/role/presentationRef
-Publisher SEC
-Name Exchange Act
-Number 240
-Section 14a
-Subsection 12
| Name: |
dei_SolicitingMaterial |
| Namespace Prefix: |
dei_ |
| Data Type: |
xbrli:booleanItemType |
| Balance Type: |
na |
| Period Type: |
duration |
|
| X |
- DefinitionTrading symbol of an instrument as listed on an exchange.
| Name: |
dei_TradingSymbol |
| Namespace Prefix: |
dei_ |
| Data Type: |
dei:tradingSymbolItemType |
| Balance Type: |
na |
| Period Type: |
duration |
|
| X |
- DefinitionBoolean flag that is true when the Form 8-K filing is intended to satisfy the filing obligation of the registrant as written communications pursuant to Rule 425 under the Securities Act. Reference 1: http://www.xbrl.org/2003/role/presentationRef
-Publisher SEC
-Name Securities Act
-Number 230
-Section 425
| Name: |
dei_WrittenCommunications |
| Namespace Prefix: |
dei_ |
| Data Type: |
xbrli:booleanItemType |
| Balance Type: |
na |
| Period Type: |
duration |
|
Grafico Azioni Bancorp (NASDAQ:TBBK)
Storico
Da Gen 2025 a Feb 2025

Grafico Azioni Bancorp (NASDAQ:TBBK)
Storico
Da Feb 2024 a Feb 2025

