REPEAT: Treasury Metals' Preliminary Economic Assessment Confirms Potential Economic Viability for Goliath Gold Project
14 Luglio 2010 - 1:01PM
Marketwired Canada
Treasury Metals Inc. ("Treasury" or the "Company") (TSX:TML) is pleased to
announce the results of a National Instrument 43-101 ("NI 43-101") compliant
Preliminary Economic Assessment ("PEA") on its wholly-owned Goliath Gold Project
located about 20 kilometres east of the City of Dryden, Ontario. The PEA was
completed by independent consultant A.C.A. Howe International Limited ("Howe").


Scott Jobin-Bevans, Treasury's President and CEO, commented, "I am very pleased
that Howe has validated the Project and our exploration efforts to date. This
initial analysis of the Thunder Lake gold deposit, which only contemplates about
50% of the current contained ounces, already demonstrates its economic potential
and provides us with the parameters necessary to develop the Project and
increase its economic profile." He added, "In anticipation of the positive
results from this study, we began targeted infill drilling during the recent
drilling program in order to upgrade the inferred resources to the indicated
category. Our focus will now turn to implementing the recommendations contained
in the PEA in an effort to move the Project towards development and ultimately
into production."


Goliath Gold PEA Highlights


- Howe concludes that the Project has potential economic viability under
  base case assumptions.

- Surface and underground mining operations with stand-alone
  gravity/flotation milling complex.

- Approximately 390,000 ounces Au recovered over 8 1/2 years at a production
  rate of 1,500 tonnes per day; average annual recovery of 48,000 ounces Au.

- At US$850 per oz (base case gold spot price): after-tax NPV@5% of $23
  million and IRR of 15%.

- At US$1,200 per oz (current gold spot price): after-tax NPV@5% of $91
  million and IRR of 43%.

- Estimated initial capital expenditure of $76 million; Life of Mine capital
  expenditure of $117 million; and, payback period of 4 years at US$850 per
  ounce gold, or 2 1/2 years at US$1,200 per ounce gold.


Howe concludes that Treasury should continue to advance the Project toward
Pre-Feasibility, recommending:


- Infill drilling to upgrade Inferred Resources to Indicated Resources,
  aimed at increasing total gold ounces to be considered in future
  economic/production models.

- Collect material for further metallurgical test work to include gravity,
  flotation and cyanidation mineral processing, optimised to confirm
  recoveries used in the economic model.

- Collect geotechnical information to be used for surface and underground
  mine planning.

- Optimization of economic model by investigating purchase of a used mill
  instead of construction of new mill.

- Initiation of Environmental Baseline studies as soon as possible.


Dr. Jobin-Bevans continued, "Drill results to date have been consistent in
substantiating the potential of the deposit and our plan is to further evaluate
and develop the known gold resources on the Goliath Gold project. In addition to
the recommendations outlined in the PEA, we will work to expand the surface and
underground resources along strike to the west and northeast of the deposit
where we have seen excellent historical high-grade intercepts. We will also
continue to target the potential high-grade underground resources below 800
metres depth where our recent drilling has shown excellent potential."
Commenting on the region, he added, "We have long believed in the potential of
the Kenora Gold District and we look forward to potentially building a mill and
mine in the area as we also work towards realizing the benefits of consolidating
this extensive and prospective gold region in northwestern Ontario."


Economic Sensitivity

The base case considers the development of surface and underground mining
operations on the Thunder Lake gold deposit and a stand-alone gravity/flotation
milling complex at the Goliath Gold Project. Howe concludes that under base case
assumptions of 1,500 tonnes per day production and US$850 per ounce gold, and
assuming 100% equity financing and an even exchange rate against the US$, the
Project has potential economic viability with an after-tax Internal Rate of
Return ("IRR") of 15%, a 5% discounted Net Present Value ("NPV") of $23 million
and an estimated payback period of four years.


The following table summarizes the results of the PEA, assuming a production
rate of 1,500 tonnes per day:


----------------------------------------------------------------------------
     Gold Price    NPV (0%)(i)       NPV (5%)      NPV (10%)
       (US$/oz)        (CDN$M)        (CDN$M)        (CDN$M)            IRR
----------------------------------------------------------------------------
           $850            $43            $23            $10             15%
----------------------------------------------------------------------------
         $1,000            $81            $52            $33             28%
----------------------------------------------------------------------------
         $1,200           $132            $91            $63             43%
----------------------------------------------------------------------------
         $1,400           $182           $129            $93             57%
----------------------------------------------------------------------------
(i) Equivalent to cumulative after-tax profit.


The PEA is an estimate of the economic viability of the Project and does not
contemplate the full spectrum of engineering and regulatory factors, which would
be required prior to making a production decision. All amounts are in Canadian
Dollars except the gold price, which is quoted in US dollars.


Mineral Resource Estimate - Updated

The PEA also includes an updated Mineral Resource Estimate ("Resource Estimate")
for the Thunder Lake gold deposit, based on diamond drilling completed as at
December 2009. This Resource Estimate does not take into account the results
from the +10,000 metres completed in 2010 and does not incorporate potential
metal credits from silver and by-product metals of lead, zinc and copper; these
metals are also not included in the current PEA.


Resources were defined using a block cut-off grade of 0.5 g/t Au for surface
resources (less than 100 metres deep) and 2.0 g/t Au for underground resources
(greater than 100 metres deep). Surface plus underground Indicated Resources
total 3.4 million tonnes with an average grade of 2.5 g/t Au, for 270,000
ounces. Surface plus underground Inferred Resources total 10.6 million tonnes
with an average grade of 2.7 g/t Au, for 930,000 ounces. The Main Zone contained
the majority of resources from both categories and is the primary target for
underground mining. A summary of mineral resources by resource category is as
follows:


----------------------------------------------------------------------------
                 Block Cut-off
                         Grade  Tonnes Above  Average Au Grade  Contained Au
Category             (g/tonne)       Cut-off         (g/tonne)      (ounces)
----------------------------------------------------------------------------
Indicated
----------------------------------------------------------------------------
Surface                    0.5     2,900,000               1.9       180,000
----------------------------------------------------------------------------
Underground                2.0       490,000               5.7        90,000
----------------------------------------------------------------------------
Subtotal,
 Indicated                         3,400,000               2.5       270,000
----------------------------------------------------------------------------

----------------------------------------------------------------------------
Inferred
----------------------------------------------------------------------------
Surface                    0.5     5,400,000               1.1       190,000
----------------------------------------------------------------------------
Underground                2.0     5,200,000               4.4       740,000
----------------------------------------------------------------------------
Subtotal,
 Inferred                         10,600,000               2.7       930,000
----------------------------------------------------------------------------

----------------------------------------------------------------------------
                     Average Ag     Average Cu     Average Pb     Average Zn
Category        Grade (g/tonne)    Grade (ppm)    Grade (ppm)    Grade (ppm)
----------------------------------------------------------------------------
Indicated
----------------------------------------------------------------------------
Surface                     5.4             86            820          1,700
----------------------------------------------------------------------------
Underground                13.8            100            710          1,500
----------------------------------------------------------------------------
Subtotal,
 Indicated                  6.6             88            800          1,670
----------------------------------------------------------------------------

----------------------------------------------------------------------------
Inferred
----------------------------------------------------------------------------
Surface                     2.5             72            360            880
----------------------------------------------------------------------------
Underground                14.7             90            630          1,220
----------------------------------------------------------------------------
Subtotal,
 Inferred                   8.5             81            490          1,050
----------------------------------------------------------------------------
Notes:

1.  Cut-off grade for mineralised zone interpretation was 0.5 g/tonne.
2.  Block cut-off grade for surface resources (less than 100 metres deep)
    was 0.5 g/tonne.
3.  Block cut-off grade for underground resources (more than 100 metres
    deep) was 2 g/tonne.
4.  Gold price was US$850 per troy ounce.
5.  Zones extended up to 150 metres down-dip from last intercept. Along
    strike, zones extended halfway to the next cross-section.
6.  Minimum width was 2 metres.
7.  Non-diluted resources.
8.  Mineral resources that are not mineral reserves do not have demonstrated
    economic viability.
9.  A specific gravity (bulk density) value of 2.78 was applied to all
    blocks (based on 30 samples).
10. Un-cut. Top-cut analysis of sample data suggested no top cut was needed
    and removal of high grade outliers would not materially affect the
    global block model grade.


The Resource Estimate, which uses a combination of historical and current
drilling results, includes 41 additional holes up to drill hole TL09-86, drilled
in late 2009 with results reported in early 2010. The Resource Estimate was
prepared by Doug Roy, M.A.Sc., P.Eng., Associate Mining Engineer with Howe.


Qualified Person

Technical information related to the PEA contained in this news release has been
reviewed and approved by Doug Roy, an independent Qualified Person as defined by
NI 43-101, with the ability and authority to verify the authenticity and
validity of this data. The report titled "Technical Report and Preliminary
Economic Assessment on the Goliath Gold Project", with an effective date of July
9th, 2010 has been prepared by Doug Roy, Patrick Hannon, Ed Thornton and Ian D.
Trinder of A.C.A. Howe International Limited.


About Treasury Metals

Treasury Metals Inc. is a Canadian mining company that is focussed on expanding
the Company's gold resources and developing its 100% owned flagship Goliath Gold
Project located in the Kenora Gold District of northwestern Ontario. Treasury
Metals obtains significant royalty revenue from an NSR on Goldgroup Mining
Inc.'s Cerro Colorado Mine located in Mexico.


For additional information on Treasury Metals and its projects, including
updated technical information as it pertains to this news release, please visit
the Company's website at www.treasurymetals.com.


Forward-looking Statements

Securities regulators encourage companies to disclose forward-looking
information to help investors understand a company's future prospects. This
press release contains statements about our future financial condition, results
of operations and business. These are "forward-looking" because we have used
what we know and expect today to make a statement about the future.
Forward-looking statements usually include words such as may, expect,
anticipate, believe or other similar words. We believe the expectations
reflected in these forward-looking statements are reasonable. However, actual
events and results could be substantially different because of the risks and
uncertainties associated with our business or events that happen after the date
of this press release. You should not place undue reliance on forward-looking
statements. As a general policy, we do not update forward-looking statements
except as required by securities laws and regulations.
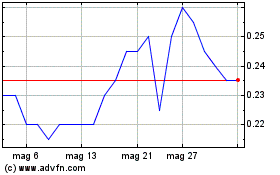
Grafico Azioni Treasury Metals (TSX:TML)
Storico
Da Giu 2024 a Lug 2024

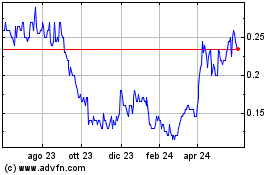
Grafico Azioni Treasury Metals (TSX:TML)
Storico
Da Lug 2023 a Lug 2024
