Analyst Points To Key Bitcoin Metric Indicating A Strong Uptrend—$90K in Sight?
19 Ottobre 2024 - 6:00AM
NEWSBTC
Bitcoin (BTC) has been on an upward trend in recent weeks, showing
positive price movements that appear quite appealing to investors.
According to a recent CryptoQuant analysis, a key metric,
“active address momentum,” paints a bullish picture for the
cryptocurrency. Related Reading: Bitcoin’s Bull Rally Hinges On
$57K Support Level—Here’s Why It Matters Active Address Momentum
Signals Upward Market Structure Active addresses represent the
number of unique addresses conducting transactions on the Bitcoin
network, providing insights into network activity and investor
engagement. By applying a 30-day moving average (30DMA) and a
365-day moving average (365DMA) to this indicator, the CryptoQuant
analyst could assess the network’s growing momentum. The
analyst emphasized that the 30DMA has sharply risen recently and is
closing in on the 365DMA. If a “golden cross” occurs, where the
30DMA surpasses the 365DMA, it could signal a further bullish trend
for Bitcoin, dent reveals. The CryptoQuant analyst added that
Bitcoin has seen high transaction volumes since the second half of
the year, supporting increased network activity. While the current
upward momentum is encouraging, the analyst also warned of
potential volatility due to a “rising wedge” formation in Bitcoin’s
price chart—a pattern that could lead to significant price swings
if the wedge continues to tighten. Bitcoin Rally To $90,000 In
Sight? Bitcoin’s recent price performance has added to the optimism
among investors. Over the past week, the cryptocurrency has surged
by over 10%, and it has continued its upward trajectory, rising by
an additional 1.98% in the past 24 hours to trade at $68,708 at the
time of writing. This upward movement has helped Bitcoin break
through a major resistance zone on its daily chart, sparking
predictions of even higher prices. One notable prediction came from
crypto analyst Javon Marks, who recently shared his outlook on X.
Marks highlighted that Bitcoin has broken out of a “descending
broadening wedge” pattern. Statistically, this pattern suggests
that when the resisting line is broken, the price objective is
reached in 81% of cases. Related Reading: Massive Bitcoin Move
Imminent: 7 Key Reasons Behind The Bullish Outlook In Bitcoin’s
case, Marks believes that this breakout could push the price of
Bitcoin to a range between $90,000 and even more than $96,000.
#Bitcoin (BTC) is now broken out of the displayed ‘descending
broadening wedge’ pattern and statistics from this type of pattern
states that in 81% of cases, the pattern’s price objective is
reached when the resisting line is broken. Bitcoin’s Price
Objective: $90,000-$96,000+ https://t.co/lPZZtJm7pi
pic.twitter.com/hudApLSlDj — JAVON⚡️MARKS (@JavonTM1) October 17,
2024 Featured image created with DALL-E, Chart from TradingView
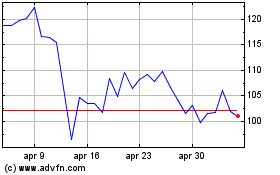
Grafico Azioni Quant (COIN:QNTUSD)
Storico
Da Set 2024 a Ott 2024

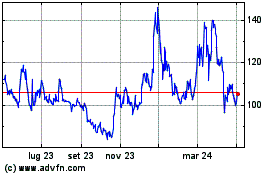
Grafico Azioni Quant (COIN:QNTUSD)
Storico
Da Ott 2023 a Ott 2024
