Analysts Debate Bitcoin’s Next Move As BTC Hits $75K All-Time High
07 Novembre 2024 - 9:00AM
NEWSBTC
Bitcoin has experienced a notable surge in price, reaching an
all-time high of $75,358 following the announcement that former US
President Donald Trump has been reelected, becoming the 47th
President of the United States. So far, the asset’s value has seen
a nearly 10% spike in the past day before experiencing a slight
correction, trading at $74,037 at the time of writing—a decline of
approximately 1.1% from its peak earlier today. The dramatic price
increase has prompted widespread discussion within the
cryptocurrency community, with prominent analysts offering their
insights on the next move of Bitcoin. Related Reading: Bitcoin
Price Touches $75,000 ATH: Analyst Says This Is What You Should
Expect Next Is The Top In For Bitcoin? CryptoBullet, a well-known
market analyst on X, focused on Bitcoin’s dominance index (BTC.D)
about a technical indicator called the TD Sequential. In a recent
post on X, the analyst wrote, “Is BTC Dominance finally topping
out? BTC.D is printing the second TD-9 Sell on the 2W timeframe
this cycle.” The TD Sequential is a technical analysis tool used to
identify potential trend reversals. According to CryptoBullet, the
current cycle shows similarities to previous years, where a second
TD-9 signal often marks a significant reversal. He highlighted past
patterns from 2018, 2019, and 2021, suggesting that a similar trend
could unfold in 2024, with Bitcoin dominance potentially nearing
its peak. Is #BTC #Dominance finally topping out? 🤔$BTC.D is
printing the second TD-9 Sell on the 2W timeframe this cycle 👀 IMO
this is something worth paying close attention to. 💡 We can see the
same pattern repeating itself over and over again: no matter which
direction #BTC… pic.twitter.com/j7Y3kGaQXJ — CryptoBullet
(@CryptoBullet1) November 6, 2024 More Room For Rally? Adding to
the conversation, another analyst, Ali, shared his perspective on
X, cautioning market participants. Ali noted that the TD Sequential
recently flashed a sell signal on Bitcoin’s four-hour chart,
indicating a possible pullback to $72,000. However, he noted that a
sustained close above $75,400 could negate this bearish outlook and
potentially push Bitcoin’s price to a new high of $78,000. If
you’re late to the bull party, take caution: the TD Sequential just
flashed a sell signal on the #Bitcoin $BTC 4-hour chart, hinting at
a possible pullback to $72,000. However, a sustained close above
$75,400 would invalidate this bearish setup and trigger an upswing
to… pic.twitter.com/Ljd8lyPsM4 — Ali (@ali_charts) November 6, 2024
Meanwhile, a CryptoQuant analyst known as MAC.D offered a broader
perspective on Bitcoin’s market cycle using the MVRV (Market Value
to Realized Value) ratio. This on-chain metric measures whether
Bitcoin is undervalued or overvalued relative to its historical
price levels. According to MAC.D, the MVRV ratio suggests that
Bitcoin has not yet reached an “overheating stage,” indicating
further upside potential. Related Reading: Analyst Reveals
Bitcoin’s ‘Chopsolidation’ Phase Nears End—Are New Highs in Sight?
However, as the market matures and capitalization grows, Mac noted
that the rate of price increase tends to slow down. Adding: “Using
this as a trend line, we can expect the market to overheat when the
MVRV value is around 3.” Featured image created with DALL-E, Chart
from TradingView
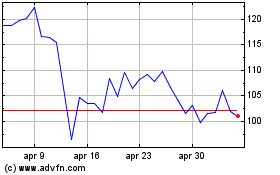
Grafico Azioni Quant (COIN:QNTUSD)
Storico
Da Dic 2024 a Gen 2025

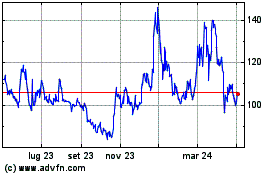
Grafico Azioni Quant (COIN:QNTUSD)
Storico
Da Gen 2024 a Gen 2025
