Canadian Dollar Slides As Crude Oil Prices Drop
15 Novembre 2024 - 5:06AM
RTTF2
The Canadian dollar weakened against other major currencies in
the European session on Friday, as crude oil prices declined amid
worries about oversupply by growing U.S. crude stocks.
Data from the Energy Information Administration (EIA) showed
crude oil inventories in the U.S. climbed by 2.1 million barrels
last week, matching the increase seen in the previous week.
Economists had expected crude oil inventories to edge up by 1
million barrels.
Brent crude futures were down 24 cents, or 0.3% at $72.04 a
barrel. U.S. West Texas Intermediate crude futures (WTI) were down
27 cents, or 0.4% at $68.15.
Meanwhile, the report said gasoline inventories tumbled by 4.4
million barrels last week and are about 4% below the five-year
average for this time of year.
The International Energy Agency's monthly oil market report
released on Thursday predicts a significant discrepancy between
global oil demand and supply by 2025.
According to IEA, the world's demand for oil will fall short of
supply by more than 1 million barrels per day (bpd) in 2025 even if
OPEC+ cuts remain in place.
European stocks traded lower after Federal Reserve Chair Jerome
Powell signaled a cautious approach on rate cuts, given persistent
inflationary pressures.
Trading later in the day may be impacted by reaction to the
latest U.S. economic data, including reports on retail sales and
industrial production.
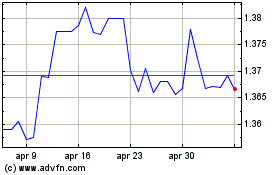
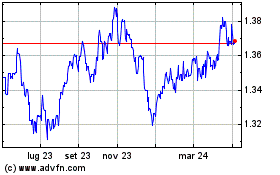
In the European trading today, the Canadian dollar fell to a
4-1/2-year low of 1.4070 against the U.S. dollar, from an early
high of 1.4052. The loonie may test support near the 1.41
region.
Against the euro and the yen, the loonie slid to 2-day lows of
1.4848 and 110.73 from early highs of 1.4804 and 111.44,
respectively. If the loonie extends its downtrend, it is likely to
find support around 1.51 against the euro and 109.00 against the
yen.
The loonie edged down to 0.9095 against the Australian dollar,
from an early high of 0.9068. On the downside, 0.92 is seen as the
next support level for the loonie.
Looking ahead, Canada manufacturing sales, new motor vehicle
sales and wholesale sales data, all for September, U.S. retail
sales data for October, import and export prices for October, U.S.
NY Empire State manufacturing index for November, U.S. industrial
and manufacturing production for October, business inventories for
September and U.S. Baker Hughes oil rig count data are slated for
release in the New York session.
Grafico Cross US Dollar vs CAD (FX:USDCAD)
Da Ott 2024 a Nov 2024

Grafico Cross US Dollar vs CAD (FX:USDCAD)
Da Nov 2023 a Nov 2024
