Bitcoin (BTC) Price Ahead Of Monthly Close, Go Big Or Go Home
30 Settembre 2022 - 3:50AM
NEWSBTC
BTC price trades below 50 and 200 EMA on the daily timeframe
despite showing some relief strength. BTC rally caught short
as price continued to range. The price of BTC must close above
$21,500 ahead of the monthly close as bulls sweat over price
movement. The price of Bitcoin showed strength as Bitcoin
(BTC) bounced from its weekly low of $18,500 after the increase in
interest rate affected its price negatively. The price of Bitcoin
has since struggled to regain its bullish run. It has to a region
of $25,000 with the monthly candle just a few hours away from
closing. Many traders and investors hope for a better month ahead
as the BTC movement has seen little to no volume for a long time.
(Data from Binance) Related Reading: Why Most Public Bitcoin Miners
Have Performed Terribly In Their Lifetimes Bitcoin (BTC) Price
Analysis On The Monthly Chart On the monthly chart, the price of
BTC has seen more downside than upside, falling from a region of
$69,500 to a current value of $19,450, where the price is
struggling to close the month on a positive note. BTC’s price needs
to close above $21,500 to begin a small relief rally, as it has
continued to trade at its previous all-time high and has tested the
region numerous times, with the area acting as support looking
weaker with each retest. BTC must break and hold above the $21,500
resistance with good volume in order to restore a relief bounce. If
the price of BTC remains in this current structure and refuses to
break higher, we could see it retest $17,500 support and possibly a
lower support area of $17,000 on the Monthly chart if there is a
sell-off. Monthly resistance for the price of BTC – $21,500.
Monthly support for the price of BTC – $18,000. Price Analysis Of
BTC On The Daily (1D) Chart In the daily timeframe, the price of
BTC continues to trade below key resistance as the price remains in
a range to break above to higher heights. The price of BTC on
the daily chart showed strength to break out above $20,500 as the
price faces rejection in an attempt to break out of its range-bound
movement. The price of BTC trades at $19,460 below the 50 and
200 Exponential Moving Average (EMA). The prices of $20,500 and
$28,000 correspond to the prices at 50 and 200 EMA for BTC on the
daily timeframe. BTC needs to break and close above $20,500
for the price to gain momentum as the current price action hasn’t
been favorable for BTC’s price. Daily resistance for the BTC
price – $20,500. Daily support for the BTC price – $18,000. Related
Reading: ApeCoin Performance Could Attract The Whales – How About
The Bulls? Featured Image From Dictionary, Charts From Tradingview
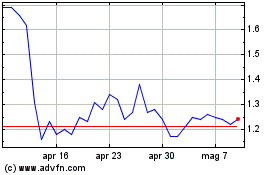
Grafico Azioni ApeCoin (COIN:APEUSD)
Storico
Da Nov 2024 a Dic 2024

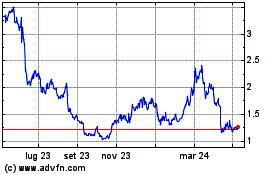
Grafico Azioni ApeCoin (COIN:APEUSD)
Storico
Da Dic 2023 a Dic 2024
