SECURITIES AND EXCHANGE COMMISSION
WASHINGTON, D.C. 20549
FORM 10-K
FOR ANNUAL AND TRANSITION REPORTS
PURSUANT TO SECTION 13 OR 15(d) THE SECURITIES
EXCHANGE ACT OF 1934
(Mark One)
☒ ANNUAL REPORT PURSUANT TO SECTION 13 OR 15(d) OF THE SECURITIES
EXCHANGE ACT OF 1934
For the fiscal year ended December 31, 2024
OR
☐ TRANSITION REPORT PURSUANT TO SECTION
13 OR 15(d) OF THE SECURITIES EXCHANGE ACT OF 1934
For the transition period from ____________ to
___________
Commission File Number 001-10435
STURM, RUGER & COMPANY, INC.
(Exact Name of Registrant as Specified in Its
Charter)
| Delaware | 06-0633559 |
(State or Other Jurisdiction of
Incorporation or Organization) | (I.R.S. Employer
Identification No.) |
| 1 Lacey Place, Southport, Connecticut | 06890 |
| (Address of Principal Executive Offices) | (Zip Code) |
(203) 259-7843
(Registrant’s telephone number, including
area code)
Securities registered pursuant to Section
12(b) of the Act:
| Title of Each Class | Trading Symbol(s) | Name of Each Exchange on Which Registered |
| Common Stock, $1 par value | RGR | New York Stock Exchange |
Securities registered pursuant to Section 12(g)
of the Act:
None
(Title of Class)
Indicate by check mark if the registrant is a well-known seasoned
issuer, as defined in Rule 405 of the Securities Act. YES ☒ NO ☐
Indicate by check mark if the registrant is not required to file reports
pursuant to Section 13 or Section 15(d) of the Act. YES ☐ NO ☒
Indicate
by check mark whether registrant (1) has filed all reports required to be filed by Section 13 or Section 15(d) of the Securities Exchange
Act of 1934 during the preceding 12 months (or shorter such period of time that the registrant was required to file such reports), and
(2) has been subject to such filing requirements for the past 90 days. YES ☒ NO ☐
Indicate by check mark whether the registrant
has submitted electronically every Interactive Data File required to be submitted pursuant to Rule 405 of Regulation S-T (§ 232.405
of this chapter) during the preceding 12 months (or for such shorter period that the registrant was required to submit such files). YES ☒ NO ☐
Indicate by check mark whether the registrant
is a large accelerated filer, an accelerated filer, a non-accelerated filer, a smaller reporting company, or an emerging growth company.
See definition of “accelerated filer,” “large accelerated filer,” “smaller reporting company,” and
“emerging growth company” in Rule 12b-2 of the Exchange Act. Large accelerated filer ☒ Accelerated filer ☐
Non-accelerated filer ☐ Smaller reporting company ☐ Emerging growth company ☐
If an emerging growth company, indicate by check
mark if the registrant has elected not to use the extended transition period for complying with any new or revised financial accounting
standards provided pursuant to Section 13(a) of the Exchange Act. ☐
Indicate by check mark whether the registrant
has filed a report on and attestation to its management’s assessment of the effectiveness of its internal control over financial
reporting under Section 404(b) of the Sarbanes-Oxley Act (15 U.S.C 7262(b)) by the registered public accounting firm that prepared or
issued its audit report. ☒
If securities are registered pursuant to Section
12(b) of the Act, indicate by check mark whether the financial statements of the registrant included in the filing reflect the correction
of an error to previously issued financial statements. YES ☐ NO ☒
Indicate by check mark whether any of those error
corrections are restatements that required a recovery analysis of incentive-based compensation received by any of the registrant’s
executive officers during the relevant recovery period pursuant to §240.10D-1(b). ☐
Indicate
by check mark whether the registrant is a shell company (as defined in Rule 12b-2 of the Exchange Act). YES ☐ NO ☒
The aggregate market value of the voting and non-voting
common equity held by non-affiliates of the registrant computed by reference to the price at which the common equity was last sold, or
the average bid and asked price of such common equity, as of June 30, 2024:
Common Stock, $1 par value - $771,970,000
The number of shares outstanding of the registrant's
common stock as of February 10, 2025: Common Stock, $1 par value –16,762,100, shares
DOCUMENTS INCORPORATED BY REFERENCE.
Portions of the registrant’s Proxy Statement
relating to the 2025 Annual Meeting of Stockholders to be held May 29, 2025 are incorporated by reference into Part III (Items 10 through
14) of this Report.
TABLE OF CONTENTS
EXPLANATORY NOTE:
In this Annual Report on Form 10-K, Sturm, Ruger
& Company, Inc. and Subsidiaries (the “Company”) makes forward-looking statements and projections concerning future expectations.
Such statements are based on current expectations and are subject to certain qualifying risks and uncertainties, such as market demand,
sales levels of firearms, anticipated castings sales and earnings, the need for external financing for operations or capital expenditures,
the results of pending litigation against the Company, the impact of future firearms control and environmental legislation, and accounting
estimates, any one or more of which could cause actual results to differ materially from those projected. Words such as “expect,”
“believe,” “anticipate,” “intend,” “estimate,” “will,” “should,”
“could” and other words and terms of similar meaning, typically identify such forward-looking statements. Readers are cautioned
not to place undue reliance on these forward-looking statements, which speak only as of the date made. The Company undertakes no obligation
to publish revised forward-looking statements to reflect events or circumstances after the date such forward-looking statements are made
or to reflect the occurrence of subsequent unanticipated events.
PART I
ITEM 1—BUSINESS
Company Overview
Sturm, Ruger & Company, Inc. and Subsidiaries
(the “Company”) is principally engaged in the design, manufacture, and sale of firearms to domestic customers. Virtually all
of the Company’s sales for the year ended December 31, 2024 were from the firearms segment, with less than 1% from the castings
segment. Export sales represent approximately 5% of firearms sales. The Company’s design and manufacturing operations are located
in the United States and almost all product content is domestic.
The Company has been in business since 1949 and
was incorporated in its present form under the laws of Delaware in 1969. The Company primarily offers products in three industry product
categories – rifles, pistols, and revolvers. The Company’s firearms are sold through independent wholesale distributors, principally
to the commercial sporting market.
The Company manufactures and sells investment
castings made from steel alloys and metal injection molding (“MIM”) parts for internal use in the firearms segment and has
minimal sales to outside customers. The castings and MIM parts are sold to outside customers, either directly or through manufacturers’
representatives.
For the years ended December 31, 2024, 2023, and
2022, net sales attributable to the Company's firearms operations were $533.6 million, $540.7 million and $593.3 million. The balance
of the Company's net sales for the aforementioned periods was attributable to its castings operations.
Firearms Products
The Company presently manufactures firearm products,
under the “Ruger” name and trademark, in the following industry categories:
| Rifles |
|
Revolvers |
| ● |
Single-shot |
● |
Single-action |
| ● |
Autoloading |
● |
Double-action |
| ● |
Bolt-action |
|
|
| ● |
Modern sporting |
|
|
| |
|
|
|
| Pistols |
|
|
|
| ● |
Rimfire autoloading |
|
|
| ● |
Centerfire autoloading |
|
|
In addition, the Company manufactures lever-action
rifles under the “Marlin” name and trademark.
Most firearms are available in several models
based upon caliber, finish, barrel length, and other features.
Rifles
A rifle is a long gun with spiral grooves cut
into the interior of the barrel to give the bullet a stabilizing spin after it leaves the barrel. Net sales of rifles by the Company accounted
for $310.2 million, $306.8 million, and $305.4 million of total net sales for the years 2024, 2023, and 2022, respectively.
Pistols
A pistol is a handgun in which the ammunition
chamber is an integral part of the barrel and which typically is fed ammunition from a magazine contained in the grip. Net sales of pistols
by the Company accounted for $135.3 million, $131.4 million, and $184.7 million of revenues for the years 2024, 2023, and 2022, respectively.
Revolvers
A revolver is a handgun that has a cylinder that
holds the ammunition in a series of chambers which are successively aligned with the barrel of the gun during each firing cycle. There
are two general types of revolvers, single-action and double-action. To fire a single-action revolver, the hammer is pulled back to cock
the gun and align the cylinder before the trigger is pulled. To fire a double-action revolver, a single trigger pull advances the cylinder
and cocks and releases the hammer. Net sales of revolvers by the Company accounted for $54.8 million, $72.5 million, and $70.0 million
of revenues for the years 2024, 2023, and 2022, respectively.
Accessories
The Company also manufactures and sells accessories
and replacement parts for its firearms. These sales accounted for $33.3 million, $30.0 million, and $33.2 million of total net sales for
the years 2024, 2023, and 2022, respectively.
Castings Products
Net sales attributable to the Company’s
casting operations (excluding intercompany transactions) accounted for $3.0 million, $3.0 million, and $2.6 million, for 2024, 2023, and
2022, respectively. These sales represented less than 1% of total net sales in each year.
Manufacturing
Firearms
The Company produces some of its pistol models,
most of its revolvers, and some of its rifle models at the Newport, New Hampshire facility. One model of revolver, one model of rifle,
and most of the Company’s pistols are produced at the Prescott, Arizona facility. Some rifle models and pistol models are produced
at the Mayodan, North Carolina facility.
Many of the basic metal component parts of the
firearms manufactured by the Company are produced by the Company's castings segment through precision investment casting and metal injection
molding. See "Manufacturing- Investment Castings and Metal Injected Moldings" below for a description of these processes. The
Company believes that investment castings and MIM parts provide greater design flexibility and result in component parts which are generally
close to their ultimate shape and, therefore, require less machining than processes requiring machining a
solid billet of metal to obtain
a part. Through the use of investment castings and MIM parts, the Company endeavors to produce durable and less costly component parts
for its firearms.
All assembly, inspection, and testing of firearms
manufactured by the Company are performed at the Company's manufacturing facilities. Every firearm, including every chamber of every revolver
manufactured by the Company, is test-fired prior to shipment.
Investment Castings and Metal Injection Moldings
To produce a product by the investment casting
method, a wax model of the part is created and coated (“invested”) with several layers of ceramic material. The shell is then
heated to melt the interior wax, which is poured off, leaving a hollow mold. To cast the desired part, molten metal is poured into the
mold and allowed to cool and solidify. The mold is then broken off to reveal a near net shape cast metal part.
Metal injection molding is a three part powder
metallurgy process by which a feedstock consisting of finely powdered metal and binders is processed through injection molding, debinding,
and sintering equipment to produce steel, stainless steel, and alloy parts of complex shape and geometry. This process allows for
high volume production while eliminating many of the wastes of traditional metal working methods, yielding net shape and near net shape
parts.
Marketing and Distribution
Firearms
The Company's firearms are primarily marketed
through a network of federally licensed, independent wholesale distributors who purchase the products directly from the Company. They
resell to federally licensed, independent retail firearms dealers who in turn resell to legally authorized end users. All retail purchasers
are subject to a point-of-sale background check by law enforcement. These end users include sportsmen, hunters, people interested in self-defense,
law enforcement and other governmental organizations, and gun collectors. Each domestic distributor carries the entire line of firearms
manufactured by the Company for the commercial market. Currently, 14 distributors service the domestic commercial market, with an additional
26 distributors servicing the domestic law enforcement market and 44 distributors servicing the export market.
In 2024, the Company’s largest customers
and the percent of firearms sales they represented were as follows: Lipsey’s – 28%; Sports South - 18%; and Davidson’s
- 16%.
In 2023, the Company’s largest customers
and the percent of firearms sales they represented were as follows: Lipsey’s – 24%; Davidson’s - 19%; and Sports South
- 15%.
In 2022, the Company’s largest customers
and the percent of firearms sales they represented were as follows: Lipsey’s - 23%; Davidson’s - 23%; and Sports South - 21%.
The Company employs 18 employees who service these
distributors and call on retailers and law enforcement agencies. Because the ultimate demand for the Company's firearms comes from end
users rather than from the independent wholesale distributors, the Company believes that the loss
of any distributor would not have a
material, long-term adverse effect on the Company, but may have a material adverse effect on the Company’s financial results for
a particular period. The Company considers its relationships with its distributors to be satisfactory.
The Company also exports its firearms through
a network of selected commercial distributors and directly to certain foreign customers, consisting primarily of law enforcement agencies
and foreign governments. Foreign sales were 5%, 6%, and 6% of the Company’s consolidated net sales for 2024, 2023, and 2022, respectively.
Investment Castings and Metal Injection Moldings
The castings segment provides castings and MIM
parts for the Company’s firearms segment. In addition, the castings segment produces some products for a number of customers in
a variety of industries.
Competition
Firearms
Competition in the firearms industry is intense
and comes from both foreign and domestic manufacturers. While some of these competitors concentrate on a single industry product category
such as rifles or pistols, many competitors manufacture products in two or three of the four categories (rifles, shotguns, pistols, and
revolvers) and a few competitors manufacture products in all four categories. The principal methods of competition in the industry are
product innovation, quality, availability, brand, and price. The Company believes that it can compete effectively with all of its present
competitors.
Investment Castings and Metal Injection Moldings
There are a large number of investment castings
and MIM manufacturers, both domestic and foreign, with which the Company competes. Competition varies based on the type of investment
castings products and the end use of the product. Companies offering alternative methods of manufacturing such as wire electric discharge
machining (EDM) and advancements in computer numeric controlled (CNC) machining also compete with the Company’s castings segment.
Many of these competitors are larger corporations than the Company with substantially greater financial resources than the Company, which
could affect the Company’s ability to compete with these competitors. The principal methods of competition in the industry are quality,
price, and production lead time.
Human Capital
The Company
is an equal opportunity employer dedicated to the attraction, development, and retention of our employees by providing a preferred work
environment that promotes and celebrates our core values of Integrity, Respect, Innovation and Teamwork. Our goal is to develop, motivate,
retain and reward passionate and dedicated employees.
As of February 1, 2025, the Company employed approximately
1,780 full-time employees, approximately 33% of whom had at least ten years of service with the Company.
The Company attracts candidates and retains employees
by offering competitive compensation packages, which include:
| ● | Medical and welfare benefits, |
| ● | Holidays and other paid time off, and |
| ● | 401(k) plan participation and matching program. |
The Company believes its compensation
packages:
| ● | Provide a base level of compensation to reflect an individual’s role and responsibilities, |
| ● | Recognize and reward employees for the Company’s success, and |
| ● | Provide for the safety, security and well-being of employees. |
Our primary vehicle for human capital development
is Ruger University, which has a mission to:
| ● | Enhance the understanding of our industry, Company
and culture, |
| ● | Strengthen the technical, interpersonal and leadership
skills of each employee, and |
| ● | Allow employees to positively change their own
lives while creating value for all Ruger stakeholders. |
In addition to providing a competitive compensation
package and emphasizing the development of employees, the Company retains its employees by maintaining a safe, responsible, and preferred
workplace. The Company is committed to conducting business in conformance with the highest ethical standards and in compliance with all
applicable legal and regulatory requirements. The “Code of Business Conduct and Ethics” and the “Corporate Compliance
Program” are two active programs that guide the Company’s practices to achieve these goals.
To assess and improve employee retention and engagement,
the Company surveys employees on an annual basis with the assistance of a third-party consultant, and takes actions to address areas of
employee concern and build on the competencies that are important for our future success.
Research and Development
In 2024, 2023, and 2022, the Company spent approximately
$8.2 million, $9.8 million, and $9.6 million, respectively, on research and development activities relating to new products and the improvement
of existing products. Research and development expenses are included in costs of products sold. As of February 1, 2025, the Company had
approximately 60 employees whose primary responsibilities were research and development activities.
Patents and Trademarks
The Company owns various United States and foreign
patents and trademarks which have been secured over a period of years and which expire at various times. It is the policy of the Company
to apply for patents and trademarks whenever new products or processes deemed commercially
valuable are developed or marketed by the Company.
The Company deems its patents and trademarks to be valuable and therefore works to police and protect them.
Environmental Matters
The Company is committed to achieving high standards
of environmental quality and product safety, and strives to provide a safe and healthy workplace for its employees and others in the communities
in which it operates. The Company has programs in place that monitor compliance with various environmental regulations. However, in the
normal course of its manufacturing operations the Company is subject to governmental proceedings and orders pertaining to waste disposal,
air emissions, and water discharges into the environment. These regulations are integrated into the Company’s manufacturing, assembly,
and testing processes. The Company believes that it is generally in compliance with applicable environmental regulations and that the
outcome of any environmental proceedings and orders will not have a material adverse effect on the financial position of the Company,
but could have a material adverse effect on the financial results for a particular period.
Information about our Executive Officers
Set forth below are the names, ages, and positions
of the executive officers of the Company. Officers serve at the discretion of the Board of Directors of the Company.
| Name |
Age |
Position With Company |
| |
|
|
| Christopher J. Killoy |
66 |
President and Chief Executive Officer
(until March 1, 2025) |
| |
|
|
| Todd W. Seyfert |
55 |
President and Chief Executive Officer
(effective March 1, 2025) |
| |
|
|
| Thomas A. Dineen |
56 |
Senior Vice President, Treasurer, and Chief Financial Officer |
| |
|
|
| Kevin B. Reid, Sr. |
64 |
Vice President, General Counsel, and Corporate Secretary |
| |
|
|
| Shawn C. Leska |
53 |
Vice President, Sales |
| |
|
|
| Sarah F. Colbert |
44 |
Vice President, Administration |
| |
|
|
| Timothy M. Lowney |
61 |
Vice President of Manufacturing Operations |
| |
|
|
| Michael W. Wilson |
48 |
Vice President of New Product Development |
| |
|
|
| Robert J. Werkmeister, Jr. |
50 |
Vice President of Marketing |
Christopher J. Killoy became President & Chief
Executive Officer on May 9, 2017. Previously he served as President and Chief Operating Officer since January 1, 2014. Prior to that he
served as Vice President of Sales and Marketing since November 27, 2006. Mr. Killoy originally joined the Company in 2003 as Executive
Director of Sales and Marketing, and subsequently served as Vice
President of Sales and Marketing from
November 1, 2004 to January 25, 2005. Mr. Killoy will step down as President & Chief Executive Officer on March 1, 2025 and then
serve as a Special Advisor through his planned retirement from the Company in May 2025.
Todd W. Seyfert will become President & Chief
Executive Officer on March 1, 2025. Previously, Mr. Seyfert served as the President of Segment Land Vehicles Americas at Dometic Group
AB since January 2024. Prior to that Mr. Seyfert served as the Chief Executive Officer of FeraDyne Outdoors, LLC, a leading manufacturer
of premium archery and hunting products from February 2016 through May 2023.
Thomas A. Dineen became Senior Vice President
on July 10, 2017. Previously he served as Vice President since May 24, 2006. Prior to that he served as Treasurer and Chief Financial
Officer since May 6, 2003 and had been Assistant Controller since 2001. Mr. Dineen joined the Company as Manager, Corporate Accounting
in 1997.
Kevin B. Reid, Sr. became Vice President and General
Counsel on April 23, 2008. Previously he served as the Company’s Director of Marketing from June 4, 2007. Mr. Reid joined the Company
in July 2001 as an Assistant General Counsel.
Shawn C. Leska became Vice President, Sales on
November 6, 2015. Mr. Leska joined the Company in 1989 and has served in a variety of positions in the sales department. Most recently,
Mr. Leska served as Director of Sales since 2011.
Sarah F. Colbert became Vice President of Administration
on June 1, 2017. Ms. Colbert has served the Company in various human resource and legal capacities since joining the Company in 2011.
Timothy M. Lowney became Vice President of Manufacturing
Operations on June 15, 2023. Previously, he served as the Company’s Vice President of Operations for Newport, Prescott and RPM Manufacturing
since June 15, 2023. Mr. Lowney joined the Company in January 2007.
Michael W. Wilson became Vice President of New
Product Development on April 1, 2024. Previously, he served as the Company’s Vice President of Operations for New Product Development,
Product Engineering and Mayodan Manufacturing since June 15, 2023. Mr. Wilson joined the Company in July 2007.
Robert J. Werkmeister, Jr. became Vice President
of Marketing upon joining the Company on June 1, 2017. Mr. Werkmeister has served as the Company’s Director of Marketing since January
2013 as President and founder of Symbolic, Inc., a full-service marketing agency. While with Symbolic, Rob began working with Ruger as
a client in 2002 and has been the primary strategic marketing driver for the Ruger account since 2007.
Where You Can Find More Information
The Company is subject to the informational requirements
of the Securities Exchange Act of 1934, as amended (the “Exchange Act”), and accordingly, files its Annual Report on Form
10-K, Quarterly Reports on Form 10-Q, Definitive Proxy Statements, Current Reports on Form 8-K, and
other information with the Securities
and Exchange Commission (the “SEC”). As an electronic filer, the Company's public filings are maintained on the SEC's Internet
site that contains reports, proxy and information statements, and other information regarding issuers that file electronically with the
SEC. The address of that website is http://www.sec.gov.
The Company makes its Annual Report on Form 10-K,
Quarterly Reports on Form 10-Q, Definitive Proxy Statements, Current Reports on Form 8-K and amendments to those reports filed or furnished
pursuant to Section 13(a) or 15(d) of the Exchange Act accessible free of charge through the Company's Internet site after the Company
has electronically filed such material with, or furnished it to, the SEC. The address of that website is http://www.ruger.com. However,
such reports may not be accessible through the Company's website as promptly as they are accessible on the SEC’s website.
Additionally, the Company’s corporate governance
materials, including its Corporate Governance Guidelines, the charters of the Audit, Compensation, Nominating and Corporate Governance,
Risk Oversight and Capital Policy committees, and the Code of Business Conduct and Ethics may also be found under the “Investor
Relations” subsection of the “Corporate” section of the Company’s Internet site at http://www.ruger.com/corporate.
A copy of the foregoing corporate governance materials is available upon written request to the Corporate Secretary at Sturm, Ruger &
Company, Inc., 1 Lacey Place, Southport, Connecticut 06890.
ITEM 1A—RISK FACTORS
The Company’s operations could be affected
by various risks, many of which are beyond its control. Based on current information, the Company believes that the following identifies
the most significant risk factors that could have a material, adverse effect on its business, operating results, and financial condition.
Past financial performance may not be a reliable indicator of future performance and historical trends should not be used to anticipate
results or trends in future periods.
In evaluating the Company’s business, the
following risk factors, as well as other information in this report, should be carefully considered.
Changes in government policies and firearms
legislation could adversely affect the Company’s financial results.
The sale, purchase, ownership, and use of firearms
are subject to thousands of federal, state and local governmental regulations. The basic federal laws are the National Firearms Act, the
Federal Firearms Act, and the Gun Control Act of 1968. Federal law generally prohibits the private ownership of fully automatic weapons
manufactured after 1986 and places certain restrictions on the interstate sale of firearms unless certain licenses are obtained. The Company
does not manufacture fully automatic weapons and holds all necessary licenses under these federal laws. If the scope of the National Firearms
Act is expanded to regulate firearms currently regulated by the Gun Control Act, it could make acquisition of commonly owned and used
firearms more expensive and complicated for consumers, which could have a material adverse impact on demand for Company products. Several
states currently have laws in effect similar to the aforementioned legislation.
In 2005, Congress enacted the Protection of Lawful
Commerce in Arms Act (“PLCAA”). The PLCAA was enacted to address abuses by cities and agenda-driven individuals who wrongly
sought to make firearms manufacturers liable for legally manufactured and lawfully sold products if those products were later used in
criminal acts. The Company believes the PLCAA merely codifies common sense and long standing tort principles. If the PLCAA is repealed
or efforts to circumvent it are successful and lawsuits similar to those filed by cities and agenda-driven individuals in the late 1990s
and early 2000s are allowed to proceed, it could have a material adverse impact on the Company.
Currently, federal and several states’ legislatures
are considering additional legislation relating to the regulation of firearms, and a number of new laws have been enacted at the federal,
state, and local level. Enacted legislation and proposed bills are numerous and extremely varied, but many seek to limit magazine capacity,
restrict or ban the sale and, in some cases, the ownership of various types of firearms, or ban commonly owned firearms with certain features.
Other legislation seeks to require new technologies, such as microstamping and so-called “smart gun” technology, which are
not proven, reliable or feasible.
The Company believes that the lawful private ownership
of firearms is guaranteed by the Second Amendment to the United States Constitution and that the widespread private ownership of firearms
in the United States will continue. However, there can be no assurance that the regulation of firearms will not become more restrictive
in the future and that any such restriction would not have a material adverse effect on the business of the Company. Numerous bills regulating
the ownership of firearms have been proposed at the state and federal levels, and these bills propose a wide variety of restrictions including,
for example, limiting the number of firearms that may be purchased in a specified time, increasing the age for ownership, imposing additional
licensing or registration requirements, creating additional restrictions on certain, common firearm features, and levying new taxes on
firearms and/or ammunition.
The Company’s results of operations could
be further adversely affected if legislation with diverse requirements is enacted.
With literally thousands of laws being proposed
at the federal, state and local levels, if even a small percentage of these laws are enacted and they are incongruent, the Company could
find it difficult, expensive or even practically impossible to comply with them, impeding new product development and distribution of
existing products.
The Company’s results of operations could be adversely affected
by litigation.
The Company faces risks arising from various asserted
and unasserted litigation matters. These matters include, but are not limited to, assertions of allegedly defective product design or
manufacture, alleged failure to warn, claimed unfair trade practices, purported class actions against firearms manufacturers, generally
seeking relief such as medical expense reimbursement, property damages, and punitive damages arising from accidents involving firearms
or the criminal misuse of firearms, and those lawsuits filed on behalf of municipalities alleging harm to the general public. Various
factors or developments can lead to changes in current estimates of liabilities such as final adverse judgment, significant settlement
or changes in applicable law. A future adverse outcome in any one or more of these matters could have a material adverse effect on the
Company’s
financial results. See Note 20 to the financial statements which are included in this Annual Report on Form 10-K.
The Company relies upon relationships with
financial institutions.
The Company utilizes the services of numerous
financial institutions, including banks, insurance carriers, transfer agents, and others. Anti-gun politicians, gun-control activists,
and others may target these institutions and attempt to pressure them into ceasing to do business with the Company, or to use financial
relationships to impose unacceptable and improper restrictions on the Company’s business, which could have a material adverse impact
on the Company’s business, operating results, and financial condition. The potential volatility of these relationships may also
impact the Company’s decision making regarding the appropriate allocation of capital to be used for activities such as internal
investment, share repurchases, and potential acquisitions.
The Company’s insurance may be insufficient to protect us
from claims or losses.
The Company maintains insurance coverage with
third-party insurers and through a wholly-owned captive insurance company with respect to product liability claims, which the Company
established in 2024. However, not every risk or liability is or can be protected by insurance, and, for those risks it insures, the limits
of coverage it purchases, or that are reasonably obtainable in the market, or the funding level of the Company’s wholly-owned captive
insurance company may not be sufficient to cover all actual losses or liabilities incurred. Moreover, there is a risk that commercially
available liability insurance will not continue to be available to the Company at a reasonable cost, if at all. If liability claims or
losses exceed the Company’s current or available insurance coverage, its business may be harmed.
The Company’s results of operations could
be adversely affected by a decrease in demand for Company products.
If demand for the Company’s products decreases
significantly, the Company would be unable to efficiently utilize its capacity, and profitability would suffer. Decreased demand could
result from a macroeconomic downturn, or could be specific to the Company and/or the firearms industry as a result of social, political,
or other factors. If the decrease in demand occurs abruptly, the adverse impact would be even greater.
The financial health of the Company’s independent distributors
is critical to its success.
Over 90% of the Company’s sales are made
to 14 federally licensed, independent wholesale distributors. The Company reviews its distributors’ financial statements and has
credit insurance for many of them. However, the Company’s credit evaluations of distributors and credit insurance may not be completely
effective, especially if higher interest rates continue to exact a financial strain. If one or more independent distributors experience
financial distress or liquidity issues, the Company’s sales could be adversely affected and the Company may not be able to collect
its accounts receivable on a timely basis, which would have an adverse impact on its operating results and financial condition.
The Company must comply with various laws and
regulations pertaining to workplace safety and environment, environmental matters, and firearms manufacturing.
In the normal course of its manufacturing operations,
the Company is subject to numerous federal, state and local laws and governmental regulations, and governmental proceedings and orders.
These laws and regulations pertain to matters like workplace safety and environment, firearms serial number tracking and control, waste
disposal, air emissions and water discharges into the environment. Noncompliance with any one or more of these laws and regulations could
have a material adverse impact on the Company.
Misconduct of the Company’s employees
or contractors could cause the Company to lose customers and could have a significant adverse impact on its business and reputation.
Misconduct, fraud or other improper activities
by the Company’s employees or contractors could have a material adverse impact on its business and reputation. Such misconduct could
include the failure to comply with federal, state, local or foreign government procurement regulations, regulations regarding the protection
of personal information, laws and regulations relating to antitrust and any other applicable laws or regulations.
Product quality and performance is important
to the Company’s success.
The Company has a long
history of producing rugged, reliable firearms for the commercial market. While the Company believes its record of designing, manufacturing,
and selling high-quality products demonstrates its commitment to safety and quality, the Company has occasionally identified design and/or
manufacturing issues with respect to some firearms and, as a result, issued a product safety bulletin or initiated a product recall. Depending
upon the volume of products the Company has shipped into the market, any future recall or safety bulletin could harm its reputation, cause
the Company to lose business, and cause the Company to incur significant support and repair costs.
The ability to develop and produce new
products is important to the Company’s success.
The Company has a long
history of designing, engineering, and manufacturing innovative new products. These new products help to drive growth, excitement, and
profitability and have historically allowed the Company to refrain from having to extend some of the aggressive promotions, discounts,
rebates, and the extension of payment terms offered by its competitors. While the Company believes it has a strong record of designing,
manufacturing, and selling new, high-quality products, failure to continue to do so in the future could harm its reputation, cause the
Company to lose business, and cause the Company to incur significant promotional costs, which would have an adverse impact on its operating
results and financial condition.
The Company may be impacted by the actions of its competitors.
The Company remains focused on the long-term goal
of creating shareholder value. Its disciplined pricing and promotion strategy may not always benefit current period sales and profitability,
but endeavors to enhance its long-term performance and promote consistency throughout the distribution channel. Allowing both independent
distributors and retailers to confidently invest in its inventory is essential to the Company’s long-term success and leadership
in the volatile firearms market. However, the aggressive promotions, discounts, rebates, and the extension of payment terms offered by
its competitors could negatively impact the Company’s market share, which would have an adverse impact on its operating results
and financial condition.
Business disruptions at one of the Company’s
manufacturing facilities could adversely affect the Company’s financial results.
The Newport, New Hampshire, Prescott, Arizona,
Mayodan, North Carolina, and Earth City, Missouri facilities are critical to the Company’s success. These facilities house the Company’s
principal production, research, development, engineering, design, and shipping operations. Any event that causes a disruption of the operation
of any of these facilities for even a relatively short period of time could have a material adverse effect on the Company’s ability
to produce and ship products and to provide service to its customers.
The Company relies on its information and communications
systems in its operations. Security breaches and other disruptions could adversely affect its business and results of operations.
Cybersecurity threats are significant and evolving
and include, among others, malicious software, attempts to gain unauthorized access to data, and other electronic security breaches that
could lead to disruptions in mission critical systems, unauthorized release of confidential or otherwise protected information and corruption
of data. In addition to security threats, the Company is also subject to other systems failures, including network, software or hardware
failures, whether caused by the Company, third-party service providers, natural disasters, power shortages, terrorist attacks or other
events. The unavailability of the Company’s information or communications systems, the failure of these systems to perform as anticipated
or any significant breach of data security could cause loss of data, disrupt Company operations, lead to financial losses from remedial
actions, require significant management attention and resources, and negatively impact the Company’s reputation among its customers
and the public, which could have a negative impact on the Company’s financial condition, results of operations and liquidity.
The lack of available raw materials or component
parts could disrupt or even cease the Company’s manufacturing operations. Even if manufacturing operations are not disrupted, increased
costs of raw materials and component parts could adversely affect the Company’s financial results.
Third parties supply the Company with various
raw materials for its firearms and castings, such as fabricated steel components, walnut, birch, beech, maple and laminated lumber for
rifle stocks, wax, ceramic material, metal alloys, various synthetic products and other component parts. There is a limited supply of
these materials in the marketplace at any given time, which can cause the purchase prices to vary based upon numerous market factors.
If market conditions result in a significant prolonged inflation of certain prices or if adequate quantities of raw materials cannot be
obtained, the Company’s manufacturing processes could be interrupted and the Company’s financial condition or results of operations
could be materially adversely affected.
The Company relies
primarily on third parties for transportation of the products it manufactures as well as delivery of its raw materials.
Any increase in the cost
of the transportation of the Company’s raw materials or products, as a result of increases in fuel or labor costs, higher demand
for logistics services, consolidation in the transportation industry or otherwise, increased restrictions on the transportation of firearms,
may adversely affect its results of operations. If any of these providers were to fail to deliver raw materials to the Company in a timely
manner, the Company may be unable to manufacture and deliver its products in a timely manner. In addition, if any of these third parties
were to cease
operations or cease doing business with the Company, the Company may be unable to replace them at a reasonable cost. And
such failure of a third-party transportation provider could harm the Company’s reputation, negatively affect its customer relationships
and have a material adverse effect on its financial position and results of operations.
Availability and retention
of the Company’s labor force, especially its key management, is critical to the success of the Company.
The
Company has observed an overall tightening and increasingly competitive labor market, which could inhibit its ability to recruit
and retain the employees it requires and could lead to increased costs, such as additional overtime to meet demand and increased wages
and benefits to attract and retain employees. The Company relies on the knowledge, experience, and leadership skills of its senior management
team. The Company’s senior executives are generally not bound by employment agreements. The loss of the services of one or more
of the Company’s senior executives or other key personnel could have a significant adverse impact on its business.
ITEM 1B—UNRESOLVED STAFF COMMENTS
None
ITEM 1C—CYBERSECURITY
Risk management and
strategy
The Company
has processes for assessing, identifying, and managing material risks from cybersecurity threats. These processes are integrated into
the Company’s overall risk management systems, as overseen by the Company’s Board of Directors, primarily through its Risk
Oversight Committee. These processes also include overseeing and identifying risks from cybersecurity threats associated with the use
of third-party service providers. The Company conducts security assessments of certain third-party providers before engagement and has
established monitoring procedures in its effort to mitigate risks related to data breaches or other security incidents originating from
third parties. The Company from time to time engages third-party consultants, legal advisors, and audit firms in evaluating and testing
the Company’s risk management systems and assessing and remediating certain potential cybersecurity incidents as appropriate.
The Company
has an Information Security Program (“Program”) to protect personal and proprietary information in compliance with applicable
federal and state requirements. The Program is designed to:
| ● | Ensure the security and confidentiality of employee and customer
personal information and Company proprietary information; |
| ● | Protect against anticipated threats or hazards to the security or
integrity of such information; and |
| ● | Protect against unauthorized access to, use of, or transfer of such
information in a manner that could harm or inconvenience the Company, employees or customers. |
For more
information about these risks, see the risk factor titled “The Company relies on its information and communications systems in its
operations. Security breaches and other disruptions could adversely affect its business and results of operations” under Item 1A.
Governance
The Company’s Board
of Directors has assigned oversight of cybersecurity risk management to the Risk Oversight Committee. The Risk Oversight Committee regularly
receives reports from management, including senior information technology (“IT”) leadership, and third parties on cybersecurity
matters. In addition, the Company’s full Board of Directors receives reports addressing cybersecurity as part of the Company’s
overall enterprise risk management program and to the extent cybersecurity matters are addressed in regular business updates.
Senior IT leaders are
responsible for developing appropriate cybersecurity programs, including as may be required by applicable law or regulation. These individuals’
expertise in IT and cybersecurity generally has been gained from a combination of education, including relevant degrees and/or certifications,
and work experience. They are informed by their respective cybersecurity teams about, and monitor, the prevention, detection, mitigation
and remediation of cybersecurity incidents as part of the cybersecurity programs described above.
Information regarding
cybersecurity risks may be elevated by IT leadership through a variety of channels, including discussions between or among key leaders
and Company management and reports to the Company’s Board of Directors and/or certain Board committees.
ITEM 2—PROPERTIES
The Company’s manufacturing operations are
carried out at four facilities. The following table sets forth certain information regarding each of these facilities:
| | |
Approximate
Aggregate
Usable
Square Feet | |
Status | |
Segment |
| | |
| | | |
| |
|
| Newport, New Hampshire | |
| 350,000 | | |
Owned | |
Firearms/Castings |
| | |
| | | |
| |
|
| Prescott, Arizona | |
| 230,000 | | |
Leased | |
Firearms |
| | |
| | | |
| |
|
| Mayodan, North Carolina | |
| 220,000 | | |
Owned | |
Firearms |
| | |
| | | |
| |
|
| Earth City, Missouri | |
| 35,000 | | |
Leased | |
Castings |
Each firearms facility contains enclosed ranges
for testing firearms. The lease of the Prescott facility provides for rental payments which are approximately equivalent to estimated
rates for real property taxes.
The Company has other facilities that were not
used in its manufacturing operations in 2024:
| | |
Approximate
Aggregate
Usable
Square Feet | |
Status | |
Segment |
| | |
| | | |
| |
|
| Southport, Connecticut | |
| 25,000 | | |
Owned | |
Corporate |
| | |
| | | |
| |
|
| Newport, New Hampshire (Dorr Woolen Building) | |
| 45,000 | | |
Owned | |
Firearms |
| | |
| | | |
| |
|
| Enfield, Connecticut | |
| 10,000 | | |
Leased | |
Firearms |
| | |
| | | |
| |
|
| Mayodan, North Carolina | |
| 225,000 | | |
Owned | |
Firearms |
There are no mortgages or any other major encumbrance
on any of the real estate owned by the Company.
The Company’s principal executive offices
are located in Southport, Connecticut.
ITEM 3—LEGAL PROCEEDINGS
The nature of the legal proceedings against the
Company is discussed at Note 20 to the financial statements, which are included in this Form 10-K.
The Company has reported all cases instituted
against it through September 28, 2024, and the results of those cases, where terminated, to the SEC on its previous Form 10-Q and 10-K
reports, to which reference is hereby made.
There were no lawsuits formally instituted against the Company during
the three months ending December 31, 2024.
ITEM 4—MINE SAFETY DISCLOSURES – NOT APPLICABLE
PART II
ITEM 5—MARKET FOR REGISTRANT'S
COMMON EQUITY, RELATED STOCKHOLDER MATTERS AND ISSUER PURCHASES OF EQUITY SECURITIES
The Company’s common stock is traded on
the New York Stock Exchange under the symbol “RGR.” At February 5, 2025, the Company had 1,790 stockholders of record.
Issuer Repurchase of Equity Securities
In 2022, 2023 and 2024 the Company repurchased
shares of its common stock. Details of the purchases in 2022, 2023 and 2024 follow:
| Period | |
Total
Number of
Shares
Purchased | |
Average
Price Paid
per Share | |
Total
Number of
Shares
Purchased
as Part of
Publicly
Announced
Program | |
Maximum
Dollar
Value of
Shares that
May Yet Be
Purchased
Under the
Program |
| | |
| | | |
| | | |
| | | |
| | |
| Third Quarter 2022 | |
| | | |
| | | |
| | | |
| | |
| July 3 to July 30 | |
| — | | |
| — | | |
| — | | |
| | |
| July 31 to August 27 | |
| — | | |
| — | | |
| — | | |
| | |
| August 28 to October 1 | |
| 2,136 | | |
$ | 49.97 | | |
| 2,136 | | |
| | |
| Fourth Quarter 2022 | |
| | | |
| | | |
| | | |
| | |
| October 2 to October 29 | |
| — | | |
| — | | |
| — | | |
| | |
| October 30 to November 26 | |
| 2,304 | | |
$ | 49.77 | | |
| 2,304 | | |
| | |
| November 27 to December 31 | |
| — | | |
| — | | |
| — | | |
| | |
| Fourth Quarter 2023 | |
| | | |
| | | |
| | | |
| | |
| October 1 to October 28 | |
| — | | |
| — | | |
| — | | |
| | |
| October 29 to November 25 | |
| 179,341 | | |
$ | 45.20 | | |
| 179,341 | | |
| | |
| November 26 to December 31 | |
| 84,721 | | |
$ | 43.67 | | |
| 84,721 | | |
| | |
| First Quarter 2024 | |
| | | |
| | | |
| | | |
| | |
| January 1 to January 27 | |
| 7,317 | | |
$ | 43.42 | | |
| 7,317 | | |
| | |
| January 28 to February 24 | |
| 20,307 | | |
$ | 42.93 | | |
| 20,307 | | |
| | |
| February 25 to March 30 | |
| 47,400 | | |
$ | 42.79 | | |
| 47,400 | | |
| | |
| Second Quarter 2024 | |
| | | |
| | | |
| | | |
| | |
| March 31 to April 27 | |
| — | | |
| — | | |
| — | | |
| | |
| April 28 to May 25 | |
| 28,924 | | |
$ | 42.92 | | |
| 28,924 | | |
| | |
| May 26 to June 29 | |
| 373,969 | | |
$ | 42.27 | | |
| 373,969 | | |
| | |
| Third Quarter 2024 | |
| | | |
| | | |
| | | |
| | |
| June 30 to July 27 | |
| 156,517 | | |
$ | 41.27 | | |
| 156,517 | | |
| | |
| July 28 to August 24 | |
| — | | |
| — | | |
| — | | |
| | |
| August 25 to September 28 | |
| 64,325 | | |
$ | 40.66 | | |
| 64,325 | | |
| | |
| Fourth Quarter 2024 | |
| | | |
| | | |
| | | |
| | |
| September 29 to October 26 | |
| 11,340 | | |
$ | 40.50 | | |
| 11,340 | | |
| | |
| October 27 to November 23 | |
| 52,129 | | |
$ | 39.50 | | |
| 52,129 | | |
| | |
| November 23 to December 31 | |
| 72,832 | | |
$ | 34.81 | | |
| 72,832 | | |
| | |
| Total | |
| 1,103,562 | | |
$ | 42.07 | | |
| 1,103,562 | | |
$ | 40,290,000 | |
All of these purchases were made with cash held
by the Company and no debt was incurred.
At December 31, 2024 approximately $40.3 million
remained authorized for share repurchases.
Comparison of Five-Year Cumulative Total Return* |
| Sturm, Ruger & Co., Inc., Standard & Poor’s 500, Dow Jones US Recreational Products TSM Index, and Russell 2000 Index |
| (Performance Results Through 12/31/24) |
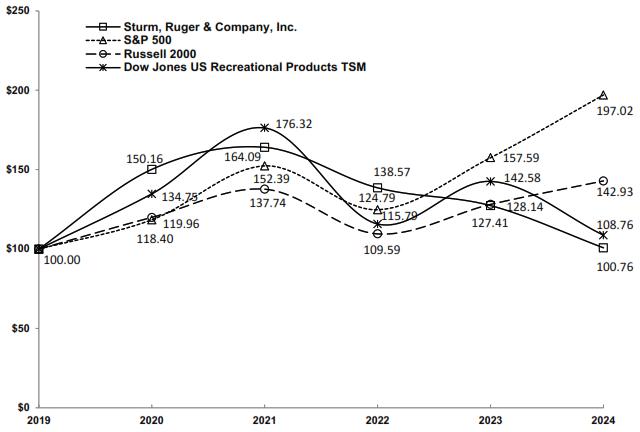
*Assumes $100 invested on 12/31/19 in stock or index, including reinvestment of dividends.
| | |
| 2019 | | |
| 2020 | | |
| 2021 | | |
| 2022 | | |
| 2023 | | |
| 2024 | |
| Sturm, Ruger & Company, Inc. | |
| 100.00 | | |
| 150.16 | | |
| 164.09 | | |
| 138.57 | | |
| 127.41 | | |
| 100.76 | |
| Standard & Poors 500 | |
| 100.00 | | |
| 118.40 | | |
| 152.39 | | |
| 124.79 | | |
| 157.59 | | |
| 197.02 | |
| Russell 2000 Index | |
| 100.00 | | |
| 119.96 | | |
| 137.74 | | |
| 109.59 | | |
| 128.14 | | |
| 142.93 | |
| Dow Jones US Recreational Products TSM | |
| 100.00 | | |
| 134.75 | | |
| 176.32 | | |
| 115.79 | | |
| 142.58 | | |
| 108.76 | |
For the year ended December 31, 2024, the Company
has provided the five year cumulative total return results for the Dow Jones US Recreational Products Index, a widely-published index
tracking companies that provide recreational products.
ITEM 6—[RESERVED]
ITEM 7—MANAGEMENT'S DISCUSSION
AND ANALYSIS OF FINANCIAL CONDITION AND RESULTS OF OPERATIONS
Company Overview
Sturm, Ruger & Company, Inc. (the “Company”)
is principally engaged in the design, manufacture, and sale of firearms to domestic customers. Approximately 99% of sales are from firearms.
Export sales represent approximately 5% of total sales. The Company’s design and manufacturing operations are located in the United
States and almost all product content is domestic. The Company’s firearms are sold through a select number of independent wholesale
distributors, principally to the commercial sporting market.
The Company also manufactures investment castings
made from steel alloys and metal injection molding (“MIM”) parts for internal use in its firearms and for sale to unaffiliated,
third-party customers. Less than 1% of sales are from the castings segment.
Results of Operations - 2024
Product Demand
The estimated sell-through of the Company’s
products from the independent distributors to retailers in 2024 increased 5% from 2023. In 2024, adjusted NICS decreased 4% from 2023.
The increase in the sell-through of the Company’s products despite the decrease in adjusted NICS background checks may be attributable
to new product introductions, like the Ruger American Rifle Generation II bolt-action rifles, the Marlin lever-action rifles, and the
RXM pistol, which helped offset aggressive promotions, discounts, rebates, and the extension of payment terms offered by the Company’s
competitors.
Estimated sell-through from distributors to retailers and total adjusted
NICS background checks:
| | |
2024 | |
2023 | |
2022 |
| | |
| | | |
| | | |
| | |
| Estimated Units Sold from Distributors to Retailers (1) | |
| 1,471,300 | | |
| 1,406,600 | | |
| 1,506,800 | |
| | |
| | | |
| | | |
| | |
| Total Adjusted NICS Background Checks (2) | |
| 15,239,000 | | |
| 15,848,000 | | |
| 16,425,000 | |
| (1) | The estimates for each period were calculated by taking the beginning inventory at the distributors, plus
shipments from the Company to distributors during the period, less the ending inventory at distributors. These estimates are only a proxy
for actual market demand as they: |
| ● | Rely on data provided by independent distributors
that are not verified by the Company, |
| ● | Do not consider potential timing issues within
the distribution channel, including goods-in-transit, and |
| ● | Do not consider fluctuations in inventory at
retail. |
| (2) | NICS background checks are performed when the ownership of most firearms, either new or used, is transferred
by a Federal Firearms Licensee. NICS background checks are also performed for permit applications, permit renewals, and other administrative
reasons. |
The adjusted NICS data presented above
was derived by the NSSF by subtracting NICS checks that are not directly related to the sale of a firearm, including checks used for concealed
carry (“CCW”) permit application checks as well as checks on active CCW permit databases.
Adjusted NICS data can be impacted by
changes in state laws and regulations and any directives and interpretations issued by governmental agencies.
Orders Received and Ending Backlog
The Company uses the estimated unit sell-through
of its products from the independent distributors to retailers, along with inventory levels at the independent distributors and at the
Company, as the key metrics for planning production levels.
The units ordered, value of orders received and ending backlog, net
of Federal Excise Tax, for the trailing three years are as follows (dollars in millions, except average sales price):
| | |
2024 | |
2023 | |
2022 |
| | |
| | | |
| | | |
| | |
| Orders Received | |
$ | 533.3 | | |
$ | 433.8 | | |
$ | 451.2 | |
| | |
| | | |
| | | |
| | |
| Average Sales Price of Orders Received | |
$ | 377 | | |
$ | 374 | | |
$ | 416 | |
| | |
| | | |
| | | |
| | |
| Ending Backlog | |
$ | 252.9 | | |
$ | 229.0 | | |
$ | 314.4 | |
| | |
| | | |
| | | |
| | |
| Average Sales Price of Ending Backlog | |
$ | 568 | | |
$ | 522 | | |
$ | 486 | |
Production
The Company reviews the estimated sell-through
from the independent distributors to retailers, as well as inventory levels at the independent distributors and at the Company, to plan
production levels and manage inventories. These reviews resulted in a decrease in total unit production of 1% in 2024 compared to 2023.
Annual Summary Unit Data
Firearms unit data for orders, production, and
shipments follows:
| | |
2024 | |
2023 | |
2022 |
| | |
| | | |
| | | |
| | |
| Units Ordered | |
| 1,414,300 | | |
| 1,159,000 | | |
| 1,083,800 | |
| | |
| | | |
| | | |
| | |
| Units Produced | |
| 1,379,500 | | |
| 1,398,200 | | |
| 1,733,200 | |
| | |
| | | |
| | | |
| | |
| Units Shipped | |
| 1,407,800 | | |
| 1,367,500 | | |
| 1,641,000 | |
| | |
| | | |
| | | |
| | |
| Average Sales Price | |
$ | 377 | | |
$ | 395 | | |
$ | 362 | |
| | |
| | | |
| | | |
| | |
| Units – Backlog | |
| 445,300 | | |
| 438,800 | | |
| 647,300 | |
Inventories
The Company’s finished goods inventory decreased
by 28,300 units during 2024, while distributor inventories of the Company’s
products decreased by 63,500 units during the same period.
Inventory data follows:
| | |
| 2024 | | |
| 2023 | | |
| 2022 | |
| Units – Company Inventory | |
| 115,200 | | |
| 143,500 | | |
| 112,800 | |
| | |
| | | |
| | | |
| | |
| Units – Distributor Inventory (3) | |
| 195,800 | | |
| 259,300 | | |
| 298,400 | |
| | |
| | | |
| | | |
| | |
| Total inventory (4) | |
| 311,000 | | |
| 402,800 | | |
| 411,200 | |
| (3) | Distributor ending inventory as provided by the independent distributors of the Company’s products.
These numbers do not include goods-in-transit inventory that has been shipped from the Company but not yet received by the distributors. |
| (4) | This total does not include inventory at retailers. The Company does not have access to data on retailer
inventories. |
Year ended December 31, 2024, as compared to year ended December
31, 2023:
Net Sales, Cost of Products Sold, and Gross
Profit
Net
sales, cost of products sold, and gross profit data for the year ended (dollars in millions):
| | |
| December
31, 2024 | | |
| December
31, 2023 | | |
| Change | | |
| % Change |
| Net firearms sales | |
$ | 532.6 | | |
$ | 540.7 | | |
$ | (8.1 | ) | |
| (1.5 | )% |
| | |
| | | |
| | | |
| | | |
| | |
| Net casting sales | |
| 3.0 | | |
| 3.0 | | |
| 0.0 | | |
| 0.5 | % |
| | |
| | | |
| | | |
| | | |
| | |
| Total net sales | |
| 535.6 | | |
| 543.7 | | |
| (8.1 | ) | |
| (1.5 | )% |
| | |
| | | |
| | | |
| | | |
| | |
| Cost of products sold | |
| 421.2 | | |
| 410.1 | | |
| 11.1 | | |
| 2.7 | % |
| | |
| | | |
| | | |
| | | |
| | |
| Gross profit | |
$ | 114.4 | | |
$ | 133.6 | | |
$ | (19.2 | ) | |
| (14.4 | )% |
| | |
| | | |
| | | |
| | | |
| | |
| Gross margin | |
| 21.4% | | |
| 24.6% | | |
| (3.2 | )% | |
| (13.0 | )% |
Firearms sales decreased 2% and unit shipments
increased 3%, respectively, in 2024. New products represented $159.3 million or 32% of firearms sales in 2024, an increase from $119.0
million or 23% of firearms sales in 2023. New product sales include only major new products that were introduced in the past two years.
In 2024, new products included the RXM pistol, American Centerfire Rifle Generation II, Marlin 1894 lever-action rifles, Security-380
pistol, Super Wrangler revolver, LC Carbine, and the Small-Frame Autoloading Rifle and the Marlin 1895 Marlin lever-action rifles, which
were only included for a portion of the year.
The
decreased gross profit for the year ended December 31, 2024 is attributable to the decrease in sales, unfavorable deleveraging
of fixed costs resulting from decreased production, and a product mix shift toward products with relatively lower margins that remain
in stronger demand.
The decrease in gross margin for the year ended
December 31, 2024 is attributable to the aforementioned factors, partially offset by increased pricing.
Selling, General and Administrative
Selling and general and administrative expenses data for the year ended
(dollars in millions):
| | |
| December
31, 2024 | | |
| December
31, 2023 | | |
| Change | | |
| % Change | |
| Selling expenses | |
$ | 38.8 | | |
$ | 38.8 | | |
$ | — | | |
| (0.1% | ) |
| | |
| | | |
| | | |
| | | |
| | |
| General and administrative expenses | |
| 44.0 | | |
| 42.7 | | |
| 1.3 | | |
| 3.0% | |
| | |
| | | |
| | | |
| | | |
| | |
| Total operating expenses | |
$ | 82.8 | | |
$ | 81.5 | | |
$ | 1.3 | | |
| 1.5% | |
Selling expenses for the year ended December 31,
2024 were substantially unchanged from 2023, as increased spending on advertising was offset by modest reductions in several selling and
marketing initiatives.
The
increase in general, and administrative expenses for the year ended December 31, 2024 was primarily attributable to increased professional
service costs and accrued severances of $1.5 million taken in the first quarter of 2024 related to a reduction in force involving
approximately 80 employees. These increases were partially offset by a reduction in incentive compensation expenses. The aforementioned
accrued severances were settled in cash and consist of one-time termination charges arising from severance obligations and other customary
employee benefit payments in connection with a reduction in force.
Operating Income
Operating income was $31.6 million or 5.9% of
sales in 2024. This is a decrease of $20.4 million from 2023 operating income of $52.1 million or 9.6% of sales.
Other Operating Income (Expense), Net
Other income data for the year ended (dollars in millions):
| | |
December
31, 2024 | | |
December
31, 2023 | | |
Change | | |
% Change | |
| | |
| | |
| | |
| | |
| |
| Royalty income | |
$ | 0.8 | | |
$ | 0.6 | | |
$ | 0.2 | | |
| 30.2% | |
| Interest income | |
| 4.9 | | |
| 5.5 | | |
| (0.6 | ) | |
| (10.6% | ) |
| Interest expense | |
| (0.1 | ) | |
| (0.2 | ) | |
| 0.1 | | |
| (50.2% | ) |
| Other income, net | |
| 0.5 | | |
| 0.8 | | |
| (0.3 | ) | |
| (41.5% | ) |
| | |
| | | |
| | | |
| | | |
| | |
| Other income | |
$ | 6.1 | | |
$ | 6.7 | | |
$ | (0.6 | ) | |
| (10.0% | ) |
The decrease in other income for the year ended
December 31, 2024 was primarily the result of decreases in interest income due to decreased interest rates earned on short-term investments
and other income, partially offset by increased royalty.
Income Taxes and Net Income
The
effective income tax rate was 19.1% in 2024 and 18.0% in 2023. The Company's 2024 and 2023 effective tax rates differ from the
statutory federal tax rate due principally to research and development tax credits, state income taxes, and the nondeductibility of certain
executive compensation.
As a result of the foregoing factors, consolidated
net income was $30.6 million in 2024. This represents a decrease of $17.6 million from 2023 consolidated net income of $48.2 million.
Non-GAAP Financial Measure
In an effort to provide investors with additional
information regarding its results, the Company refers to various United States generally accepted accounting principles (“GAAP”)
financial measures and two non-GAAP financial measures, EBITDA and EBITDA margin, which management believes provides useful information
to investors. These non-GAAP measures may not be comparable to similarly titled measures being disclosed by other companies. In addition,
the Company believes that the non-GAAP financial measures should be considered in addition to, and not in lieu of, GAAP financial measures.
The Company believes that EBITDA and EBITDA margin are useful to understanding its operating results and the ongoing performance of its
underlying business, as EBITDA provides information on the Company’s ability to meet its capital expenditure and working capital
requirements, and is also an indicator of profitability. The Company believes that this reporting provides better transparency and comparability
to its operating results. The Company uses both GAAP and non-GAAP financial measures to evaluate its financial performance.
Non-GAAP Reconciliation – EBITDA
EBITDA
(Unaudited, dollars in thousands)
| Year ended December 31, | |
2024 | | |
2023 | |
| | |
| | | |
| | |
| Net income | |
$ | 30,563 | | |
$ | 48,215 | |
| | |
| | | |
| | |
| Income tax expense | |
| 7,212 | | |
| 10,609 | |
| Depreciation and amortization expense | |
| 22,063 | | |
| 22,383 | |
| Interest expense | |
| 102 | | |
| 205 | |
| Interest income | |
| (4,885 | ) | |
| (5,465 | ) |
| EBITDA | |
$ | 55,055 | | |
$ | 75,947 | |
| EBITDA margin | |
| 10.3% | | |
| 14.0% | |
| Net income margin | |
| 5.7% | | |
| 8.9% | |
EBITDA is defined as earnings before interest,
taxes, and depreciation and amortization. The Company calculates this by adding the amount of interest expense, income tax expense and
depreciation and amortization expenses that have been deducted from net income back into net income, and subtracting the amount of interest
income that was included in net income from net income to arrive at EBITDA. The Company’s EBITDA calculation also excludes any one-time
non-cash, non-operating expense.
Quarterly Data
To supplement the summary annual unit data and
discussion above, the same data for the last eight quarters follows:
| | |
2024 | |
| | |
| Q4 | | |
| Q3 | | |
| Q2 | | |
| Q1 | |
| | |
| | | |
| | | |
| | | |
| | |
| Units Ordered | |
| 374,300 | | |
| 316,900 | | |
| 250,500 | | |
| 472,600 | |
| | |
| | | |
| | | |
| | | |
| | |
| Units Produced | |
| 364,300 | | |
| 330,300 | | |
| 370,400 | | |
| 314,500 | |
| | |
| | | |
| | | |
| | | |
| | |
| Units Shipped | |
| 398,700 | | |
| 327,400 | | |
| 336,300 | | |
| 345,400 | |
| | |
| | | |
| | | |
| | | |
| | |
| Estimated Units Sold from Distributors to Retailers | |
| 410,500 | | |
| 336,300 | | |
| 327,800 | | |
| 396,700 | |
| | |
| | | |
| | | |
| | | |
| | |
| Total Adjusted NICS Background Checks | |
| 4,460,000 | | |
| 3,432,000 | | |
| 3,364,000 | | |
| 3,983,000 | |
| | |
| | | |
| | | |
| | | |
| | |
| Average Unit Sales Price | |
$ | 364 | | |
$ | 371 | | |
$ | 386 | | |
$ | 394 | |
| | |
| | | |
| | | |
| | | |
| | |
| Units – Backlog | |
| 445,300 | | |
| 469,700 | | |
| 480,200 | | |
| 566,000 | |
| | |
| | | |
| | | |
| | | |
| | |
| Units – Company Inventory | |
| 115,200 | | |
| 149,600 | | |
| 146,700 | | |
| 112,600 | |
| | |
| | | |
| | | |
| | | |
| | |
| Units – Distributor Inventory (5) | |
| 195,800 | | |
| 207,600 | | |
| 216,500 | | |
| 208,000 | |
| | |
2023 | |
| | |
Q4 | | |
Q3 | | |
Q2 | | |
Q1 | |
| | |
| | | |
| | | |
| | | |
| | |
| Units Ordered | |
| 316,600 | | |
| 176,300 | | |
| 258,100 | | |
| 408,000 | |
| | |
| | | |
| | | |
| | | |
| | |
| Units Produced | |
| 305,200 | | |
| 324,500 | | |
| 387,400 | | |
| 381,000 | |
| | |
| | | |
| | | |
| | | |
| | |
| Units Shipped | |
| 337,800 | | |
| 308,400 | | |
| 336,400 | | |
| 384,900 | |
| | |
| | | |
| | | |
| | | |
| | |
| Estimated Units Sold from Distributors to Retailers | |
| 384,700 | | |
| 307,400 | | |
| 323,000 | | |
| 391,500 | |
| | |
| | | |
| | | |
| | | |
| | |
| Total Adjusted NICS Background Checks | |
| 4,742,000 | | |
| 3,284,000 | | |
| 3,654,000 | | |
| 4,168,000 | |
| | |
| | | |
| | | |
| | | |
| | |
| Average Unit Sales Price | |
$ | 383 | | |
$ | 390 | | |
$ | 422 | | |
$ | 387 | |
| | |
| | | |
| | | |
| | | |
| | |
| Units – Backlog | |
| 438,800 | | |
| 460,000 | | |
| 592,100 | | |
| 670,400 | |
| | |
| | | |
| | | |
| | | |
| | |
| Units – Company Inventory | |
| 143,500 | | |
| 176,100 | | |
| 160,000 | | |
| 108,900 | |
| | |
| | | |
| | | |
| | | |
| | |
| Units – Distributor Inventory (5) | |
| 259,300 | | |
| 306,200 | | |
| 305,200 | | |
| 291,800 | |
| (5) | Distributor ending inventory as provided by the independent distributors of the Company’s products. |
(in millions
except average sales price, net of Federal Excise Tax)
| | |
2024 | |
| | |
Q4 | | |
Q3 | | |
Q2 | | |
Q1 | |
| | |
| | | |
| | | |
| | | |
| | |
| Orders Received | |
$ | 126.3 | | |
$ | 109.4 | | |
$ | 99.5 | | |
$ | 198.2 | |
| | |
| | | |
| | | |
| | | |
| | |
| Average Sales Price of Orders Received | |
$ | 337 | | |
$ | 345 | | |
$ | 397 | | |
$ | 419 | |
| | |
| | | |
| | | |
| | | |
| | |
| Ending Backlog | |
$ | 252.9 | | |
$ | 268.7 | | |
$ | 272.2 | | |
$ | 296.2 | |
| | |
| | | |
| | | |
| | | |
| | |
| Average Sales Price of Ending Backlog | |
$ | 568 | | |
$ | 572 | | |
$ | 567 | | |
$ | 523 | |
| | |
2023 | |
| | |
Q4 | | |
Q3 | | |
Q2 | | |
Q1 | |
| | |
| | | |
| | | |
| | | |
| | |
| Orders Received | |
$ | 116.7 | | |
$ | 58.8 | | |
$ | 102.1 | | |
$ | 156.2 | |
| | |
| | | |
| | | |
| | | |
| | |
| Average Sales Price of Orders Received | |
$ | 369 | | |
$ | 334 | | |
$ | 396 | | |
$ | 383 | |
| | |
| | | |
| | | |
| | | |
| | |
| Ending Backlog | |
$ | 229.0 | | |
$ | 234.8 | | |
$ | 293.7 | | |
$ | 327.3 | |
| | |
| | | |
| | | |
| | | |
| | |
| Average Sales Price of Ending Backlog | |
$ | 522 | | |
$ | 510 | | |
$ | 496 | | |
$ | 488 | |
Fourth Quarter Net Sales and Gross Profit Analysis
Net sales, cost of products sold, and gross profit
data for the three months ended (dollars in millions):
| | |
| December 31,
2024 | | |
| December 31,
2023 | | |
| Change | | |
| % Change | |
| Net firearms sales | |
$ | 145.3 | | |
$ | 129.6 | | |
$ | 15.7 | | |
| 12.1 | % |
| | |
| | | |
| | | |
| | | |
| | |
| Net casting sales | |
| 0.5 | | |
| 1.0 | | |
| (0.5 | ) | |
| (47.6 | )% |
| | |
| | | |
| | | |
| | | |
| | |
| Total net sales | |
| 145.8 | | |
| 130.6 | | |
| 15.2 | | |
| 11.6 | % |
| | |
| | | |
| | | |
| | | |
| | |
| Cost of products sold | |
| 112.6 | | |
| 98.3 | | |
| 14.3 | | |
| 14.5 | % |
| | |
| | | |
| | | |
| | | |
| | |
| Gross profit | |
$ | 33.2 | | |
$ | 32.3 | | |
$ | 0.9 | | |
| 2.9 | % |
| | |
| | | |
| | | |
| | | |
| | |
| Gross margin | |
| 22.8 | % | |
| 24.7 | % | |
| (1.9 | )% | |
| (7.7 | )% |
Results
of Operations - 2023
Year ended December 31, 2023, as compared to
year ended December 31, 2022
Annual Summary Unit Data
Firearms unit data for orders, production, shipments and ending inventory,
and castings setups (a measure of foundry production) are as follows:
| | |
2023 | | |
2022 | | |
2021 | |
| | |
| | | |
| | | |
| | |
| Units Ordered | |
| 1,159,000 | | |
| 1,083,800 | | |
| 1,835,500 | |
| | |
| | | |
| | | |
| | |
| Units Produced | |
| 1,398,200 | | |
| 1,733,200 | | |
| 2,154,600 | |
| | |
| | | |
| | | |
| | |
| Units Shipped | |
| 1,367,500 | | |
| 1,641,000 | | |
| 2,142,900 | |
| | |
| | | |
| | | |
| | |
| Average Sales Price | |
$ | 395 | | |
$ | 362 | | |
$ | 340 | |
| | |
| | | |
| | | |
| | |
| Units – Backlog | |
| 438,800 | | |
| 647,300 | | |
| 1,204,500 | |
| | |
| | | |
| | | |
| | |
| Units – Company Inventory | |
| 143,500 | | |
| 112,800 | | |
| 20,600 | |
| | |
| | | |
| | | |
| | |
| Units – Distributor Inventory (1) | |
| 259,300 | | |
| 298,400 | | |
| 164,200 | |
| | |
| | | |
| | | |
| | |
| Castings Setups | |
| 71,415 | | |
| 55,971 | | |
| 68,469 | |
Orders Received and Ending Backlog
(in millions except average sales price, net of
Federal Excise Tax):
| | |
2023 | | |
2022 | | |
2021 | |
| | |
| | | |
| | | |
| | |
| Orders Received | |
$ | 433.8 | | |
$ | 451.2 | | |
$ | 606.5 | |
| | |
| | | |
| | | |
| | |
| Average Sales Price of Orders Received (2) | |
$ | 374 | | |
$ | 416 | | |
$ | 330 | |
| | |
| | | |
| | | |
| | |
| Ending Backlog | |
$ | 229.0 | | |
$ | 314.4 | | |
$ | 429.7 | |
| | |
| | | |
| | | |
| | |
| Average Sales Price of Ending Backlog (2) | |
$ | 522 | | |
$ | 486 | | |
$ | 357 | |
| (1) | Distributor ending inventory as provided by the independent distributors of the Company’s products. |
| (2) | Average sales price for orders received and ending backlog is net of Federal Excise Tax of 10% for handguns
and 11% for long guns. |
Product Demand
The estimated sell-through of the Company’s
products from the independent distributors to retailers in 2023 decreased 7% from 2022. For the same period, adjusted NICS decreased 4%.
The greater reduction in the sell-through of the Company’s products relative to adjusted NICS background checks may be attributable
to aggressive promotions, discounts, rebates, and the extension of payment terms offered by the Company’s competitors.
Estimated sell-through from distributors to retailers and total adjusted
NICS background checks:
| | |
2023 | | |
2022 | | |
2021 | |
| | |
| | | |
| | | |
| | |
| Estimated Units Sold from Distributors to Retailers (1) | |
| 1,406,600 | | |
| 1,506,800 | | |
| 2,017,800 | |
| | |
| | | |
| | | |
| | |
| Total Adjusted NICS Background Checks (2) | |
| 15,848,000 | | |
| 16,425,000 | | |
| 18,515,000 | |
| (1) | The estimates for each period were calculated by taking the beginning inventory at the distributors, plus
shipments from the Company to distributors during the period, less the ending inventory at distributors. These estimates are only a proxy
for actual market demand as they: |
| ● | Rely on data provided by independent distributors
that are not verified by the Company, |
| ● | Do not consider potential timing issues within
the distribution channel, including goods-in-transit, and |
| ● | Do not consider fluctuations in inventory at
retail. |
| (2) | NICS background checks are performed when the ownership of most firearms, either new or used, is transferred
by a Federal Firearms Licensee. NICS background checks are also performed for permit applications, permit renewals, and other administrative
reasons. |
The adjusted NICS data presented above
was derived by the NSSF by subtracting NICS checks that are not directly related to the sale of a firearm, including checks used for concealed
carry (“CCW”) permit application checks as well as checks on active CCW permit databases.
Adjusted NICS data can be impacted by
changes in state laws and regulations and any directives and interpretations issued by governmental agencies.
Production
The Company reviews the estimated sell-through
from the independent distributors to retailers, as well as inventory levels at the independent distributors and at the Company, to plan
production
levels and manage inventories. These reviews resulted in a decrease in total unit production of 19% in 2023 compared to 2022.
Inventories
The Company’s finished goods inventory increased
by 30,700 units during 2023.
Distributor
inventories of the Company’s products decreased by 39,100 units during 2023, and approximate a reasonable level to support rapid
fulfillment of retailer demand for most product families.
Inventory data follows:
| | |
| 2023 | | |
| 2022 | | |
| 2021 | |
| Units – Company Inventory | |
| 143,500 | | |
| 112,800 | | |
| 20,600 | |
| | |
| | | |
| | | |
| | |
| Units – Distributor Inventory (3) | |
| 259,300 | | |
| 298,400 | | |
| 164,200 | |
| | |
| | | |
| | | |
| | |
| Total inventory (4) | |
| 402,800 | | |
| 411,200 | | |
| 184,800 | |
| (3) | Distributor ending inventory as provided by the independent distributors of the Company’s products.
These numbers do not include goods-in-transit inventory that has been shipped from the Company but not yet received by the distributors. |
| (4) | This total does not include inventory at retailers. The Company does not have access to data on retailer
inventories. |
Quarterly Data
To supplement the summary annual unit data and
discussion above, the same data for the last eight quarters follows:
| | |
2023 | |
| | |
| Q4 | | |
| Q3 | | |
| Q2 | | |
| Q1 | |
| | |
| | | |
| | | |
| | | |
| | |
| Units Ordered | |
| 316,600 | | |
| 176,300 | | |
| 258,100 | | |
| 408,000 | |
| | |
| | | |
| | | |
| | | |
| | |
| Units Produced | |
| 305,200 | | |
| 324,500 | | |
| 387,500 | | |
| 381,000 | |
| | |
| | | |
| | | |
| | | |
| | |
| Units Shipped | |
| 337,800 | | |
| 308,400 | | |
| 336,400 | | |
| 384,900 | |
| | |
| | | |
| | | |
| | | |
| | |
| Estimated Units Sold from Distributors to Retailers | |
| 384,700 | | |
| 307,400 | | |
| 323,000 | | |
| 391,500 | |
| | |
| | | |
| | | |
| | | |
| | |
| Total Adjusted NICS BackgroundChecks | |
| 4,742,000 | | |
| 3,284,000 | | |
| 3,654,000 | | |
| 4,168,000 | |
| | |
| | | |
| | | |
| | | |
| | |
| Average Unit Sales Price | |
$ | 383 | | |
$ | 390 | | |
$ | 422 | | |
$ | 387 | |
| | |
| | | |
| | | |
| | | |
| | |
| Units – Backlog | |
| 438,800 | | |
| 460,000 | | |
| 592,100 | | |
| 670,400 | |
| | |
| | | |
| | | |
| | | |
| | |
| Units – Company Inventory | |
| 143,500 | | |
| 176,100 | | |
| 160,000 | | |
| 108,900 | |
| | |
| | | |
| | | |
| | | |
| | |
| Units – Distributor Inventory (5) | |
| 259,300 | | |
| 306,200 | | |
| 305,200 | | |
| 291,800 | |
| | |
2022 | |
| | |
Q4 | | |
Q3 | | |
Q2 | | |
Q1 | |
| | |
| | | |
| | | |
| | | |
| | |
| Units Ordered | |
| 156,000 | | |
| 295,600 | | |
| 250,600 | | |
| 381,600 | |
| | |
| | | |
| | | |
| | | |
| | |
| Units Produced | |
| 397,300 | | |
| 382,800 | | |
| 431,800 | | |
| 521,300 | |
| | |
| | | |
| | | |
| | | |
| | |
| Units Shipped | |
| 393,100 | | |
| 373,800 | | |
| 382,600 | | |
| 491,500 | |
| | |
| | | |
| | | |
| | | |
| | |
| Estimated Units Sold from Distributors to Retailers | |
| 397,800 | | |
| 343,500 | | |
| 354,300 | | |
| 411,200 | |
| | |
| | | |
| | | |
| | | |
| | |
| Total Adjusted NICS BackgroundChecks | |
| 4,531,000 | | |
| 3,764,000 | | |
| 3,917,000 | | |
| 4,213,000 | |
| | |
| | | |
| | | |
| | | |
| | |
| Average Unit Sales Price | |
$ | 378 | | |
$ | 371 | | |
$ | 366 | | |
$ | 338 | |
| | |
| | | |
| | | |
| | | |
| | |
| Units – Backlog | |
| 647,300 | | |
| 884,400 | | |
| 962,600 | | |
| 1,094,600 | |
| | |
| | | |
| | | |
| | | |
| | |
| Units – Company Inventory | |
| 112,800 | | |
| 108,600 | | |
| 99,700 | | |
| 50,400 | |
| | |
| | | |
| | | |
| | | |
| | |
| Units – Distributor Inventory (5) | |
| 298,400 | | |
| 303,100 | | |
| 272,800 | | |
| 244,600 | |
| (5) | Distributor ending inventory as provided by the independent distributors of the Company’s products. |
(in millions
except average sales price, net of Federal Excise Tax)
| | |
2023 | |
| | |
Q4 | | |
Q3 | | |
Q2 | | |
Q1 | |
| | |
| | | |
| | | |
| | | |
| | |
| Orders Received | |
$ | 116.7 | | |
$ | 58.8 | | |
$ | 102.1 | | |
$ | 156.2 | |
| | |
| | | |
| | | |
| | | |
| | |
| Average Sales Price of Orders Received | |
$ | 369 | | |
$ | 334 | | |
$ | 396 | | |
$ | 383 | |
| | |
| | | |
| | | |
| | | |
| | |
| Ending Backlog | |
$ | 229.0 | | |
$ | 234.8 | | |
$ | 293.7 | | |
$ | 327.3 | |
| | |
| | | |
| | | |
| | | |
| | |
| Average Sales Price of Ending Backlog | |
$ | 522 | | |
$ | 510 | | |
$ | 496 | | |
$ | 488 | |
| | |
2022 | |
| | |
Q4 | | |
Q3 | | |
Q2 | | |
Q1 | |
| | |
| | | |
| | | |
| | | |
| | |
| Orders Received | |
$ | 81.0 | | |
$ | 124.3 | | |
$ | 98.9 | | |
$ | 147.0 | |
| | |
| | | |
| | | |
| | | |
| | |
| Average Sales Price of Orders Received | |
$ | 519 | | |
$ | 421 | | |
$ | 395 | | |
$ | 385 | |
| | |
| | | |
| | | |
| | | |
| | |
| Ending Backlog | |
$ | 314.4 | | |
$ | 377.6 | | |
$ | 389.6 | | |
$ | 420.5 | |
| | |
| | | |
| | | |
| | | |
| | |
| Average Sales Price of Ending Backlog | |
$ | 486 | | |
$ | 427 | | |
$ | 405 | | |
$ | 384 | |
Net Sales, Cost of Products Sold, and Gross
Profit
Net
sales, cost of products sold, and gross profit data for the year ended (dollars in millions):
| | |
| December 31,
2023 | | |
| December 31,
2022 | | |
| Change | | |
| % Change | |
| Net firearms sales | |
$ | 540.7 | | |
$ | 593.3 | | |
$ | (52.6 | ) | |
| (8.9 | )% |
| | |
| | | |
| | | |
| | | |
| | |
| Net casting sales | |
| 3.0 | | |
| 2.5 | | |
| 0.5 | | |
| 18.3 | % |
| | |
| | | |
| | | |
| | | |
| | |
| Total net sales | |
| 543.7 | | |
| 595.8 | | |
| (52.1 | ) | |
| (8.7 | )% |
| | |
| | | |
| | | |
| | | |
| | |
| Cost of products sold | |
| 410.1 | | |
| 415.7 | | |
| (5.6 | ) | |
| (1.3 | )% |
| | |
| | | |
| | | |
| | | |
| | |
| Gross profit | |
$ | 133.6 | | |
$ | 180.1 | | |
$ | (46.5 | ) | |
| (25.8 | )% |
| | |
| | | |
| | | |
| | | |
| | |
| Gross margin | |
| 24.6 | % | |
| 30.2 | % | |
| (5.6 | )% | |
| (18.5 | )% |
Firearms sales and unit shipments decreased 9%
and 17%, respectively, in 2023. New products represented $119.0 million or 23% of firearms sales in 2023, an increase from $78.4 million
or 14% of firearms sales in 2022. New product sales include only major new products that were introduced in the past two years. In 2023,
new products included the MAX-9 pistol (during the first quarter only), Security-380 pistol, Super Wrangler revolver, LCP MAX pistol,
Marlin lever-action rifles, LC Carbine, Small-Frame Autoloading Rifle, and American Centerfire Rifle Generation II.
The
decreased gross profit for the year ended December 31, 2023 is attributable to the significant decrease in sales, as well as unfavorable
deleveraging of fixed costs resulting from decreased production, a product mix shift toward products with relatively lower margins that
remain in stronger demand, and increased promotional costs.
The decrease in gross margin for the year ended
December 31, 2023 is attributable to the aforementioned factors, partially offset by increased pricing.
Selling, General and Administrative
Selling and general and administrative expenses data for the year ended
(dollars in millions):
| | |
| December
31, 2023 | | |
| December
31, 2022 | | |
| Change | | |
| % Change |
| Selling expenses | |
$ | 38.8 | | |
$ | 36.1 | | |
$ | 2.7 | | |
| 7.4 | % |
| | |
| | | |
| | | |
| | | |
| | |
| General and administrative expenses | |
| 42.7 | | |
| 40.5 | | |
| 2.2 | | |
| 5.4 | % |
| | |
| | | |
| | | |
| | | |
| | |
| Total operating expenses | |
$ | 81.5 | | |
$ | 76.6 | | |
$ | 4.9 | | |
| 6.4 | % |
The increase in selling expenses for the year
ended December 31, 2023 was primarily attributable to increased trade show costs, travel expenditures, and advertising, partially offset
by decreased sales volume.
The increase in general, and administrative expenses
for the year ended December 31, 2023 was primarily attributable to increased professional service costs.
Operating Income
Operating income was $52.1 million or 9.6% of
sales in 2023. This is a decrease of $51.4 million from 2022 operating income of $103.5 million or 17.3% of sales.
Other Operating Income (Expense), Net
Other income data for the year ended (dollars in millions):
| | |
December
31, 2023 | | |
December
31, 2022 | | |
Change | | |
% Change |
| | |
| | | |
| | | |
| | | |
| | |
| Royalty income | |
$ | 0.6 | | |
$ | 0.8 | | |
| (0.2 | ) | |
| (21.4 | %) |
| Interest income | |
| 5.5 | | |
| 2.6 | | |
| 2.9 | | |
| 114.1 | % |
| Interest expense | |
| (0.2 | ) | |
| (0.3 | ) | |
| 0.1 | | |
| (19.9 | %) |
| Other income, net | |
| 0.8 | | |
| 1.7 | | |
| (0.9 | ) | |
| (51.4 | %) |
| | |
| | | |
| | | |
| | | |
| | |
| Other income | |
$ | 6.7 | | |
$ | 4.8 | | |
$ | 1.9 | | |
| 39.7 | % |
The increase in other income for the year ended
December 31, 2023 was the result of increases in interest income due to increased interest rates earned on short-term investments, partially
offset by decreased royalty and other income.
Income Taxes and Net Income
The
effective income tax rate was 18.0% in 2023 and 18.4% in 2022. The Company's 2023 and 2022 effective tax rate differs from the
statutory federal tax rate due principally to the availability of research and development tax credits, state income taxes, and the nondeductibility
of certain executive compensation. The impact related to research and development tax credits on the effective tax rate is expected to
decline in future years.
As a result of the foregoing factors, consolidated
net income was $48.2 million in 2023. This represents a decrease of $40.1 million from 2022 consolidated net income of $88.3 million.
Non-GAAP Financial Measure
In an effort to provide investors with additional
information regarding its results, the Company refers to various United States generally accepted accounting principles (“GAAP”)
financial measures and two non-GAAP financial measures, EBITDA and EBITDA margin, which management believes provides useful information
to investors. These non-GAAP measures may not be comparable to similarly titled measures being disclosed by other companies. In addition,
the Company believes that the non-GAAP financial measures should be considered in addition to, and not in lieu of, GAAP financial measures.
The Company believes that EBITDA and EBITDA margin are useful to understanding its operating results and the ongoing performance of its
underlying business, as EBITDA provides information on the Company’s ability to meet its capital expenditure and working capital
requirements, and is also an indicator of profitability. The Company believes that this reporting provides better transparency and comparability
to its operating results. The Company uses both GAAP and non-GAAP financial measures to evaluate its financial performance.
Non-GAAP Reconciliation – EBITDA
EBITDA
(Unaudited, dollars in thousands)
| Year ended December 31, | |
2023 | | |
2022 | |
| | |
| | |
| |
| Net income | |
$ | 48,215 | | |
$ | 88,332 | |
| | |
| | | |
| | |
| Income tax expense | |
| 10,609 | | |
| 19,947 | |
| Depreciation and amortization expense | |
| 22,383 | | |
| 25,789 | |
| Interest expense | |
| 205 | | |
| 256 | |
| Interest income | |
| (5,465 | ) | |
| (2,552 | ) |
| EBITDA | |
$ | 75,947 | | |
$ | 131,772 | |
| EBITDA margin | |
| 14.0% | | |
| 22.1% | |
| Net income margin | |
| 8.9% | | |
| 14.8% | |
EBITDA is defined as earnings before interest,
taxes, and depreciation and amortization. The Company calculates this by adding the amount of interest expense, income tax expense and
depreciation and amortization expenses that have been deducted from net income back into net income, and subtracting the amount of interest
income that was included in net income from net income to arrive at EBITDA. The Company’s EBITDA calculation also excludes any one-time
non-cash, non-operating expense.
Financial Condition
Liquidity
At
December 31, 2024, the Company had cash and cash equivalents of $10.0 million and $95.5 million in short term investments. The Company’s
pre-LIFO working capital of $264.1 million, less the LIFO reserve of $66.4 million, resulted in working capital of $197.7 million and
a current ratio of 4.2 to 1. The Company also has access to a $40 million unsecured revolving line of credit that is currently
undrawn.
Capital Resources
The Company believes that its cash flow from operations,
current cash position, and access to capital markets will continue to be sufficient to meet its anticipated cash requirements and contractual
obligations, which includes funding the Company’s capital expenditures, acquisitions, dividend payments, and share repurchases.
Operations
Cash provided by operating activities was $55.5
million, $33.9 million, and $77.2 million in 2024, 2023, and 2022, respectively. The increase in cash provided in 2024 compared to 2023
is primarily attributable to the decrease in inventory in 2024 compared to the increase in 2023, and the reduction in prepaid and other
assets compared to increases in those accounts in 2023, partially offset by reduced income in 2024.
The decrease in cash provided in 2023 compared
to 2022 is primarily attributable to the decrease in net income in 2023.
Third parties supply the Company with various
raw materials for its firearms and castings, such as fabricated steel components, walnut, birch, beech, maple and laminated lumber for
rifle stocks, wax, ceramic material, metal alloys, various synthetic products and other component parts. There is a limited supply of
these materials in the marketplace at any given time, which can cause the purchase prices to vary based upon numerous market factors.
If market conditions result in a significant prolonged inflation of certain prices or if adequate quantities of raw materials cannot be
obtained, the Company’s manufacturing processes could be interrupted and the Company’s financial condition or results of operations
could be materially adversely affected.
Investing
and Financing
Capital expenditures were $20.8 million, $15.8
million, and $27.7 million in 2024, 2023, and 2022, respectively. In 2025, the Company expects capital expenditures to approximate $20
million, much of which will relate to tooling and fixtures for new product introductions and to upgrade and modernize manufacturing equipment.
Due to market conditions and business circumstances, actual capital expenditures could vary significantly from the budgeted amount. The
Company finances, and intends to continue to finance, all of these activities with funds provided by operations and current cash.
Included in capital expenditures amount noted
above, on October 3, 2022 the Company purchased a 225,000 square foot facility, which it had previously been leasing, in Mayodan, North
Carolina for $8.3 million for use in its manufacturing and warehousing operations.
As
of December 31, 2024, the Company had $62.5 million of United States Treasury instruments which mature within one year. The Company
also invests available cash in a bank-managed money market fund that invests exclusively in United States Treasury instruments which mature
within one year. At December 31, 2024, the Company’s investment in this money market fund totaled $33.0 million.
In 2024, the Company repurchased 835,060 shares
of its common stock for $34.4 million in the open market. The average price per share purchased was $41.19. These purchases were funded
with cash on hand.
In 2023, the Company repurchased
264,062 shares of its common stock for $11.8 million in the open market. The average price per share purchased was $44.71. These purchases
were funded with cash on hand.
In 2022, the Company repurchased
4,440 shares of its common stock for $0.2 million in the open market. The average price per share purchased was $49.87. These purchases
were funded with cash on hand.
At December 31, 2024, approximately $40.3 million
remained authorized for future share repurchases.
On January 5, 2023, the Company paid a $5.00 per
share special dividend to shareholders of record on December 15, 2022.
Including the $5.00 per share special dividend
paid on January 5, 2023, the Company paid dividends totaling $11.8 million, $110.8 million, and $42.7 million in 2024, 2023, and 2022,
respectively. The quarterly dividend varies every quarter because the Company pays a percentage of earnings rather than a fixed amount
per share. The Company’s practice is to pay a dividend of approximately 40% of net income.
On February 14, 2025, the Company’s Board
of Directors authorized a dividend of 24¢ per share to shareholders of record on March 14, 2025. The payment of future dividends
depends on many factors, including internal estimates of future performance, then-current cash, and the Company’s need for funds.
The Company provides supplemental discretionary
contributions to substantially all employees’ individual 401(k) accounts.
Based on its unencumbered assets, the Company
believes it has the ability to raise cash through issuance of short-term or long-term debt.
Contractual
Obligations
At December 31, 2024, the Company had approximately
$37.5 million in agreements to purchase goods or services that are enforceable and legally binding on the Company, all of which are expected
to be settled in less than one year. Additionally, the Company has approximately $2.8 million in operating lease obligations, which will
be payable through 2034. The Company expects to fund all of these commitments with cash flows from operations and current cash.
Firearms Legislation
and Litigation
See Item 1A - Risk Factors and Note 20 to the
financial statements which are included in the Annual Report on Form 10-K for a discussion of firearms legislation and litigation.
Other Operational Matters
In the normal course of its manufacturing operations,
the Company is subject to occasional governmental proceedings and orders pertaining to workplace safety, firearms serial number tracking
and control, waste disposal, air emissions and water discharges into the environment. The Company believes that it is generally in compliance
with applicable Bureau of Alcohol, Tobacco, Firearms & Explosives, environmental, and safety regulations and the outcome of any proceedings
or orders will not have a material adverse effect on the financial position or results of operations of the Company. If these regulations
become more stringent in the future and we are not able to comply with them, such noncompliance could have a material adverse impact on
the Company.
Currently, there are 14 domestic distributors.
Additionally, the Company has 44 and 26 distributors servicing the export and law enforcement markets, respectively.
The Company self-insures a significant amount
of its product liability, workers’ compensation, medical, and other insurance. It also carries significant deductible amounts on
various insurance policies.
The Company expects to realize its deferred tax
assets through tax deductions against future taxable income.
Critical Accounting Policies and Estimates
The preparation of financial statements in accordance
with accounting principles generally accepted in the United States requires management to make assumptions and estimates that affect the
reported amounts of assets and liabilities as of the balance sheet date and net sales and expenses recognized and incurred during the
reporting period then ended. The Company bases estimates on prior experience, facts and circumstances, and other assumptions, including
those reviewed with actuarial consultants and independent counsel, when applicable, that are believed to be reasonable. However, actual
results may differ from these estimates.
The Company believes that the assumptions and judgments involved in the accounting estimates below have the greatest potential impact
on its financial statements, so the Company believes these
to be its critical accounting estimates. The methodologies applied for determining
the estimates related to the below critical accounting estimates have not changed from the prior year.
Product Liability Accrual
The Company believes the determination of its
product liability accrual is a critical accounting policy. The Company’s management reviews every lawsuit and claim and is in contact
with independent and corporate counsel on an ongoing basis. The provision for product liability claims is based upon many factors, which
vary for each case. These factors include the type of claim, nature and extent of injuries, historical settlement ranges, jurisdiction
where filed, and advice of counsel. An accrual is established for each lawsuit and claim, when appropriate, based on the nature of each
such lawsuit or claim.
Amounts are charged to product liability expense
in the period in which the Company becomes aware that a claim or, in some instances a threat of a claim, has been made when potential
losses or costs of defense are probable and can be reasonably estimated. Such amounts are determined based on the Company’s experience
in defending similar claims. Occasionally, charges are made for claims made in prior periods because the cumulative actual costs incurred
for that claim, or reasonably expected to be incurred in the future, exceed amounts already provided with respect to such claims. Likewise,
credits may be taken if cumulative actual costs incurred for that claim, or reasonably expected to be incurred in the future, are less
than amounts previously provided.
While it is not possible to forecast the outcome
of litigation or the timing of related costs, in the opinion of management, after consultation with independent and corporate counsel,
there is a remote likelihood that litigation, including punitive damage claims, will have a material adverse effect on the financial position
of the Company, but such litigation may have a material impact on the Company’s financial results and cash flows for a particular
period.
Inventory Valuation and Reserves
The Company believes the valuation of its inventory
and the related excess and obsolescence reserve is also a critical accounting policy. Inventories are carried at the lower of cost, principally
determined by the last-in, first-out (LIFO) method, or market. An actual valuation of inventory under the LIFO method is made at the end
of each year based on the inventory levels and the Company’s estimates of the prevailing costs of the many components of inventory
existing at that time.
The Company determines its excess and obsolescence
reserve by projecting the year in which inventory will be consumed into a finished product. Given ever-changing market conditions, customer
preferences and the anticipated introduction of new products, projecting the future usage of inventory is subjective. As such, it does
not seem prudent to carry inventory at full cost beyond what the Company projects to be needed during the next 36 months.
Recent Accounting Pronouncements
In November of 2023, the FASB issued ASU 2023-07,
“Segment Reporting (Topic 280): Improvements to Reportable Segment Disclosures.” The updated accounting guidance requires
enhanced reportable segment disclosures, primarily related to significant segment expenses which are regularly provided to the chief operating
decision maker. The guidance is effective for fiscal years beginning after December 15, 2023 and interim periods within fiscal years beginning
after December 15, 2024. The Company adopted ASU 2023-07, beginning with the current filing. The adoption of the new guidance required
additional disclosures, but did not have a material impact to the Company. Refer to Note 17, Operating Segment Information, for the updated
presentation
In December of 2023, the FASB issued ASU 2023-09,
“Income Taxes (Topic 740): Improvements to Income Tax Disclosures.” The updated accounting guidance requires expanded income
tax disclosures, including the disaggregation of existing disclosures related to the effective tax rate reconciliation and income taxes
paid. The guidance is effective for fiscal years beginning after December 15, 2024. Prospective application is required, with retrospective
application permitted. The Company is currently evaluating the effect the updated guidance will have on its financial statement disclosures.
In November 2024, the FASB issued ASU No. 2024-03,
“Income Statement—Reporting Comprehensive Income—Expense Disaggregation Disclosures,” which requires additional
disclosure of certain costs and expenses within the notes to the financial statements. The updated standard is effective for annual reporting
periods beginning after December 15, 2026 and interim reporting periods within annual reporting periods beginning after December 15, 2027.
The requirements will be applied prospectively with the option for retrospective application. Early adoption is permitted. The Company
is currently evaluating the effect the updated guidance will have on its financial statement disclosures.
Forward-Looking Statements and Projections
The Company may, from time to time, make forward-looking
statements and projections concerning future expectations. Such statements are based on current expectations and are subject to certain
qualifying risks and uncertainties, such as market demand, sales levels of firearms, anticipated castings sales and earnings, the need
for external financing for operations or capital expenditures, the results of pending litigation against the Company, the impact of future
firearms control and environmental legislation and accounting estimates, any one or more of which could cause actual results to differ
materially from those projected. Words such as “expect,” “believe,” “anticipate,” “intend,”
“estimate,” “will,” “should,” “could” and other words and terms of similar meaning, typically
identify such forward-looking statements. Readers are cautioned not to place undue reliance on these forward-looking statements, which
speak only as of the date made. The Company undertakes no obligation to publish revised forward-looking statements to reflect events
or circumstances after the date such forward-looking statements are made or to reflect the occurrence of subsequent unanticipated events.
ITEM 7A—QUANTITATIVE AND QUALITATIVE
DISCLOSURES ABOUT MARKET RISK
The Company is exposed to changing interest rates
on its investments, which consist primarily of United States Treasury instruments with short-term (less than one year) maturities and
cash. The interest rate market risk implicit in the Company's investments at any given time is low, as the investments mature within short
periods and the Company does not have significant exposure to changing interest rates on invested cash.
The Company has not undertaken any actions to
cover interest rate market risk and is not a party to any interest rate market risk management activities.
A hypothetical 100 basis point change in market
interest rates over the next year would not materially impact the Company’s earnings or cash flows. A hypothetical 100 basis point
change in market interest rates would not have a material effect on the fair value of the Company’s investments.
ITEM 8—FINANCIAL STATEMENTS AND SUPPLEMENTARY
DATA
INDEX TO CONSOLIDATED FINANCIAL STATEMENTS
| Reports of Independent Registered Public Accounting Firm (PCAOB ID 49) | 47 |
| | |
| Consolidated Balance Sheets at December 31, 2024 and 2023 | 50 |
| | |
| Consolidated Statements of Income and Comprehensive Income for the years ended December 31, 2024, 2023 and 2022 | 52 |
| | |
| Consolidated Statements of Stockholders’ Equity for the years ended December 31, 2024, 2023 and 2022 | 53 |
| | |
| Consolidated Statements of Cash Flows for the years ended December 31, 2024, 2023 and 2022 | 54 |
| | |
| Notes to Consolidated Financial Statements | 55 |
Report of Independent Registered Public Accounting Firm
To the Stockholders and the Board of Directors of Sturm, Ruger &
Company, Inc. and Subsidiaries
Opinion on the Internal Control Over Financial Reporting
We have audited Sturm, Ruger & Company, Inc. and Subsidiaries'
(the Company) internal control over financial reporting as of December 31, 2024, based on criteria established in Internal Control
— Integrated Framework issued by the Committee of Sponsoring Organizations of the Treadway Commission in 2013. In our opinion,
the Company maintained, in all material respects, effective internal control over financial reporting as of December 31, 2024, based on
criteria established in Internal Control — Integrated Framework issued by the Committee of Sponsoring Organizations of the
Treadway Commission in 2013.
We have also audited, in accordance with the standards of the Public
Company Accounting Oversight Board (United States) (PCAOB), the consolidated balance sheets of the Company as of December 31, 2023
and 2022, and the related consolidated statements of income and comprehensive income, stockholders' equity, and cash flows for each of
the three years in the period ended December 31, 2023, and our report dated February
19, 2025 expressed an unqualified opinion.
Basis for Opinion
The Company’s management is responsible for maintaining effective
internal control over financial reporting and for its assessment of the effectiveness of internal control over financial reporting in
the accompanying Management’s Report on Internal Control over Financial Reporting. Our responsibility is to express an opinion on
the Company’s internal control over financial reporting based on our audit. We are a public accounting firm registered with the
PCAOB and are required to be independent with respect to the Company in accordance with U.S. federal securities laws and the applicable
rules and regulations of the Securities and Exchange Commission and the PCAOB.
We conducted our audit in accordance with the standards of the PCAOB.
Those standards require that we plan and perform the audit to obtain reasonable assurance about whether effective internal control over
financial reporting was maintained in all material respects. Our audit included obtaining an understanding of internal control over financial
reporting, assessing the risk that a material weakness exists, and testing and evaluating the design and operating effectiveness of internal
control based on the assessed risk. Our audit also included performing such other procedures as we considered necessary in the circumstances.
We believe that our audit provides a reasonable basis for our opinion.
Definition and Limitations of Internal Control Over Financial
Reporting
A company's internal control over financial reporting is a process
designed to provide reasonable assurance regarding the reliability of financial reporting and the preparation of financial statements
for external purposes in accordance with generally accepted accounting principles. A company's internal control over financial reporting
includes those policies and procedures that (1) pertain to the maintenance of records that, in reasonable detail, accurately and fairly
reflect the transactions and dispositions of the assets of the company; (2) provide reasonable assurance that transactions are recorded
as necessary to permit preparation of financial statements in accordance with generally accepted accounting principles, and that receipts
and expenditures of the company are being made only in accordance with authorizations of management and directors of the company; and
(3) provide reasonable assurance regarding prevention or timely detection of unauthorized acquisition, use or disposition of the company's
assets that could have a material effect on the financial statements.
Because of its inherent limitations, internal control over financial
reporting may not prevent or detect misstatements. Also, projections of any evaluation of effectiveness to future periods are subject
to the risk that controls may become inadequate because of changes in conditions, or that the degree of compliance with the policies or
procedures may deteriorate.
/s/RSM US LLP
Stamford, Connecticut
February 19, 2025
Report of Independent Registered Public Accounting
Firm
To the Stockholders and the Board of Directors of Sturm, Ruger &
Company, Inc. and Subsidiaries
Opinion on the Financial Statements
We have audited the accompanying consolidated balance sheets of Sturm,
Ruger & Company, Inc. and its subsidiaries (the Company) as of December 31, 2024 and 2023, the related consolidated statements of
income and comprehensive income, stockholders' equity and cash flows for each of the three years in the period ended December 31, 2024,
and the related notes to the consolidated financial statements and schedule (collectively, the financial statements). In our opinion,
the financial statements present fairly, in all material respects, the financial position of the Company as of December 31, 2024 and 2023,
and the results of its operations and its cash flows for each of the three years in the period ended December 31, 2024, in conformity
with accounting principles generally accepted in the United States of America.
We have also audited, in accordance with the standards of the Public Company
Accounting Oversight Board (United States) (PCAOB), the Company's internal control over financial reporting as of December 31,
2024, based on criteria established in Internal Control — Integrated Framework issued by the Committee of Sponsoring Organizations
of the Treadway Commission in 2013, and our report dated February 19, 2025 expressed an unqualified opinion on the effectiveness of the
Company's internal control over financial reporting.
Basis for Opinion
These financial statements are the responsibility of the Company’s
management. Our responsibility is to express an opinion on the Company’s financial statements based on our audits. We are a public
accounting firm registered with the PCAOB and are required to be independent with respect to the Company in accordance with U.S. federal
securities laws and the applicable rules and regulations of the Securities and Exchange Commission and the PCAOB.
We conducted our audits in accordance with the standards of the PCAOB.
Those standards require that we plan and perform the audit to obtain reasonable assurance about whether the financial statements are free
of material misstatement, whether due to error or fraud. Our audits included performing procedures to assess the risks of material misstatement
of the financial statements, whether due to error or fraud, and performing procedures that respond to those risks. Such procedures included
examining, on a test basis, evidence regarding the amounts and disclosures in the financial statements. Our audits also included evaluating
the accounting principles used and significant estimates made by management, as well as evaluating the overall presentation of the financial
statements. We believe that our audits provide a reasonable basis for our opinion.
Critical Audit Matters
The critical audit matter communicated below is a matter arising from
the current period audit of the financial statements that was communicated or required to be communicated to the audit committee and
that: (1) relates to accounts or disclosures that are material to the financial statements and (2) involved our especially challenging,
subjective or complex judgments. The communication of critical audit matters does not alter in any way our opinion on the financial statements,
taken as a whole, and we are not, by communicating the critical audit matter below, providing a separate opinion on the critical audit
matter or on the accounts or disclosures to which it relates.
Last-In, First-Out Inventory Reserve
As described in Notes 1 and 4 to the financial statements, substantially
all of the Company’s inventories are valued at the lower of cost, which is principally determined by the last-in, first-out (LIFO)
method, or net realizable value, and the Company’s consolidated net inventories balance of $76.5 million as of December 31, 2024,
included a LIFO inventory reserve of $66.4 million. The Company records its net inventories under the LIFO method at the end of each year
based on the inventory levels at the measurement date and the prevailing inventory costs existing at that time, which are estimated using
a complex manual calculation.
We identified the LIFO inventory reserve as a critical audit matter
because of the complexities of the manual calculations performed by management to estimate the prevailing inventory costs, which includes
calculations to estimate current year price level changes through the development of a prior year and a current year cumulative price
index. Auditing management’s estimate of the LIFO inventory reserve was complex and required a high degree of auditor judgement
and increased audit effort due to the complexities of management’s manual calculations.
Our audit procedures related to the Company’s LIFO inventory
reserve included the following, among others:
| ● | We obtained an understanding of the relevant controls
related to the LIFO inventory reserve and tested such controls for design and operating effectiveness, including controls related to
management’s review of the calculations related to the estimate of the current year price level changes, the calculation of
the cumulative price indexes, and the estimate of the LIFO inventory reserve. |
| ● | We tested the completeness, accuracy, and relevance of the
significant underlying data used in management’s estimate of the current year price level changes, the calculation of cumulative
price index and the LIFO inventory reserve. |
| ● | We tested the mathematical accuracy of the Company’s
calculation to estimate the LIFO inventory reserve. |
| ● | We evaluated the appropriateness of management’s methodologies
to develop the estimate of the LIFO inventory reserve. |
| ● | We evaluated the reasonableness of management’s estimate
of the current year price level changes by comparing management’s estimate to external market data. |
/s/RSM US LLP
We have served as the Company’s auditor since 2005.
Stamford, Connecticut
February 19, 2025
Consolidated Balance Sheets
(Dollars in thousands, except per share data)
| December 31, | |
2024 | | |
2023 | |
| | |
| | |
| |
| Assets | |
| | | |
| | |
| | |
| | | |
| | |
| Current Assets | |
| | | |
| | |
| Cash and cash equivalents | |
$ | 10,028 | | |
$ | 15,174 | |
| Short-term investments | |
| 95,453 | | |
| 102,485 | |
| Trade receivables, net | |
| 67,145 | | |
| 59,864 | |
| | |
| | | |
| | |
| Gross inventories | |
| 149,417 | | |
| 150,192 | |
| Less LIFO reserve | |
| (66,398 | ) | |
| (64,262 | ) |
| Less excess and obsolescence reserve | |
| (6,533 | ) | |
| (6,120 | ) |
| Net inventories | |
| 76,486 | | |
| 79,810 | |
| | |
| | | |
| | |
| Prepaid expenses and other current assets | |
| 9,245 | | |
| 14,062 | |
| Total Current Assets | |
| 258,357 | | |
| 271,395 | |
| | |
| | | |
| | |
| Property, plant and equipment | |
| 477,622 | | |
| 462,397 | |
| Less allowances for depreciation | |
| (406,373 | ) | |
| (390,863 | ) |
| Net property, plant and equipment | |
| 71,249 | | |
| 71,534 | |
| | |
| | | |
| | |
| Deferred income taxes | |
| 16,681 | | |
| 11,976 | |
| Other assets | |
| 37,747 | | |
| 43,912 | |
| Total Assets | |
$ | 384,034 | | |
$ | 398,817 | |
See accompanying notes to consolidated financial statements.
| December 31, | |
2024 | | |
2023 | |
| | |
| | |
| |
| Liabilities and Stockholders’ Equity | |
| | | |
| | |
| | |
| | | |
| | |
| Current Liabilities | |
| | | |
| | |
| | |
| | | |
| | |
| Trade accounts payable and accrued expenses | |
$ | 35,750 | | |
$ | 31,708 | |
| Contract liabilities with customers (Note 2) | |
| — | | |
| 149 | |
| Product liability | |
| 431 | | |
| 634 | |
| Employee compensation and benefits | |
| 18,824 | | |
| 24,660 | |
| Workers’ compensation | |
| 5,804 | | |
| 6,044 | |
| Total Current Liabilities | |
| 60,809 | | |
| 63,195 | |
| | |
| | | |
| | |
| Lease liability (Note 7) | |
| 1,747 | | |
| 2,170 | |
| Employee compensation | |
| 1,835 | | |
| 1,685 | |
| Product liability accrual | |
| 61 | | |
| 46 | |
| | |
| | | |
| | |
| Contingent liabilities (Note 20) | |
| — | | |
| — | |
| | |
| | | |
| | |
| Stockholders’ Equity | |
| | | |
| | |
| Common stock, non-voting, par value $1: | |
| | | |
| | |
| Authorized shares – 50,000; none issued | |
| | | |
| | |
| Common stock, par value $1: | |
| | | |
| | |
| Authorized shares – 40,000,000 | |
| | | |
| | |
| 2024 – 24,467,983 issued, | |
| | | |
| | |
| 16,790,824 outstanding | |
| | | |
| | |
| 2023 – 24,437,020 issued, | |
| | | |
| | |
| 17,458,620 outstanding | |
| 24,468 | | |
| 24,437 | |
| Additional paid-in capital | |
| 50,536 | | |
| 46,849 | |
| Retained earnings | |
| 436,609 | | |
| 418,058 | |
| Less: Treasury stock – at cost | |
| | | |
| | |
| 2024 – 7,677,159 shares | |
| | | |
| | |
| 2023 – 6,978,400 shares | |
| (192,031 | ) | |
| (157,623 | ) |
| Total Stockholders’ Equity | |
| 319,582 | | |
| 331,721 | |
| Total Liabilities and Stockholders’ Equity | |
$ | 384,034 | | |
$ | 398,817 | |
See accompanying notes to consolidated financial statements.
Consolidated Statements of Income and Comprehensive Income
(In thousands, except per share data)
| Year ended December 31, | |
| 2024 | | |
| 2023 | | |
| 2022 | |
| | |
| | | |
| | | |
| | |
| Net firearms sales | |
$ | 532,608 | | |
$ | 540,746 | | |
$ | 593,289 | |
| Net castings sales | |
| 3,035 | | |
| 3,021 | | |
| 2,553 | |
| Total net sales | |
| 535,643 | | |
| 543,767 | | |
| 595,842 | |
| | |
| | | |
| | | |
| | |
| Cost of products sold | |
| 421,228 | | |
| 410,148 | | |
| 415,757 | |
| | |
| | | |
| | | |
| | |
| Gross profit | |
| 114,415 | | |
| 133,619 | | |
| 180,085 | |
| | |
| | | |
| | | |
| | |
| Operating Expenses (Income): | |
| | | |
| | | |
| | |
| Selling | |
| 38,755 | | |
| 38,788 | | |
| 36,114 | |
| General and administrative | |
| 44,006 | | |
| 42,752 | | |
| 40,551 | |
| Other operating income, net | |
| — | | |
| (5 | ) | |
| (36 | ) |
| Total operating expenses | |
| 82,761 | | |
| 81,535 | | |
| 76,629 | |
| | |
| | | |
| | | |
| | |
| Operating income | |
| 31,654 | | |
| 52,084 | | |
| 103,456 | |
| | |
| | | |
| | | |
| | |
| Other income: | |
| | | |
| | | |
| | |
| Royalty income | |
| 857 | | |
| 658 | | |
| 837 | |
| Interest income | |
| 4,885 | | |
| 5,465 | | |
| 2,552 | |
| Interest expense | |
| (102 | ) | |
| (205 | ) | |
| (256 | ) |
| Other income, net | |
| 481 | | |
| 822 | | |
| 1,690 | |
| Total other income, net | |
| 6,121 | | |
| 6,740 | | |
| 4,823 | |
| | |
| | | |
| | | |
| | |
| Income before income taxes | |
| 37,775 | | |
| 58,824 | | |
| 108,279 | |
| | |
| | | |
| | | |
| | |
| Income taxes | |
| 7,212 | | |
| 10,609 | | |
| 19,947 | |
| | |
| | | |
| | | |
| | |
| Net income and comprehensive income | |
$ | 30,563 | | |
$ | 48,215 | | |
$ | 88,332 | |
| | |
| | | |
| | | |
| | |
| | |
| | | |
| | | |
| | |
| Basic Earnings Per Share | |
$ | 1.79 | | |
$ | 2.73 | | |
$ | 5.00 | |
| | |
| | | |
| | | |
| | |
| Diluted Earnings Per Share | |
$ | 1.77 | | |
$ | 2.71 | | |
$ | 4.96 | |
| | |
| | | |
| | | |
| | |
| Weighted average number of common shares outstanding – Basic | |
| 17,088,205 | | |
| 17,676,955 | | |
| 17,648,850 | |
| | |
| | | |
| | | |
| | |
| Weighted average number of common shares outstanding – Diluted | |
| 17,270,101 | | |
| 17,811,218 | | |
| 17,793,348 | |
| | |
| | | |
| | | |
| | |
| Cash Dividends Per Share | |
$ | 0.69 | | |
$ | 6.27 | | |
$ | 2.42 | |
See accompanying notes to consolidated financial statements.
Consolidated Statements of Stockholders’ Equity
(Dollars in thousands)
| | |
| Common
Stock | | |
| Additional
Paid-in
Capital | | |
| Retained
Earnings | | |
| Treasury
Stock | | |
| Total | |
| Balance at December 31, 2021 | |
$ | 24,306 | | |
$ | 46,847 | | |
$ | 438,098 | | |
$ | (145,590 | ) | |
$ | 363,661 | |
| Net income | |
| | | |
| | | |
| 88,332 | | |
| | | |
| 88,332 | |
| Dividends paid | |
| | | |
| | | |
| (42,718 | ) | |
| | | |
| (42,718 | ) |
| Stock-based compensation | |
| | | |
| 1,671 | | |
| | | |
| | | |
| 1,671 | |
| Vesting of RSU’s | |
| | | |
| (3,371 | ) | |
| | | |
| | | |
| (3,371 | ) |
| Common stock issued – compensation plans | |
| 72 | | |
| (72 | ) | |
| | | |
| | | |
| — | |
| Unpaid dividends accrued | |
| | | |
| | | |
| (90,615 | ) | |
| | | |
| (90,615 | ) |
| Repurchase of 4,440 shares of common stock | |
| | | |
| | | |
| | | |
| (222 | ) | |
| (222 | ) |
| Balance at December 31, 2022 | |
| 24,378 | | |
| 45,075 | | |
| 393,097 | | |
| (145,812 | ) | |
| 316,738 | |
| Net income | |
| | | |
| | | |
| 48,215 | | |
| | | |
| 48,215 | |
| Dividends paid | |
| | | |
| | | |
| (22,446 | ) | |
| | | |
| (22,446 | ) |
| Stock-based compensation | |
| | | |
| 3,989 | | |
| | | |
| | | |
| 3,989 | |
| Vesting of RSU’s | |
| | | |
| (2,156 | ) | |
| | | |
| | | |
| (2,156 | ) |
| Common stock issued – compensation plans | |
| 59 | | |
| (59 | ) | |
| | | |
| | | |
| — | |
| Unpaid dividends accrued | |
| | | |
| | | |
| (808 | ) | |
| | | |
| (808 | ) |
| Repurchase of 264,062 shares of common stock | |
| | | |
| | | |
| | | |
| (11,811 | ) | |
| (11,811 | ) |
| Balance at December 31, 2023 | |
| 24,437 | | |
| 46,849 | | |
| 418,058 | | |
| (157,623 | ) | |
| 331,721 | |
| Net income | |
| | | |
| | | |
| 30,563 | | |
| | | |
| 30,563 | |
| Dividends paid | |
| | | |
| | | |
| (11,829 | ) | |
| | | |
| (11,829 | ) |
| Stock-based compensation | |
| | | |
| 4,342 | | |
| | | |
| | | |
| 4,342 | |
| Vesting of RSU’s | |
| | | |
| (624 | ) | |
| | | |
| | | |
| (624 | ) |
| Common stock issued – compensation plans | |
| 31 | | |
| (31 | ) | |
| | | |
| | | |
| — | |
| Unpaid dividends accrued | |
| | | |
| | | |
| (183 | ) | |
| | | |
| (183 | ) |
| Repurchase of 835,060 shares of common stock | |
| | | |
| | | |
| | | |
| (34,408 | ) | |
| (34,408 | ) |
| Balance at December 31, 2024 | |
$ | 24,468 | | |
$ | 50,536 | | |
$ | 436,609 | | |
$ | (192,031 | ) | |
$ | 319,582 | |
See accompanying notes to consolidated financial statements.
Consolidated Statements of Cash Flows
(In thousands)
| Year ended December 31, | |
| 2024 | | |
| 2023 | | |
| 2022 | |
| | |
| | | |
| | | |
| | |
| Operating Activities | |
| | | |
| | | |
| | |
| Net income | |
$ | 30,563 | | |
$ | 48,215 | | |
$ | 88,332 | |
| Adjustments to reconcile net income to cash provided by operating activities: | |
| | | |
| | | |
| | |
| Depreciation and amortization | |
| 22,063 | | |
| 22,383 | | |
| 25,789 | |
| Stock-based compensation | |
| 4,342 | | |
| 3,989 | | |
| 1,671 | |
| Excess and obsolescence inventory reserve | |
| 413 | | |
| 1,308 | | |
| 501 | |
| Gain on sale of assets | |
| — | | |
| (5 | ) | |
| (36 | ) |
| Deferred income taxes | |
| (4,705 | ) | |
| (5,867 | ) | |
| (5,573 | ) |
| Changes in operating assets and liabilities: | |
| | | |
| | | |
| | |
| Trade receivables | |
| (7,281 | ) | |
| 5,585 | | |
| (8,413 | ) |
| Inventories | |
| 2,911 | | |
| (16,125 | ) | |
| (21,644 | ) |
| Trade accounts payable and accrued expenses | |
| 3,789 | | |
| (4,406 | ) | |
| (640 | ) |
| Contract liability with customers | |
| (149 | ) | |
| (882 | ) | |
| 1,031 | |
| Employee compensation and benefits | |
| (5,869 | ) | |
| (6,469 | ) | |
| (3,420 | ) |
| Product liability | |
| (188 | ) | |
| 372 | | |
| (584 | ) |
| Prepaid expenses, other assets and other liabilities | |
| 9,615 | | |
| (13,026 | ) | |
| (954 | ) |
| Income taxes receivable/payable | |
| — | | |
| (1,171 | ) | |
| 1,171 | |
| Cash provided by operating activities | |
| 55,504 | | |
| 33,901 | | |
| 77,231 | |
| | |
| | | |
| | | |
| | |
| Investing Activities | |
| | | |
| | | |
| | |
| Property, plant and equipment additions | |
| (20,821 | ) | |
| (15,796 | ) | |
| (27,730 | ) |
| Purchases of short-term investments | |
| (138,885 | ) | |
| (192,627 | ) | |
| (365,480 | ) |
| Proceeds from maturity of short-term investments | |
| 145,917 | | |
| 249,274 | | |
| 406,319 | |
| Net proceeds from sale of assets | |
| — | | |
| 5 | | |
| 100 | |
| Cash (used for) provided by investing activities | |
| (13,789 | ) | |
| 40,856 | | |
| 13,209 | |
| | |
| | | |
| | | |
| | |
| Financing Activities | |
| | | |
| | | |
| | |
| Dividends paid | |
| (11,829 | ) | |
| (110,789 | ) | |
| (42,718 | ) |
| Repurchase of common stock | |
| (34,408 | ) | |
| (11,811 | ) | |
| (222 | ) |
| Payment of employee withholding tax related to share-based compensation | |
| (624 | ) | |
| (2,156 | ) | |
| (3,371 | ) |
| Cash used for financing activities | |
| (46,861 | ) | |
| (124,756 | ) | |
| (46,311 | ) |
| | |
| | | |
| | | |
| | |
| (Decrease) increase in cash and cash equivalents | |
| (5,146 | ) | |
| (49,999 | ) | |
| 44,129 | |
| Cash and cash equivalents at beginning of year | |
| 15,174 | | |
| 65,173 | | |
| 21,044 | |
| Cash and cash equivalents at end of year | |
$ | 10,028 | | |
$ | 15,174 | | |
$ | 65,173 | |
See accompanying notes to consolidated financial statements.
Notes to Consolidated Financial Statements
(Dollars in thousands, except per share)
1. Summary of Significant Accounting Policies
Organization
Sturm, Ruger & Company, Inc. (the “Company”)
is principally engaged in the design, manufacture, and sale of firearms to domestic customers. Approximately 99% of sales were from firearms.
Export sales represented approximately 5% of firearms sales. The Company’s design and manufacturing operations are located in the
United States and almost all product content is domestic. The Company’s firearms are sold through a select number of independent
wholesale distributors principally to the commercial sporting market.
The Company manufactures investment castings made
from steel alloys and metal injection molding (“MIM”) parts for internal use in its firearms and utilizes available capacity
to manufacture and sell investment castings and MIM parts to unaffiliated, third-party customers. Castings were less than 1% of the Company’s
total sales for the year ended December 31, 2024.
Preparation
of Financial Statements
The Company follows United States generally accepted
accounting principles (“GAAP”). The preparation of financial statements in conformity with GAAP requires management to make
estimates and assumptions that affect the reported amounts of assets and liabilities and disclosure of contingent liabilities at the date
of the financial statements and the reported amounts of revenues and expenses during the reporting period. Actual results could differ
from these estimates.
The significant accounting policies described
below, together with the notes that follow, are an integral part of the consolidated financial statements.
Principles
of Consolidation
The consolidated financial statements include
the accounts of the Company and its wholly owned subsidiaries. All significant intercompany accounts and transactions have been eliminated.
Revenue Recognition
The Company recognizes revenue in accordance with
the provisions of Accounting Standards Codification Topic 606, Revenue from Contracts with Customers (“ASC 606”), which became
effective January 1, 2018. Substantially all product sales are sold FOB (free on board) shipping point. Customary payment terms are 2%
30 days, net 40 days. Generally, all performance obligations are satisfied when product is shipped and the customer takes ownership and
assumes the risk of loss. In some instances, sales include multiple performance obligations. The most common of these instances relates
to sales promotion programs under which downstream customers are entitled to receive no charge products based on their purchases of certain
of the Company’s products from the independent distributors. The fulfillment of these no charge products
is the Company’s
responsibility. In such instances, the Company allocates the revenue of the promotional sales based on the estimated level of participation
in the sales promotional program and the timing of the shipment of all of the firearms included in the promotional program, including
the no charge firearms. Revenue is recognized proportionally as each performance obligation is satisfied, based on the relative customary
price of each product. Customary prices are generally determined based on the prices charged to the independent distributors. The net
change in contract liabilities for a given period is reported as an increase or decrease to sales. The Company accounts for cash sales
discounts as a reduction in sales. Amounts billed to customers for shipping and handling fees are included in net sales and costs incurred
by the Company for the delivery of goods are classified as selling expenses. Federal excise taxes are excluded from net sales.
Cash and
Cash Equivalents
The Company considers interest-bearing deposits
with financial institutions with remaining maturities of three months or less at the time of acquisition to be cash equivalents.
Fair Value
Measurements of Short-term Investments
Fair value is defined as the price that would
be received to sell an asset or paid to transfer a liability in an orderly transaction between market participants in the principal or
most advantageous market at the measurement date. Fair value is established according to a hierarchy that prioritizes observable and unobservable
inputs used to measure fair value into three broad levels, which are described below:
Level 1: Unadjusted quoted prices in
active markets that are accessible at the measurement date for assets or liabilities. The fair value hierarchy gives the highest priority
to Level 1 inputs.
Level 2: Observable prices that are
based on inputs not quoted on active markets, but corroborated by market data.
Level 3: Unobservable inputs are used
when little or no market data is available. Level 3 inputs are given the lowest priority in the fair value hierarchy.
The asset or liability’s fair value measurement
level within the fair value hierarchy is based on the lowest level of any input that is significant to the fair value measurement. Valuation
techniques used need to maximize the use of observable inputs and minimize the use of unobservable inputs.
As
of December 31, 2024, the Company’s short-term investments consist of U.S. Treasury instruments (Level 1), maturing within one year,
and investments in a bank-managed money market fund that invests exclusively in United States Treasury obligations and is valued
at the net asset value ("NAV") daily closing price, as reported by the fund, based on the amortized cost of the fund’s
securities (Level 2). For the bank-managed money market fund, the NAV
is used as a practical expedient to estimate fair value. This practical expedient is not used when it is determined to be probable that
the fund will sell the investment for an amount different than the reported NAV.
Such securities are classified as held to maturity, since the Company has the intent and ability to do so, and are carried at cost plus
accrued interest, which approximates fair value.
The fair value of inventory acquired as part of
business combination is based on a third-party valuation utilizing the comparable sales method which is based on Level 2 and Level 3 inputs.
The fair value of property, plant and equipment acquired as part of business combination is based on a third-party valuation utilizing
the indirect method of cost approach, which is based on Level 2 and Level 3 inputs. The fair value of patents acquired as part of business
combination is based on a third-party valuation utilizing the replacement cost method, which is based on Level 2 and Level 3 inputs. The
fair value of the remaining intangible assets as part of business combination are based on a third-party valuation utilizing discounted
cash flow methods that involves inputs, which are not observable in the market (Level 3).
Accounts Receivable
The Company establishes an allowance for doubtful
accounts based on the creditworthiness of its customers and historical experience. While the Company uses the best information available
to make its evaluation, future adjustments to the allowance for doubtful accounts may be necessary if there are significant changes in
economic and industry conditions or any other factors considered in the Company’s evaluation. Bad debt expense has been immaterial
during each of the last three years. The Company mitigates its credit risk by maintaining credit insurance on most of its significant
customers.
Inventories
Substantially all of the Company’s inventories
are valued at the lower of cost, principally determined by the last-in, first-out (LIFO) method, or net realizable value. Elements of
cost in inventories include raw materials, direct labor and manufacturing overhead.
Property,
Plant and Equipment
Property, plant and equipment are carried at cost.
Depreciation is computed over useful lives using the straight-line and declining balance methods predominately over 15 years for buildings,
7 years for machinery and equipment and 3 years for tools and dies. When assets are retired, sold or otherwise disposed of, their gross
carrying values and related accumulated depreciation are removed from the accounts and a gain or loss on such disposals is recognized
when appropriate.
Maintenance and repairs are charged to operations;
replacements and improvements are capitalized.
Long-lived Assets
The Company evaluates the carrying value of long-lived
assets to be held and used when events or changes in circumstances indicate the carrying value may not be recoverable. In performing this
review, the carrying value of the assets is compared to the projected undiscounted cash flows to be generated from the assets. If the
sum of the undiscounted expected future cash flows is less than the carrying value of the assets, the assets are considered to be impaired.
Impairment losses are measured as the amount by which the carrying value of the assets exceeds their fair value. The Company bases fair
value of the assets on quoted market prices if available or, if not available, quoted market prices of similar assets. Where quoted market
prices are not available, the Company
estimates fair value using the estimated future cash flows generated by the assets discounted at
a rate commensurate with the risks associated with the recovery of the assets. As of December 31, 2024, the Company does not believe there
are any indications of impairment related to long-lived assets.
Goodwill
The Company’s goodwill represents the excess
of the purchase price of business combinations over the fair value of the net assets acquired. We assess goodwill for impairment on an
annual basis during the fourth quarter of each year, and between annual tests whenever events or changes in circumstances indicate that
the carrying amount may not be recoverable. An impairment exists by the amount the fair value of a reporting unit to which goodwill has
been allocated is less than their respective carrying values. The impairment for goodwill is limited to the total amount of goodwill allocated
to the reporting unit. Goodwill impairment testing requires significant judgment and management estimates, including, but not limited
to, the determination of (i) the number of reporting units, (ii) the goodwill and other assets and liabilities to be allocated
to the reporting units and (iii) the fair values of the reporting units. The estimates and assumptions described above, along with
other factors such as discount rates, will significantly affect the outcome of the impairment tests and the amounts of any resulting impairment
losses. As of December 31, 2024, the Company does not believe there are any indications of impairment related to goodwill.
Income Taxes
Income taxes are accounted for using the asset
and liability method. Under this method, deferred income taxes are recognized for the tax consequences of “temporary differences”
by applying enacted statutory rates applicable to future years to temporary differences between the financial statement carrying amounts
and the tax basis of the Company’s assets and liabilities.
Product Liability
The Company provides for product liability claims
including estimated legal costs to be incurred defending such claims. The provision for product liability claims is charged to cost of
products sold.
Advertising Costs
The Company includes advertising costs in selling
expenses and these costs are expensed as incurred. Advertising costs for 2024, 2023, and 2022, were $3.4 million, $3.1 million, and $2.4
million, respectively.
Shipping
Costs
Costs incurred related to the shipment of products
are included in selling expense. Such costs totaled $4.3 million, $4.4 million, and $4.7 million in 2024, 2023, and 2022, respectively.
Research and Development
In 2024, 2023, and 2022, the Company spent approximately
$8.2 million, $9.8 million, and $9.6 million, respectively, on research and development activities relating to new products and the improvement
of existing products. These costs are included in costs of products sold and are expensed as incurred. These costs are capitalized for
tax purposes under the provisions of the Tax Cuts and Jobs Act of 2017 that relate to IRS Code Section 174, as discussed in Note 13.
Earnings per Share
Basic earnings per share is based upon the weighted-average
number of shares of common stock outstanding during the year. Diluted earnings per share reflect the impact of restricted stock units
and deferred stock outstanding using the treasury stock method.
Recent Accounting Pronouncements
In November of 2023, the FASB issued ASU 2023-07,
“Segment Reporting (Topic 280): Improvements to Reportable Segment Disclosures.” The updated accounting guidance requires
enhanced reportable segment disclosures, primarily related to significant segment expenses which are regularly provided to the chief operating
decision maker. The guidance is effective for fiscal years beginning after December 15, 2023 and interim periods within fiscal years beginning
after December 15, 2024. The Company adopted ASU 2023-07, beginning with the current filing. The adoption of the new guidance required
additional disclosures, but did not have a material impact to the Company. Refer to Note 17, Operating Segment Information, for the updated
presentation.
In December of 2023, the FASB issued ASU 2023-09,
“Income Taxes (Topic 740): Improvements to Income Tax Disclosures.” The updated accounting guidance requires expanded income
tax disclosures, including the disaggregation of existing disclosures related to the effective tax rate reconciliation and income taxes
paid. The guidance is effective for fiscal years beginning after December 15, 2024. Prospective application is required, with retrospective
application permitted. The Company is currently evaluating the effect the updated guidance will have on its financial statement disclosures.
In November 2024, the FASB issued ASU No. 2024-03,
“Income Statement—Reporting Comprehensive Income—Expense Disaggregation Disclosures,” which requires additional
disclosure of certain costs and expenses within the notes to the financial statements. The updated standard is effective for annual reporting
periods beginning after December 15, 2026 and interim reporting periods within annual reporting periods beginning after December 15,
2027. The requirements will be applied prospectively with the option for retrospective application. Early adoption is permitted. The
Company is currently evaluating the effect the updated guidance will have on its financial statement disclosures.
2. Revenue Recognition and Contracts with Customers
The impact of ASC 606
on revenue recognized during the years ended December 31, 2024, December 31, 2023, and December 31, 2022 is as follows:
| | |
2024 | | |
2023 | | |
2022 | |
| Contract liabilities with customers at January 1, | |
$ | 149 | | |
$ | 1,031 | | |
$ | — | |
| | |
| | | |
| | | |
| | |
| Revenue recognized | |
| (149 | ) | |
| (4,084 | ) | |
| — | |
| | |
| | | |
| | | |
| | |
| Revenue deferred | |
| — | | |
| 3,202 | | |
| 1,031 | |
| | |
| | | |
| | | |
| | |
| Contract liabilities with customers at December 31, | |
$ | — | | |
$ | 149 | | |
$ | 1,031 | |
During the year ended December 31, 2024, the Company
did not defer any revenue and recognized $0.1 million of revenue previously deferred as the performance obligations relating to the shipment
of free products were satisfied. This resulted in a net increase in firearms sales for the year ended December 31, 2024 of $0.1 million
and there being no deferred contract revenue liability at December 31, 2024.
During the year ended December 31, 2023, the Company
deferred $3.2 million of revenue, offset by the recognition of $4.1 million of revenue previously deferred as the performance obligations
relating to the shipment of free products were satisfied. This resulted in a net increase in firearms sales for the year ended December
31, 2023 of $0.9 million and a deferred contract revenue liability at December 31, 2023 of $0.1 million.
During the year ended December 31, 2022, the Company
deferred $1.0 million of revenue. There was no offset for the recognition from previously deferred revenue as the Company did not satisfy
any performance obligations relating to the shipment of free products during the year. This resulted in a net decrease in firearms sales
for the year ended December 31, 2022 of $1.0 million and a deferred contract revenue liability at December 31, 2022 of $1.0 million.
Practical Expedients and Exemptions
The Company has elected to account for shipping
and handling activities that occur after control of the related product transfers to the customer as fulfillment activities that are
recognized upon shipment of the goods.
3. Trade Receivables, Net
Trade receivables consist of the following:
| December 31, | |
2024 | | |
2023 | |
| | |
| | |
| |
| Trade receivables | |
$ | 68,855 | | |
$ | 61,428 | |
| Allowance for doubtful accounts | |
| (400 | ) | |
| (400 | ) |
| Allowance for discounts | |
| (1,310 | ) | |
| (1,164 | ) |
| | |
$ | 67,145 | | |
$ | 59,864 | |
In 2024, the largest individual trade receivable
balances accounted for 26%, 20%, 14%, and 11% of total trade receivables, respectively.
In 2023, the largest individual trade receivable
balances accounted for 22%, 20%, and 17% of total trade receivables, respectively.
4. Inventories
Inventories consist of the following:
| December 31, | |
2024 | | |
2023 | |
Inventory at FIFO | |
| | | |
| | |
| Finished goods | |
$ | 26,022 | | |
$ | 30,989 | |
| Materials and products in process | |
| 123,395 | | |
| 119,203 | |
| Gross inventories | |
| 149,417 | | |
| 150,192 | |
| Less: LIFO reserve | |
| (66,398 | ) | |
| (64,262 | ) |
| Less: excess and obsolescence reserve | |
| (6,533 | ) | |
| (6,120 | ) |
| Net inventories | |
$ | 76,486 | | |
$ | 79,810 | |
5. Property, Plant and Equipment
Property, plant and equipment consist of the following:
| December 31, | |
2024 | | |
2023 | |
| | |
| | | |
| | |
| Land and improvements | |
$ | 2,826 | | |
$ | 2,826 | |
| Buildings and improvements | |
| 76,153 | | |
| 74,650 | |
| Machinery and equipment | |
| 333,365 | | |
| 322,730 | |
| Dies and tools | |
| 65,278 | | |
| 62,191 | |
| Property, plant and equipment | |
| 477,622 | | |
| 462,397 | |
| Less allowances for depreciation | |
| (406,373 | ) | |
| (390,863 | ) |
| Net property, plant and equipment | |
$ | 71,249 | | |
$ | 71,534 | |
Depreciation expense totaled $21.1 million, $21.1
million, and $24.4 million in 2024, 2023, and 2022, respectively.
6. Other Assets
Other assets consist of the following:
| December 31, | |
2024 | | |
2023 | |
| | |
| | |
| |
| Patents, at cost | |
$ | 10,339 | | |
$ | 10,280 | |
| Deposits on capital items | |
| 18,443 | | |
| 23,045 | |
| Marlin trade name, at cost | |
| 7,800 | | |
| 7,800 | |
| Accumulated amortization | |
| (8,008 | ) | |
| (7,171 | ) |
| Other | |
| 9,173 | | |
| 9,958 | |
| | |
$ | 37,747 | | |
$ | 43,912 | |
The capitalized cost of patents is amortized using
the straight-line method over their useful lives. Expenses related to patent amortization was $0.5 million in 2024, $0.4 million in 2023,
and $0.4 million in 2022. The estimated annual patent amortization expense for each of the next five years is $0.4 million. Costs incurred
to maintain existing patents are charged to expense in the year incurred. The Marlin trade name will be amortized using the straight-line
method over its useful life. The estimated annual trade name amortization cost for each of the next five years is $0.4 million. The intangible
asset related to Marlin customer relationships are included in Other above and will be amortized using the straight-line method over its
useful life. The estimated annual customer relationship name amortization expense for each of the next five years is $0.1 million.
7. Leased Assets
The Company leases certain of its real estate
and equipment. The Company has evaluated all its leases and determined that all are operating leases under the definitions of the guidance
of ASU 2016-02. The Company’s lease agreements generally do not require material variable lease payments, residual value guarantees
or restrictive covenants.
The Company uses the effective interest method
to record right-of-use assets equal to the present value of the contractual liability for future lease payments. The table below presents
the right-of-use assets and related lease liabilities recognized on the condensed consolidated balance sheet as of December 31, 2024:
| | | Balance Sheet Line
Item | | December 31,
2024 | | | December 31,
2023 | |
| | | | | | | | | | | |
| Right-of-use assets | | Other assets | | $ | 2,345 | | | $ | 2,781 | |
| | | | | | | | | | | |
| Operating lease liabilities | | | | | | | | | | |
| | | | | | | | | | | |
| Current portion | | Trade accounts payable and accrued expenses | | $ | 598 | | | $ | 611 | |
| | | | | | | | | | | |
| Noncurrent portion | | Lease liabilities | | | 1,747 | | | | 2,170 | |
| | | | | | | | | | | |
| Total operating lease liabilities | | | | $ | 2,345 | | | $ | 2,781 | |
The depreciable lives of right-of-use assets are
limited by the lease term and are amortized on a straight line basis over the life of the lease.
The Company’s leases generally do not provide
an implicit interest rate, and therefore the Company calculates an incremental borrowing rate to determine the present value of its operating
lease liabilities.
The table below includes cash
paid for our operating lease liabilities, other non-cash information, our weighted average remaining lease term and weighted average discount
rate:
| | | Year Ended | |
| | | December 31,
2024 | | | December 31,
2023 | |
| | | | | | | |
| Cash paid for amounts included in the measurement of lease liabilities | | $ | 796 | | | $ | 796 | |
| | | | | | | | | |
| Cash amounts paid for short-term leases | | $ | 449 | | | $ | 565 | |
| | | | | | | | | |
| Right-of-use assets obtained in exchange for lease liabilities | | $ | — | | | $ | — | |
| | | | | | | | | |
| Weighted average remaining lease term (years) | | | 7.7 | | | | 7.9 | |
| | | | | | | | | |
| Weighted average discount rate | | | 8.0% | | | | 5.0% | |
The following table reconciles the undiscounted future minimum lease
payments to the total operating lease liabilities recognized on the condensed consolidated balance sheet as of December 31, 2024:
| 2025 | |
$ | 765 | |
| 2026 | |
| 771 | |
| 2027 | |
| 295 | |
| 2028 | |
| 160 | |
| 2029 | |
| 160 | |
| Thereafter | |
| 800 | |
| Total undiscounted future minimum lease payments | |
| 2,951 | |
| Less: Difference between undiscounted lease payments & the present value of future lease payments | |
| (606 | ) |
| Total operating lease liabilities | |
$ | 2,345 | |
Certain of the Company’s lease agreements
contain renewal options at the Company’s discretion. The Company does not recognize right-of-use assets or lease liabilities for
leases of one year or less or for renewal periods unless it is reasonably certain that the Company will exercise the renewal option at
the inception of the lease or when a triggering event occurs. The Company’s weighted average remaining lease term for operating
leases as of December 31, 2024 is 7.7 years.
8. Trade Accounts Payable and Accrued Expenses
Trade accounts payable and accrued expenses consist
of the following:
| December 31, | |
2024 | | |
2023 | |
| | |
| | |
| |
| Trade accounts payable | |
$ | 13,170 | | |
$ | 11,100 | |
| Federal excise taxes payable | |
| 13,192 | | |
| 11,954 | |
| Accrued other | |
| 9,388 | | |
| 8,654 | |
| | |
$ | 35,750 | | |
$ | 31,708 | |
9. Accrued Dividends
On November 30, 2022, the Company’s Board
of Directors declared a $5.00 per share special dividend payable on January 5, 2023 to stockholders of record as of December 15, 2022.
The dividend, which totaled $88.3 million, was paid on January 5, 2023.
10. Line of Credit
On January 7, 2022, the Company entered into a
three-year, $40 million unsecured revolving line of credit agreement with a bank. On June 6, 2024, the Company amended its existing line
of credit agreement, which now expires January 7, 2028. Borrowings under this new facility bear interest at the applicable Secured Overnight
Financing Rate (SOFR), plus 150 basis points, plus an additional adjustment of eight basis points. The Company is also charged one-quarter
of a percent
(0.25%) per year on the unused portion. At December 31, 2024, the Company was in compliance with the terms and covenants
of the credit facility.
11. Employee Benefit Plans
The Company sponsors a qualified defined-contribution
401(k) plan that covers substantially all of its employees. Under the terms of the 401(k) plan, the Company matches a certain portion
of employee contributions to their individual 401(k) accounts using the “safe harbor” guidelines provided in the Internal
Revenue Code. Expenses related to matching employee contributions to the 401(k) plan were $4.1 million, $4.7 million, and $4.1 million
in 2024, 2023, and 2022, respectively.
Additionally, in 2024, 2023, and 2022 the Company
provided discretionary supplemental contributions to the individual 401(k) accounts of substantially all employees. Each employee received
a supplemental contribution to their account based on a uniform percentage of qualifying compensation established annually. The cost of
these supplemental contributions totaled $7.0 million, $6.9 million, and $7.4 million in 2024, 2023, and 2022, respectively.
12. Other Operating Income, Net
Other operating income, net consists of the following:
| Year ended December 31, | |
2024 | | |
2023 | | |
2022 | |
| | |
| | | |
| | | |
| | |
| Gain on sale of operating assets | |
$ | — | | |
$ | 5 | | |
$ | 36 | |
13. Income Taxes
The Company files income tax returns in the U.S.
federal jurisdiction and various state jurisdictions. With few exceptions, the Company is no longer subject to U.S. federal and state
income tax examinations by tax authorities for years before 2017.
The federal and state income tax provision consisted of the following:
| Year ended December 31, | |
2024 | | |
2023 | | |
2022 | |
| | |
Current | | |
Deferred | | |
Current | | |
Deferred | | |
Current | | |
Deferred | |
| | |
| | |
| | |
| | |
| | |
| | |
| |
| Federal | |
$ | 10,310 | | |
$ | (4,190 | ) | |
$ | 14,763 | | |
$ | (5,285 | ) | |
$ | 21,741 | | |
$ | (4,694 | ) |
| State | |
| 1,607 | | |
| (515 | ) | |
| 1,713 | | |
| (582 | ) | |
| 3,779 | | |
| (879 | ) |
| | |
$ | 11,917 | | |
$ | (4,705 | ) | |
$ | 16,476 | | |
$ | (5,867 | ) | |
$ | 25,520 | | |
$ | (5,573 | ) |
The effective income tax rate varied from the statutory federal income
tax rate as follows:
| Year ended December 31, | |
2024 | | |
2023 | | |
2022 | |
| Statutory federal income tax rate | |
| 21.0% | | |
| 21.0% | | |
| 21.0% | |
| State income taxes, net of federal tax benefit | |
| 1.5 | | |
| 2.2 | | |
| 2.7 | |
| Research and development tax credits | |
| (5.9 | ) | |
| (2.7 | ) | |
| (4.2 | ) |
| Other | |
| 2.5 | | |
| (2.5 | ) | |
| (1.1 | ) |
| Effective income tax rate | |
| 19.1% | | |
| 18.0% | | |
| 18.4% | |
The Company estimates that its effective tax rate
in 2025 will approximate 20.3%.
Significant components of the Company’s
deferred tax assets and liabilities are as follows:
| December 31, | |
2024 | | |
2023 | |
| | |
| | |
| |
| Deferred tax assets | |
| | | |
| | |
| Capitalized research and development costs | |
$ | 12,566 | | |
$ | 9,144 | |
| Employee compensation and benefits | |
| 2,483 | | |
| 2,452 | |
| Allowances for doubtful accounts and discounts | |
| 452 | | |
| 431 | |
| Inventories | |
| 1,831 | | |
| 1,635 | |
| Stock-based compensation | |
| 1,876 | | |
| 1,698 | |
| Other | |
| 1,537 | | |
| 1,608 | |
| Total deferred tax assets | |
| 20,745 | | |
| 16,968 | |
| Deferred tax liabilities: | |
| | | |
| | |
| Depreciation | |
| 2,868 | | |
| 3,578 | |
| Other | |
| 1,196 | | |
| 1,414 | |
| Total deferred tax liabilities | |
| 4,064 | | |
| 4,992 | |
| Net deferred tax assets | |
$ | 16,681 | | |
$ | 11,976 | |
In 2022, the Company adopted the provisions of
the Tax Cuts and Jobs Act of 2017 that relate to IRS Code Section 174. Under these provisions, research and development costs must be
capitalized and amortized over five years for income tax purposes. The Company continues to expense these costs in the period incurred
for financial accounting purposes.
The Company made income tax payments of approximately
$10.6 million, $26.0 million, and $28.7 million, during 2024, 2023, and 2022, respectively. The Company expects to realize its deferred
tax assets through tax deductions against future taxable income.
The Company does not believe it has included
any “uncertain tax positions” in its federal income tax return or any of the state income tax returns it is currently filing.
The Company has made an evaluation of the potential impact of additional state taxes being assessed by jurisdictions in which the Company
does not currently consider itself liable. The Company does not anticipate that such additional taxes, if any, would result in a material
change to its financial position.
14. Earnings Per Share
Set forth below is a reconciliation of the numerator
and denominator for the basic and diluted earnings per share calculations for the periods indicated:
| Year ended December 31, | |
2024 | | |
2023 | | |
2022 | |
| | |
| | |
| | |
| |
| Numerator: | |
| | | |
| | | |
| | |
| Net income | |
$ | 30,563 | | |
$ | 48,215 | | |
$ | 88,332 | |
| Denominator: | |
| | | |
| | | |
| | |
| Weighted average number of common shares outstanding – Basic | |
| 17,088,205 | | |
| 17,676,955 | | |
| 17,648,850 | |
| Dilutive effect of options and restricted stock units outstanding under the Company’s employee compensation plans | |
| 181,896 | | |
| 134,263 | | |
| 144,498 | |
| Weighted average number of common shares outstanding – Diluted | |
| 17,270,101 | | |
| 17,811,218 | | |
| 17,793,348 | |
15. Stock Repurchases
In 2024, 2023, and 2022 the Company repurchased
shares of its common stock. Details of these purchases are as follows:
| Period | |
Total
Number of
Shares
Purchased | |
Average
Price Paid
per Share | |
Total Number
of Shares
Purchased as
Part of
Publicly
Announced
Program | |
Maximum
Dollar Value
of Shares that
May Yet Be
Purchased
Under the
Program |
| | |
| | | |
| | | |
| | | |
| | |
| Third Quarter 2022 | |
| | | |
| | | |
| | | |
| | |
| July 3 to July 30 | |
| — | | |
| — | | |
| — | | |
| | |
| July 31 to August 27 | |
| — | | |
| — | | |
| — | | |
| | |
| August 28 to October 1 | |
| 2,136 | | |
$ | 49.97 | | |
| 2,136 | | |
| | |
| Fourth Quarter 2022 | |
| | | |
| | | |
| | | |
| | |
| October 2 to October 29 | |
| — | | |
| — | | |
| — | | |
| | |
| October 30 to November 26 | |
| 2,304 | | |
$ | 49.77 | | |
| 2,304 | | |
| | |
| November 27 to December 31 | |
| — | | |
| — | | |
| — | | |
| | |
| Fourth Quarter 2023 | |
| | | |
| | | |
| | | |
| | |
| October 1 to October 28 | |
| — | | |
| — | | |
| — | | |
| | |
| October 29 to November 25 | |
| 179,341 | | |
$ | 45.20 | | |
| 179,341 | | |
| | |
| November 26 to December 31 | |
| 84,721 | | |
$ | 43.67 | | |
| 84,721 | | |
| | |
| First Quarter 2024 | |
| | | |
| | | |
| | | |
| | |
| January 1 to January 27 | |
| 7,317 | | |
$ | 43.42 | | |
| 7,317 | | |
| | |
| January 28 to February 24 | |
| 20,307 | | |
$ | 42.93 | | |
| 20,307 | | |
| | |
| February 25 to March 30 | |
| 47,400 | | |
$ | 42.79 | | |
| 47,400 | | |
| | |
| Second Quarter 2024 | |
| | | |
| | | |
| | | |
| | |
| March 31 to April 27 | |
| — | | |
| — | | |
| — | | |
| | |
| April 28 to May 25 | |
| 28,924 | | |
$ | 42.92 | | |
| 28,924 | | |
| | |
| May 26 to June 29 | |
| 373,969 | | |
$ | 42.27 | | |
| 373,969 | | |
| | |
| Third Quarter 2024 | |
| | | |
| | | |
| | | |
| | |
| June 30 to July 27 | |
| 156,517 | | |
$ | 41.27 | | |
| 156,517 | | |
| | |
| July 28 to August 24 | |
| — | | |
| — | | |
| — | | |
| | |
| August 25 to September 28 | |
| 64,325 | | |
$ | 40.66 | | |
| 64,325 | | |
| | |
| Fourth Quarter 2024 | |
| | | |
| | | |
| | | |
| | |
| September 29 to October 26 | |
| 11,340 | | |
$ | 40.50 | | |
| 11,340 | | |
| | |
| October 27 to November 23 | |
| 52,129 | | |
$ | 39.50 | | |
| 52,129 | | |
| | |
| November 23 to December 31 | |
| 72,832 | | |
$ | 34.81 | | |
| 72,832 | | |
| | |
| Total | |
| 1,103,562 | | |
$ | 42.07 | | |
| 1,103,562 | | |
$ | 40,290,000 | |
All of these purchases were made with cash held
by the Company and no debt was incurred
At December 31, 2024, approximately $40.3 million
remained authorized for share repurchases.
16. Compensation Plans
In May 2017, the Company’s shareholders
approved the 2017 Stock Incentive Plan (the “2017 SIP”) under which employees, independent contractors, and non-employee directors
may be granted stock options, restricted stock, deferred stock awards, and stock appreciation rights, any of which may or may not require
the satisfaction of performance objectives. Vesting requirements are determined by the Compensation Committee of the Board of Directors.
The Company has reserved 750,000 shares for issuance under the 2017 SIP.
In June 2023, the Company’s shareholders
approved the 2023 Stock Incentive Plan (the “2023 SIP”) under which employees, independent contractors, and non-employee directors
may be granted stock options, restricted stock, deferred stock awards, and stock appreciation rights, any of which may or may not require
the satisfaction of performance objectives. Vesting requirements are determined by the Compensation Committee of the Board of Directors.
The Company reserved 1,000,000 shares for issuance under the 2023 SIP, of which 845,000 shares remain available for future grants as of
December 31, 2023. Approximately 150,000 shares remaining from the 2017 SIP will be available for future grants under the terms of
the 2023 SIP. Since the shareholder approval of the 2023 SIP, no additional awards have been or will be granted under the 2017 SIP. Previously
granted and outstanding awards under the 2017 SIP will remain subject to the terms of the 2017 SIP.
Compensation expense related to deferred stock,
restricted stock, and restricted stock units is recognized based on the grant-date fair value of the Company’s common stock, using
either the actual share price or an estimated value using the Monte Carlo valuation model. The total stock-based compensation cost included
in the Statements of Income was $5.8 million, $6.2 million, and $5.7 million in 2024, 2023, and 2022, respectively.
Deferred Stock
Deferred stock awards vest based on the passage
of time or the Company’s attainment of performance objectives. Upon vesting, these awards convert one-for-one to common stock.
In 2024, 9,291 deferred stock awards were issued
to non-employee directors that will vest in June 2025 and 11,992 deferred stock awards were issued to non-employee directors that will
vest in June 2027
In 2023, 7,566 deferred stock awards were issued
to non-employee directors that vested in June 2024 and 9,760 deferred stock awards were issued to non-employee directors that will
vest in June 2026.
In 2022, 5,953 deferred stock awards were issued
to non-employee directors that vested in May 2023, 7,688 deferred stock awards were issued to non-employee directors that will vest in
May 2025 and a 1,478 deferred stock award was issued to a non-employee director that will vest in June 2027.
Compensation expense related to these awards is
amortized ratably over the vesting period. Compensation expense related to these awards was $0.9 million in 2024, $0.9 million in 2023,
and $0.8 million in 2022.
At December 31, 2024, there was $1.0 million of
unrecognized compensation cost related to deferred stock that is expected to be recognized over a period of three years.
Restricted Stock Units
The Company grants restricted stock units (RSU’s)
to senior employees. Some of these RSU’s are retention awards and have only time-based vesting. Other RSU’s have a vesting
“double trigger.” The vesting of these RSU’s is dependent on the achievement of corporate objectives established by
the Compensation Committee of the Board of Directors, including return on net operating assets, stock performance, and the passage of
time.
During 2024, 153,000 restricted stock units were
issued. Compensation costs related to these restricted stock units was $6.8 million, of which $1.9 million was recognized in 2024. The
costs are being recognized ratably over the remaining periods required before the units vest, which range from 24 to 26 months.
During 2023, 114,000 restricted stock units were
issued. Compensation costs related to these restricted stock units was $6.1 million, of which $1.3 million was recognized in 2023. The
costs
are being recognized ratably over the remaining periods required before the units vest, which range from 24 to 26 months.
During 2022, 82,000 restricted stock units were
issued. Compensation costs related to these restricted stock units was $6.0 million, of which $1.7 million was recognized in 2022. The
costs are being recognized ratably over the remaining periods required before the units vest, which range from 24 to 26 months.
At December 31, 2024, there was $7.8 million of
unrecognized compensation cost related to restricted stock units that is expected to be recognized over a period of 3.3 years.
17. Operating Segment Information
The Company has two reportable operating segments:
firearms and castings. The firearms segment manufactures and sells rifles, pistols, and revolvers principally to a number of federally-licensed,
independent wholesale distributors primarily located in the United States. The castings segment manufactures and sells steel investment
castings and metal injection molding parts.
Corporate segment income relates to interest income,
the sale of non-operating assets, and other non-operating activities. Corporate segment assets consist of cash and other non-operating
assets.
The Company evaluates performance and allocates
resources, in part, based on income (loss) before taxes. The accounting policies of the reportable segments are the same as those described
in the summary of significant accounting policies (see Note 1). Intersegment sales are recorded at the Company’s cost plus a fixed
profit percentage.
This segment structure reflects the financial
information and reports used by the Company’s management, specifically its CODM, to make decisions regarding the Company’s
business, including resource allocations and performance assessments, as well as the current operating focus in compliance with ASC 280,
Segment Reporting. The Company’s reportable segments are not aggregated.
The Company’s method for measuring performance
of a reportable segment is primarily gross profit. The CODM does not review disaggregated assets by segment. The Company adopted ASU 2023-07
in January 2025. The most significant provision was the required disclosure of significant segment expenses that are regularly provided
to the CODM. The Company’s CODM periodically reviews cost of goods sold by segment and treats it as a significant segment expense.
| Year ended December 31, | |
2024 | | |
2023 | | |
2022 | |
| Net Sales | |
| | | |
| | | |
| | |
| Firearms | |
$ | 532,608 | | |
$ | 540,746 | | |
$ | 593,289 | |
| Castings | |
| | | |
| | | |
| | |
| Unaffiliated | |
| 3,035 | | |
| 3,021 | | |
| 2,553 | |
| Intersegment | |
| 31,528 | | |
| 33,086 | | |
| 21,306 | |
| | |
| 34,563 | | |
| 36,107 | | |
| 23,859 | |
| Eliminations | |
| (31,528 | ) | |
| (33,086 | ) | |
| (21,306 | ) |
| | |
$ | 535,643 | | |
$ | 543,767 | | |
$ | 595,842 | |
| Costs of Goods Sold | |
| | | |
| | | |
| | |
| Firearms | |
$ | 417,222 | | |
$ | 407,068 | | |
$ | 410,507 | |
| Castings | |
| | | |
| | | |
| | |
| Unaffiliated | |
| 4,006 | | |
| 3,080 | | |
| 5,250 | |
| Intersegment | |
| 31,528 | | |
| 33,086 | | |
| 21,306 | |
| | |
| 35,534 | | |
| 36,166 | | |
| 26,556 | |
| Eliminations | |
| (31,528 | ) | |
| (33,086 | ) | |
| (21,306 | ) |
| | |
$ | 421,228 | | |
$ | 410,148 | | |
$ | 415,757 | |
| Gross Profit (Loss) | |
| | | |
| | | |
| | |
| Firearms | |
$ | 115,386 | | |
$ | 133,678 | | |
$ | 182,782 | |
| Castings | |
| (971 | ) | |
| (59 | ) | |
| (2,697 | ) |
| | |
$ | 114,415 | | |
$ | 133,619 | | |
$ | 180,085 | |
| Operating Income (Loss) | |
| | | |
| | | |
| | |
| Firearms | |
$ | 33,273 | | |
$ | 52,887 | | |
$ | 106,803 | |
| Castings | |
| (1,619 | ) | |
| (803 | ) | |
| (3,347 | ) |
| | |
$ | 31,654 | | |
$ | 52,084 | | |
$ | 103,456 | |
| Income (Loss) Before Income Taxes | |
| | | |
| | | |
| | |
| Firearms | |
$ | 34,051 | | |
$ | 53,723 | | |
$ | 108,609 | |
| Castings | |
| (1,616 | ) | |
| (799 | ) | |
| (3,338 | ) |
| Corporate | |
| 5,340 | | |
| 5,900 | | |
| 3,008 | |
| | |
$ | 37,775 | | |
$ | 58,824 | | |
$ | 108,279 | |
| Year ended December 31, | |
2024 | | |
2023 | | |
2022 | |
| Identifiable Assets | |
| | | |
| | | |
| | |
| Firearms | |
$ | 230,024 | | |
$ | 228,699 | | |
$ | 223,301 | |
| Castings | |
| 9,303 | | |
| 11,144 | | |
| 11,910 | |
| Corporate | |
| 144,707 | | |
| 158,974 | | |
| 249,552 | |
| | |
$ | 384,034 | | |
$ | 398,817 | | |
$ | 484,763 | |
| Goodwill | |
| | | |
| | | |
| | |
| Firearms | |
$ | 3,055 | | |
$ | 3,055 | | |
$ | 3,055 | |
| Castings | |
| 209 | | |
| 209 | | |
| 209 | |
| | |
$ | 3,264 | | |
$ | 3,264 | | |
$ | 3,264 | |
| Depreciation | |
| | | |
| | | |
| | |
| Firearms | |
$ | 19,952 | | |
$ | 19,301 | | |
$ | 21,992 | |
| Castings | |
| 1,154 | | |
| 1,814 | | |
| 2,452 | |
| | |
$ | 21,106 | | |
$ | 21,115 | | |
$ | 24,444 | |
| Capital Expenditures | |
| | | |
| | | |
| | |
| Firearms | |
$ | 20,488 | | |
$ | 15,395 | | |
$ | 26,598 | |
| Castings | |
| 333 | | |
| 401 | | |
| 1,175 | |
| | |
$ | 20,821 | | |
$ | 15,796 | | |
$ | 27,773 | |
In 2024, the Company’s largest customers
and the percent of firearms sales they represented were as follows: Lipsey’s - 28%; Sports South - 18%; and Davidson’s - 16%.
In 2023, the Company’s largest customers
and the percent of firearms sales they represented were as follows: Lipsey’s - 24%; Davidson’s - 19%; and Sports South -15%.
In 2022, the Company’s largest customers
and the percent of firearms sales they represented were as follows: Lipsey’s - 23%; Davidson’s - 23%; and Sports South - 21%.
The Company’s assets are located entirely
in the United States and domestic sales represented at least 94% of total sales in 2024, 2023, and 2022.
18. Quarterly Results of Operations (Unaudited)
The following is a tabulation of the unaudited
quarterly results of operations for the two years ended December 31, 2024:
| | |
Three Months Ended | |
| | |
3/30/24 | | |
6/29/24 | | |
9/28/24 | | |
12/31/24 | |
| Net Sales | |
$ | 136,820 | | |
$ | 130,761 | | |
$ | 122,287 | | |
$ | 145,775 | |
| Gross profit | |
| 29,403 | | |
| 29,154 | | |
| 22,672 | | |
| 33,186 | |
| Net income | |
| 7,084 | | |
| 8,264 | | |
| 4,738 | | |
| 10,477 | |
| Basic earnings per share | |
| 0.41 | | |
| 0.48 | | |
| 0.28 | | |
| 0.63 | |
| Diluted earnings per share | |
$ | 0.40 | | |
$ | 0.47 | | |
$ | 0.28 | | |
$ | 0.62 | |
| | |
Three Months Ended | |
| | |
4/1/23 | | |
7/1/23 | | |
9/30/23 | | |
12/31/23 | |
| Net Sales | |
$ | 149,453 | | |
$ | 142,804 | | |
$ | 120,893 | | |
$ | 130,617 | |
| Gross profit | |
| 38,486 | | |
| 38,148 | | |
| 24,728 | | |
| 32,257 | |
| Net income | |
| 14,350 | | |
| 16,185 | | |
| 7,431 | | |
| 10,249 | |
| Basic earnings per share | |
| 0.81 | | |
| 0.91 | | |
| 0.42 | | |
| 0.58 | |
| Diluted earnings per share | |
$ | 0.81 | | |
$ | 0.91 | | |
$ | 0.42 | | |
$ | 0.58 | |
19. Related Party Transactions
From time to time, the Company contracts with
the National Rifle Association (“NRA”) for some of its promotional and advertising activities. The Company paid the NRA $0.5
million, $0.5 million and $0.7 million in 2024, 2023, and 2022, respectively. One of the Company’s Directors also serves as a Director
on the Board of the NRA.
The Company is a member of the National Shooting
Sports Foundation (“NSSF”), the firearm industry trade association. The
Company paid the NSSF $0.4 million, $0.3 million and $0.3 million in 2024, 2023, and 2022, respectively. One of the Company’s
Directors also serves on the Board of the NSSF.
20. Contingent Liabilities
As
of December 31, 2024, the Company was a defendant in eight (8) lawsuits and is aware of certain other such claims. The lawsuits
generally fall into four (4) categories: municipal litigation, breach of contract, unfair trade practices, and trademark litigation. Each
is discussed in turn below.
Municipal Litigation
Municipal litigation generally includes those
cases brought by cities or other governmental entities against firearms manufacturers, distributors and retailers seeking to recover damages
allegedly arising out of the criminal misuse of firearms by third parties. There are four (4) lawsuits of this type, as follows.
In City of Gary v. Smith & Wesson Corp.,
et al, filed in Indiana State Court in 1999, the City of Gary, Indiana seeks damages, among other things, for the costs of medical
care, police and emergency services, public health services, and other services as well as punitive damages. In addition, nuisance abatement
and/or injunctive relief is sought to change the design, manufacture, marketing and distribution practices of the various Defendants.
The Complaint alleges, among other claims, negligence in the design of products, public nuisance, negligent distribution and marketing,
negligence per se and deceptive advertising. The case does not allege a specific injury to a specific individual as a result of the misuse
or use of any of the Company's products. After a long procedural history, during the quarter ended April 3, 2021, the City initiated discovery
and the manufacturer Defendants reciprocated.
On March 15, 2024, Indiana Governor Eric Holcomb
signed into law HB 1235, which reserves to the State of Indiana the right to bring an action on behalf of a political subdivision against
a firearm or ammunition manufacturer, trade association, seller, or dealer, concerning certain matters. The new law also prohibits a political
subdivision from bringing or maintaining such an action. Following passage of this new law, the Company and other Defendants filed a Motion
for Judgment on the Pleadings on March 18, 2024. On August 12, 2024, the Court denied Defendants’ motion. The Court granted Defendants’
subsequent request to certify the Order for appeal. On October 2, 2024, Defendants filed a motion with the Indiana Court of Appeals to
accept jurisdiction over the interlocutory appeal, which was granted over Plaintiff’s objection on November 1, 2024. On October
16, 2024, the trial court entered an Order staying all proceedings pending the interlocutory appeal. Briefing of the appeal is underway.
Estados Unidos Mexicanos v. Smith & Wesson
Brands, Inc., et al. was filed by the Country of Mexico and names seven Defendants, mostly U.S.-based firearms manufacturers, including
the Company. The Complaint advances a variety of legal theories including negligence, public nuisance, unjust enrichment, restitution,
and others. Plaintiff essentially alleges that Defendants design, manufacture, distribute, market and sell firearms in a way that they
know results in the illegal trafficking of firearms into Mexico, where they are used by Mexican drug cartels for criminal activities.
Plaintiff seeks injunctive relief and monetary damages.
On November 22, 2021, Defendants jointly filed
a motion to dismiss the Complaint, which was granted on September 30, 2022. Several defendants, including the Company, also filed Rule
12(b)(2) motions to dismiss for lack of personal jurisdiction, which the Court declined to rule on in light of its dismissal. Plaintiffs
appealed the dismissal to the First Circuit Court of Appeals and, on January 22, 2024, the Court of Appeals reversed the District Court’s
dismissal and remanded the case for further proceedings. The Defendants filed a Petition for Writ of
Certiorari seeking review by the
United States Supreme Court while the case moved forward at the District Court.
On June 17, 2024, the District Court heard argument
on the pending Rule 12(b)(2) motions to dismiss. On August 7, 2024, the Court granted the motions, dismissing the Company and some of
the other Defendants from the case, but has not yet entered judgement in favor of these Defendants. Because judgment has not entered in
favor of the Company, the 30-day period in which Plaintiff may appeal the Court’s August 7, 2024 ruling has not yet begun to run.
Subsequently, the Supreme Court granted the Defendants’ Petition for Writ of Certiorari. Oral argument at the Supreme Court is scheduled
for March 4, 2025.
On December 20, 2022, the City of Buffalo, New
York filed a lawsuit captioned The City of Buffalo v. Smith & Wesson Brands, Inc., et al. in the New York State Supreme Court
for Erie County, New York. The suit names a number of firearm manufacturers, distributors, and retailers as Defendants, including the
Company, and purports to state causes of action for violations of Sections 898, 349 and 350 of the New York General Business Law, as well
as common law public nuisance. Generally, Plaintiff alleges that the criminal misuse of firearms in the City of Buffalo is the result
of the manufacturing, sales, marketing, and distribution practices of the Defendants. The Defendants timely removed the matter to the
U.S. District Court for the Western District of New York.
On December 21, 2022, the City of Rochester, New
York filed a lawsuit captioned The City of Rochester v. Smith & Wesson Brands, Inc., et al. in the New York State Supreme Court
for Monroe County, New York. The suit names the same defendants and makes essentially the same allegations raised in Buffalo, discussed
in the preceding paragraph. Defendants timely removed the matter to the U.S. District Court for the Western District of New York.
Defendants moved to consolidate the Buffalo
and Rochester cases for pretrial purposes only and also moved to stay the cases pending a decision by the Second Circuit Court
of Appeals in National Shooting Sports Foundation, Inc. et al. v. James, which challenges the constitutionality of the recently
enacted N.Y. GEN. BUS. LAW §§ 898-a–e. On June 8, 2023, the Court granted Defendants’ motions and the cases were
consolidated for pretrial purposes and stayed.
Breach of Contract
The Company is a defendant in Jones v. Sturm,
Ruger & Co., a purported class action lawsuit arising out of a data breach at Freestyle Solutions, Inc., the vendor who was hosting
the Company’s ShopRuger.com website at the time of the breach. On January 20, 2023, five Plaintiffs filed an Amended Complaint naming
the Company and Freestyle Solutions, Inc. as Defendants. The Complaint alleged causes of action for negligence, breach of implied warranties,
and unjust enrichment.
The Company moved to dismiss the Amended Complaint,
and on March 27, 2024, the Court dismissed Plaintiffs’ negligence and unjust enrichment claims against the Company. The Court denied
the motion with respect to Plaintiffs’ breach of contract claim, concluding that development
of additional information is required
to assess the applicability of the limitation of liability clause contained in the Company’s terms and conditions of use. The case
is proceeding accordingly.
Unfair Trade Practices
Estate of Suzanne Fountain v. Sturm, Ruger
& Co., Inc., was filed in Connecticut Superior Court and arises out of the criminal shooting at the King Soopers supermarket in
Boulder, Colorado on March 22, 2021. On that date, Plaintiff’s decedent, Suzanne Fountain, was murdered by 21-year-old Ahmad
Al Aliwi Al-Issa. The Complaint alleged that the Company’s advertising and marketing of the Ruger AR-556 pistol violate the Connecticut
Unfair Trade Practices Act and were a substantial factor in bringing about the wrongful death of Suzanne Fountain.
Estate of Neven Stanisic et al. v. Sturm, Ruger
& Co., Inc., was filed in Connecticut Superior Court on behalf of five Plaintiffs. Like Estate of Suzanne Fountain, the
claims arise from the criminal shooting at the King Soopers supermarket in Boulder, Colorado on March 22, 2021. Plaintiffs’ decedents
were murdered by Ahmad Al Aliwi Al-Issa and Plaintiffs alleged that the Company’s advertising
and marketing of the Ruger AR-556 pistol violate the Connecticut Unfair Trade Practices Act and were a substantial factor in causing the
wrongful death of Plaintiffs’ decedents.
The Fountain
and Stanisic cases were consolidated for discovery purposes only and transferred by the Court to the Complex Litigation Docket.
Plaintiffs then sought leave to file an Amended Complaint, essentially abandoning their negligent marketing allegations and advancing
a new theory predicated upon alleged violations of the Gun Control Act and National Firearms Act. Over the Company’s objections,
Plaintiffs were permitted to file the Amended Complaint.
The matter
was timely removed to the U.S. District Court for the District of Connecticut based upon the new allegations and federal question jurisdiction.
Plaintiffs moved to remand the case to state court and, following briefing and oral argument, the matter was remanded on April 25, 2024.
On June 12, 2024, Ruger filed Motions to Dismiss
the Connecticut state court cases based upon the doctrine of forum non conveniens. Following oral argument on September 9, 2024,
the Court allowed Plaintiffs limited, additional discovery and requested further briefing on the matter. The briefing has been completed
and the parties are awaiting a decision from the Court.
Trademark
Litigation
On March
12, 2024, the Company was named as a defendant in FN Herstal, et al. v. Sturm, Ruger & Company, Inc., which is pending
in the U.S. District Court for the Middle District of North Carolina. The Complaint alleges that
the Company’s use of the initialism “SFAR” in connection with the marketing of its Small Frame Autoloading Rifle infringes
the Plaintiffs’ SCAR trademark. The Complaint alleges violations of the Lanham Act and the North Carolina Unfair and Deceptive Trade
Practices Act, as well as trademark infringement under North Carolina common law. The Company believes that the allegations are meritless
and is defending the action accordingly.
Summary of Claimed Damages and Explanation
of Product Liability Accruals
Punitive damages, as well as compensatory damages,
are demanded in certain of the lawsuits and claims. In many instances, the plaintiff does not seek a specified amount of money, though
aggregate amounts ultimately sought may exceed product liability accruals and applicable insurance coverage.
For product liability claims made between July
10, 2000 and August 31, 2024, insurance coverage was provided on an annual basis for losses exceeding $5 million per claim, with an aggregate
maximum loss of $10 million annually, except for certain claims brought by governments or municipalities, which are excluded from coverage.
Insurance coverage was not renewed with incumbent carriers effective September 1, 2024. Rather, the Company established a wholly-owned
captive insurance company for claims made on or after September 1, 2024.
Company management monitors the status of known
claims and the product liability accrual, which includes amounts for asserted and unasserted claims. While it is not possible to forecast
the outcome of litigation or the timing of costs, in the opinion of management, after consultation with special and corporate counsel,
it is not probable and is unlikely that litigation, including punitive damage claims, will have a material adverse effect on the financial
position of the Company, but may have a material impact on the Company’s financial results for a particular period.
Product liability claim payments are made when
appropriate if, as, and when claimants and the Company reach agreement upon an amount to finally resolve all claims. Legal costs are paid
as the lawsuits and claims develop, the timing of which may vary greatly from case to case. A time schedule cannot be determined in advance
with any reliability concerning when payments will be made in any given case.
Provision is made for product liability claims
based upon many factors related to the severity of the alleged injury and potential liability exposure, based upon prior claim experience.
Because the Company's experience in defending these lawsuits and claims is that unfavorable outcomes are typically not probable or estimable,
only in rare cases is an accrual established for such costs.
In most cases, an accrual is established only
for estimated legal defense costs. Product liability accruals are periodically reviewed to reflect then-current estimates of possible
liabilities and expenses incurred to date and reasonably anticipated in the future. Threatened product liability claims are reflected
in the Company's product liability accrual on the same basis as actual claims; i.e., an accrual is made for reasonably anticipated
possible liability and claims handling expenses on an ongoing basis.
Often, a Complaint does not specify the amount
of damages being sought and range of reasonably possible losses relating to unfavorable outcomes cannot be made. The dollar amount of
damages claimed at December 31, 2024, December 31, 2023, and December 31, 2022 was de minimis. The amount claimed at December 31,
2021 was $1.1 million and is set forth as an indication of possible maximum liability the Company might be required to incur in these
cases (regardless
of the likelihood or reasonable probability of any or all of this amount being awarded to claimants) as a result of
adverse judgments that are sustained on appeal.
During 2024, one (1) trademark lawsuit was filed
against the Company, one (1) negligence lawsuit was resolved, and one (1) traditional product liability lawsuit was resolved. One (1)
municipal lawsuit was dismissed, however the time period in which to file an appeal has been stayed by the Court and the Company considers
this matter still open. As of December 31, 2024, the Company was a defendant in eight (8) lawsuits involving its products, including four
(4) municipal lawsuits, two (2) lawsuits based upon unfair trade practices, one (1) breach of contract, and one (1) trademark litigation.
During 2023, one (1) traditional product liability
lawsuit was filed against the Company and one (1) was resolved. As of December 31, 2023, the Company was a defendant in seven (7) lawsuits
involving its products, including one (1) traditional product liability lawsuit, four (4) municipal lawsuits and two (2) lawsuits based
upon alleged unfair trade practices. The Company was also a defendant in two (2) negligence lawsuits.
During 2022, no traditional product liability
lawsuits were filed against the Company and one (1) was resolved. As of December 31, 2022, the Company was a defendant five lawsuits involving
its products, including one (1) traditional product liability lawsuit and four (4) municipal lawsuits. The Company also was a defendant
in three (3) negligence lawsuits though, as discussed above, that number has since been reduced to two (2) lawsuits with the consolidation
of the Jones and Copeland matters.
The Company’s product liability expense
was $0.7 million in 2024, $1.5 million in 2023, $1.3 million in 2022. This expense includes the cost of outside legal fees, and other
expenses incurred in the management and defense of product liability matters.
A roll-forward of the product liability reserve and detail of product
liability expense for the three years ended December 31, 2024 follows:
Balance Sheet Roll-forward for Product Liability
Reserve
| | |
| | |
| | |
Cash Payments | | |
| |
| | |
Balance
Beginning
of Year (a) | | |
Accrued
Legal
Expense
(Income)
(b) | | |
Legal Fees
(c) | | |
Settlements
(d) | | |
Balance
End of
Year (a) | |
| | |
| | |
| | |
| | |
| | |
| |
| 2022 | |
$ | 892 | | |
| (417 | ) | |
| (167 | ) | |
| — | | |
$ | 308 | |
| | |
| | | |
| | | |
| | | |
| | | |
| | |
| 2023 | |
$ | 308 | | |
| 500 | | |
| (129 | ) | |
| — | | |
$ | 679 | |
| | |
| | | |
| | | |
| | | |
| | | |
| | |
| 2024 | |
$ | 679 | | |
| 67 | | |
| (254 | ) | |
| — | | |
$ | 492 | |
Income Statement Detail for Product Liability
Expense
| | |
Accrued
Legal
Expense
(b) | | |
Insurance
Premium
Expense
(e) | | |
Total
Product
Liability
Expense | |
| | |
| | |
| | |
| |
| 2022 | |
$ | (417 | ) | |
| 1,524 | | |
$ | 1,107 | |
| | |
| | | |
| | | |
| | |
| 2023 | |
$ | 500 | | |
| 1,226 | | |
$ | 1,726 | |
| | |
| | | |
| | | |
| | |
| 2024 | |
$ | 67 | | |
| 908 | | |
$ | 975 | |
Notes
There were no insurance recoveries during any
of the above years.
21. Financial Instruments
The Company does not hold or issue financial instruments
for trading or hedging purposes, nor does it hold interest rate, leveraged, or other types of derivative financial instruments. Fair values
of accounts receivable, accounts payable, accrued expenses and income taxes payable reflected in the December 31, 2024 and 2023 balance
sheets approximate carrying values at those dates.
22. Subsequent Events
On February 14, 2025, the Company’s Board
of Directors authorized a dividend of 24¢ per share to shareholders of record on March 14, 2025.
On January 17, 2025, the Company announced the
appointment of Mr. Todd W. Seyfert as its next President & Chief Executive Officer, effective March 1, 2025. Mr. Christopher J. Killoy
will step down as President & Chief Executive Officer on that date and then serve as a Special Advisor through his planned retirement
from the Company in May 2025.
Mr. Kevin B. Reid, Sr. will step down as Vice
President, General Counsel, and Corporate Secretary on June 30, 2025 and then serve as Senior Counsel to the Company until his planned
retirement from the Company on June 30, 2026.
The Company’s management has evaluated transactions
occurring subsequent to December 31, 2024 and determined that there were no other events or transactions during that period that would
have a material impact on the Company’s results of operations or financial position.
ITEM 9—CHANGES IN AND DISAGREEMENTS WITH ACCOUNTANTS ON ACCOUNTING
AND FINANCIAL DISCLOSURE
None.
ITEM 9A—CONTROLS AND PROCEDURES
Evaluation
of Disclosure Controls and Procedures
The Company conducted an evaluation, with the
participation of its Chief Executive Officer and Chief Financial Officer, of the effectiveness of the design and operation of the Company’s
disclosure controls and procedures, as defined in Rules 13a-15(e) and 15d-15(e) under the Securities Exchange Act of 1934, as amended,
as of December 31, 2024. Based upon that evaluation, the Chief Executive Officer and Chief Financial Officer have concluded that as of
December 31, 2024, the Company’s disclosure controls and procedures over financial reporting were effective.
Management’s Report on Internal Control over Financial
Reporting
The Company’s management is responsible
for establishing and maintaining adequate internal control over financial reporting as defined in Rules 13a-15(f) and 15d-15(f) under
the Securities Exchange Act of 1934. Because of its inherent limitations, internal control over financial reporting may not prevent or
detect misstatements. Also, projections of any evaluation of effectiveness to future periods are subject to the risk that controls may
become inadequate because of changes in conditions, or that the degree of compliance with the policies or procedures may deteriorate.
The Company conducted an evaluation, with the
participation of its Chief Executive Officer and Chief Financial Officer, of the effectiveness of its internal control over financial
reporting as of December 31, 2024. This evaluation was performed based on the criteria established in “Internal Control —
Integrated Framework” issued by the Committee of Sponsoring Organizations of the Treadway Commission (“COSO”) in 2013.
Management has concluded that the Company maintained
effective internal control over financial reporting as of December 31, 2024, based on criteria established in “Internal Control —
Integrated Framework” issued by the COSO in 2013.
The effectiveness of the Company’s internal
control over financial reporting as of December 31, 2024 has been audited by RSM US LLP, an independent registered public accounting firm,
as stated in their report which is included in this Form 10-K.
Changes in Internal Control over Financial
Reporting
There were no changes in our internal control
over financial reporting that occurred during our most recently completed fiscal quarter that has materially affected, or is reasonably
likely to materially affect, our internal control over financial reporting.
New York Stock Exchange Certification
Pursuant to Section 303A.12(a) of the New York
Stock Exchange Listed Company Manual, the Company submitted an unqualified certification of our Chief Executive Officer to the New York
Stock Exchange in 2024. The Company has also filed, as exhibits to this Annual Report on Form 10-K, the Chief Executive Officer and Chief
Financial Officer Certifications required under the Sarbanes-Oxley Act of 2002.
ITEM 9B—OTHER INFORMATION
Rule 10b5-1 Trading Plans
The adoption or termination
of contracts, instructions or written plans for the purchase and sale of the Company’s securities by the Company’s Section
16 officers or directors for the three months ended December 31, 2024, each of which is intended to satisfy the affirmative defense conditions
of Rule 10b5-1(c) under the Exchange Act (“Rule 10b5-1 Plan”), were as follows:
| Name | Title | Action | Date
Adopted | Expiration
Date | Aggregate # of
Securities to be
Purchased/Sold |
| John A. Cosentino, Jr. (1) | Director | Adoption of Rule 10b5-1 Plan | November 14, 2024 | November 14, 2025 | 5,000 |
None of the Company’s directors or Section 16 officers
adopted or terminated a “non-Rule 10b5-1 trading arrangement” as defined in Item 408 of Regulation S-K during the three months
ended December 31, 2024.
ITEM 9C—DISCLOSURE REGARDING
FOREIGN JURISDICTIONS THAT PREVENT INSPECTIONS
Not applicable.
PART III
ITEM 10—DIRECTORS, EXECUTIVE OFFICERS AND CORPORATE GOVERNANCE
Information concerning the Company’s directors,
including the Company’s separately designated standing audit committee, and on the Company’s code of business conduct and
ethics required by this Item is incorporated by reference from the Company’s Proxy Statement relating to the 2025 Annual Meeting
of Stockholders scheduled to be held May 29, 2025, which will be filed with the SEC in April 2025.
Information concerning the Company’s executive
officers required by this Item is set forth in Item 1 of this Annual Report on Form 10-K under the caption “Executive Officers of
the Company.”
Information concerning beneficial ownership reporting
compliance required by this Item is incorporated by reference from the Company’s Proxy Statement relating to the 2025 Annual Meeting
of Stockholders scheduled to be held May 29, 2025, which will be filed with the SEC in April 2025.
ITEM 11—EXECUTIVE COMPENSATION
Information concerning director and executive
compensation required by this Item is incorporated by reference from the Company’s Proxy Statement relating to the 2025 Annual Meeting
of Stockholders scheduled to be held May 29, 2025, which will be filed with the SEC in April 2025.
ITEM 12—SECURITY
OWNERSHIP OF CERTAIN BENEFICIAL OWNERS AND MANAGEMENT AND RELATED STOCKHOLDER MATTERS
Information concerning the security ownership
of certain beneficial owners and management and related stockholder matters required by this Item is incorporated by reference from the
Company’s Proxy Statement relating to the 2025 Annual Meeting of Stockholders scheduled to be held May 29, 2025, which will be
filed with the SEC in April 2025.
Securities Authorized for Issuance Under Equity Compensation Plans
The following table provides information regarding
compensation plans under which equity securities of the Company are authorized for issuance as of December 31, 2024:
| Equity Compensation Plan Information |
| Plan category | |
Number of securities to
be issued upon exercise of
outstanding options,
warrants and rights
(a) | |
Weighted-average
exercise price of
outstanding options,
warrants and rights
(b) * | |
Number of securities
remaining available for
future issuance under
equity compensation
plans (excluding
securities reflected in
column (a))
(c) |
| Equity compensation plans approved by security holders | |
| |
| |
|
| 2017 Stock Incentive Plan | |
90,940 | |
— | |
0 |
| 2023 Stock Incentive Plan | |
298,421 | |
— | |
845,399** |
|
Equity compensation plans not approved by security holders | |
| |
| |
|
| None. | |
| |
| |
|
| Total | |
398,361 | |
— | |
845,399 |
| * | Restricted stock units are settled in shares of common stock or the cash equivalent. Accordingly, the
weighted-average exercise price is not applicable. |
| ** | Includes 151,386 unused shares previously
authorized for issuance under the 2017 SIP that are now incorporated into and issuable under the 2023 SIP. |
ITEM 13—CERTAIN
RELATIONSHIPS AND RELATED TRANSACTIONS AND DIRECTOR INDEPENDENCE
Information concerning certain relationships and
related transactions required by this Item is incorporated by reference from the Company’s Proxy Statement relating to the 2025
Annual Meeting of Stockholders scheduled to be held May 29, 2025.
ITEM 14—PRINCIPAL ACCOUNTANT FEES AND SERVICES
Information concerning the Company’s principal
accountant fees and services and the pre-approval policies and procedures of the audit committee of the board of directors required by
this Item is incorporated by reference from the Company’s Proxy Statement relating to the 2025 Annual Meeting of Stockholders scheduled
to be held May 29, 2025, which will be filed with the SEC in April 2025.
PART IV
ITEM 15—EXHIBITS AND FINANCIAL STATEMENT
SCHEDULE
(a) Exhibits and
Financial Statement Schedule
(1) Financial Statements
can be found under Item 8 of Part II of this Form 10-K
(2) Schedule can
be found on Page 87 of this Form 10-K
(3) Listing of
Exhibits:
| |
Exhibit 3.1 |
Certificate of Incorporation of the Company, as amended (Incorporated by reference to Exhibit 4.1 to the Form S-8 Registration Statement previously filed by the Company File No. 333-272443 on June 6, 2023). |
| |
|
|
| |
Exhibit 3.2 |
Bylaws of the Company, as amended through November 12, 2019. |
| |
|
|
| |
Exhibit 4.1 |
Description of the Company’s Securities. |
| |
|
|
| |
Exhibit 10.1 |
Severance Agreement, dated as of November 25, 2024, by and between the Company and Thomas A. Dineen (Incorporated by reference to Exhibit 99.1 to the Company's Current Report on Form 8-K filed with the SEC on November 27, 2024). ** |
| |
|
|
| |
Exhibit 10.2 |
Severance Agreement, dated as of November 25, 2024 by and between the Company and Kevin B. Reid, Sr. (Incorporated by reference to Exhibit 99.2 to the Company's Current Report on Form 8-K filed with the SEC on November 27, 2024).** |
| |
|
|
| |
Exhibit 10.3 |
Transition Services and Consulting Agreement, dated August 1, 2016, by and between the Company and Michael O. Fifer (Incorporated by reference to Exhibit 10.1 to the Company's Current Report on Form 8-K filed with the SEC on August 2, 2016).** |
| |
|
|
| |
Exhibit 10.4 |
Amended and Restated Agreement, dated November 10, 2020, by and between the Company and Christopher J. Killoy (Incorporated by reference to Exhibit 10.1 to the Company's Current Report on Form 8-K/A filed with the SEC on November 12, 2020).** |
| |
|
|
| |
Exhibit 10.5 |
Executive Severance Agreement, dated November 25, 2024, by and between the Company and Shawn C. Leska (Incorporated by reference to Exhibit 99.3 to the Company's Current Report on Form 8-K filed with the SEC on November 27, 2024).** |
| |
|
|
| |
Exhibit 10.6 |
Loan Agreement, dated January 7, 2022 between Sturm, Ruger & Company, Inc. and Regions Bank. (Incorporated by reference to Exhibit 10.1 to the Company's Current Report on Form 8-K filed with the SEC on January 11, 2022) , as amended by that certain Amendment to Credit Agreement, dated November 3, 2022, between Sturm, Ruger & Company, Inc. and Regions Bank (Incorporated by reference to Exhibit 99.1 to the Company’s Current Report on Form 8-K filed with the SEC on November 4, 2022) and that certain Second Amendment to Loan Agreement, dated June 6, 2024, between Sturm, Ruger & Company, Inc. and Regions Bank (Incorporated by reference to Exhibit 99.1 to the Company’s Current Report on Form 8-K filed with the SEC on June 10, 2024). |
| |
|
|
| |
Exhibit 10.7 |
The Sturm, Ruger & Company, Inc. 2017 Stock Incentive Plan (incorporated by reference to Annex A of the Company’s Definitive Proxy Statement of Schedule 14A, filed with the SEC on March 27, 2017).** |
| |
|
|
| |
Exhibit 10.8 |
The Sturm, Ruger & Company, Inc. 2023 Stock Incentive Plan (incorporated by reference to Annex A of the Company’s Definitive Proxy Statement of Schedule 14A, filed with the SEC on April 20, 2023)** |
| |
|
|
| |
Exhibit 10.9 |
Separation Agreement, dated as of December 21, 2023 by and between Sturm, Ruger, & Co., Inc. and Thomas P. Sullivan (Incorporated by reference to Exhibit 99.1 to the Company's Current Report on Form 8-K filed with the SEC on December 21, 2023).** |
| |
|
|
| |
Exhibit 10.10 |
Employment Agreement, dated as of January 15, 2025, by and between the Company and Todd W. Seyfert (Incorporated by reference to Exhibit 10.1 to the Company's Current Report on Form 8-K filed with the SEC on January 17, 2025). ** |
| |
|
|
| |
Exhibit 19.1 |
Sturm Ruger & Company, Inc. Insider Trading Policy |
| |
|
|
| |
Exhibit 23.1 |
Consent of RSM US LLP |
| |
|
|
| |
Exhibit 31.1 |
Certification of Chief Executive Officer Pursuant to Rule 13a-14(a) of the Exchange Act. |
| |
|
|
| |
Exhibit 31.2 |
Certification of Treasurer and Chief Financial Officer Pursuant to Rule 13a-14(a) of the Exchange Act. |
| |
|
|
| |
Exhibit 32.1 |
Certification of the Chief Executive Officer Pursuant to Rule 13a-14(b) of the Exchange Act and 18 U.S.C. Section 1350, as Adopted Pursuant to Section 906 of the Sarbanes-Oxley Act of 2002. |
| |
|
|
| |
Exhibit 32.2 |
Certification of the Treasurer and Chief Financial Officer Pursuant to Rule 13a-14(b) of the Exchange Act and 18 U.S.C. Section 1350, as Adopted Pursuant to Section 906 of the Sarbanes-Oxley Act of 2002. |
| |
|
|
| |
Exhibit 97 |
Executive Compensation Clawback Policy |
| |
|
|
| |
Exhibit 101.INS* |
XBRL Instance Document – the instance document does not appear in the Interactive Data File because its XBRL tags are embedded within the Inline XBRL document. |
| |
|
|
| |
Exhibit 101.SCH* |
Inline XBRL Taxonomy Extension Schema Document |
| |
|
|
| |
Exhibit 101.CAL* |
Inline XBRL Taxonomy Extension Calculation Linkbase Document |
| |
|
|
| |
Exhibit 101.DEF* |
Inline XBRL Taxonomy Extension Definition Linkbase Document |
| |
|
|
| |
Exhibit 101.LAB* |
Inline XBRL Taxonomy Extension Label Linkbase Document |
| |
|
|
| |
Exhibit 101.PRE* |
Inline XBRL Taxonomy Extension Presentation Linkbase Document |
| |
|
|
| |
Exhibit 104* |
Cover Page Interactive Data File – the cover page interactive data file does not appear in the Interactive Data File because its XBRL tags are embedded within the Inline XBRL document. |
| |
|
|
| |
*Filed herewith |
|
| |
**Indicates management contract or compensatory plan or arrangement |
SIGNATURES
Pursuant to the requirements of Section 13 or
15(d) of the Securities Exchange Act of 1934, the registrant has duly caused this report to be signed on its behalf by the undersigned,
thereunto duly authorized.
| |
STURM, RUGER & COMPANY, INC. |
| |
(Registrant) |
| |
|
| |
|
| |
S/THOMAS A. DINEEN |
| |
Thomas A. Dineen |
| |
Principal Financial Officer |
| |
Principal Accounting Officer, Senior Vice President, |
| |
Treasurer, and Chief Financial Officer |
| |
|
| |
|
| |
February 19, 2025 |
| |
Date |
Pursuant to the requirements of the Securities
Exchange Act of 1934, this report has been signed below by the following persons on behalf of the registrant and in the capacities and
on the dates indicated.
| S/CHRISTOPHER J. KILLOY |
2/19/25 |
|
S/RONALD C. WHITAKER |
2/19/25 |
Christopher J. Killoy
Chief Executive Officer, Director
(Principal Executive Officer) |
|
Ronald C. Whitaker
Director |
|
| |
|
|
|
|
| S/JOHN A. COSENTINO, JR. |
2/19/25 |
|
S/PHILLIP C. WIDMAN |
2/19/25 |
John A. Cosentino, Jr.
Director |
|
|
Phillip C. Widman
Director |
|
| |
|
|
|
|
| S/AMIR P. ROSENTHAL |
2/19/25 |
|
S/SANDRA S. FROMAN |
2/19/25 |
Amir P. Rosenthal
Director |
|
|
Sandra S. Froman
Director |
|
| |
|
|
|
|
| S/TERRENCE G. O’CONNOR |
2/19/25 |
|
S/REBECCA S. HALSTEAD |
2/19/25 |
Terrence G. O’Connor
Director |
|
|
Rebecca S. Halstead
Director |
|
| |
|
|
|
|
| S/MICHAEL O. FIFER |
2/19/25 |
|
S/THOMAS A. DINEEN |
2/19/25 |
Michael O. Fifer
Director |
|
|
Thomas A. Dineen
Principal Financial Officer
Principal Accounting Officer, Senior Vice
President, Treasurer, and Chief Financial Officer |
|
EXHIBIT INDEX
| |
|
Page
No. |
| Exhibit 3.1 |
Certificate of Incorporation of the Company, as amended (Incorporated by reference to Exhibit 4.1 to the Form S-8 Registration Statement previously filed by the Company File No. 333-272443 on June 6, 2023). |
|
| |
|
|
| Exhibit 3.2 |
Bylaws of the Company, as amended through November 12, 2019. |
|
| |
|
|
| Exhibit 4.1 |
Description of the Company’s Securities. |
|
| |
|
|
| Exhibit 10.1 |
Severance Agreement, dated as of November 25, 2024, by and between the Company and Thomas A. Dineen (Incorporated by reference to Exhibit 99.1 to the Company's Current Report on Form 8-K filed with the SEC on November 27, 2024). ** |
|
| |
|
|
| Exhibit 10.2 |
Severance Agreement, dated as of November 25, 2024 by and between the Company and Kevin B. Reid, Sr. (Incorporated by reference to Exhibit 99.2 to the Company's Current Report on Form 8-K filed with the SEC on November 27, 2024).** |
|
| |
|
|
| Exhibit 10.3 |
Transition Services and Consulting Agreement, dated August 1, 2016, by and between the Company and Michael O. Fifer (Incorporated by reference to Exhibit 10.1 to the Company's Current Report on Form 8-K filed with the SEC on August 2, 2016).** |
|
| |
|
|
| Exhibit 10.4 |
Amended and Restated Agreement, dated November 10, 2020, by and between the Company and Christopher J. Killoy (Incorporated by reference to Exhibit 10.1 to the Company's Current Report on Form 8-K/A filed with the SEC on November 12, 2020).** |
|
| |
|
|
| Exhibit 10.5 |
Executive Severance Agreement, dated November 25, 2024, by and between the Company and Shawn C. Leska (Incorporated by reference to Exhibit 99.3 to the Company's Current Report on Form 8-K filed with the SEC on November 27, 2024).** |
|
| |
|
|
| Exhibit 10.6 |
Loan Agreement, dated January 7, 2022 between Sturm, Ruger & Company, Inc. and Regions Bank. (Incorporated by reference to Exhibit 10.1 to the Company's Current Report on Form 8-K filed with the SEC on January 11, 2022) , as amended by that certain Amendment to Credit Agreement, dated November 3, 2022, between Sturm, Ruger & Company, Inc. and Regions Bank (Incorporated by reference to Exhibit 99.1 to the Company’s Current Report on Form 8-K filed with the SEC on November 4, 2022) and that certain Second Amendment to Loan Agreement, dated June 6, 2024, between Sturm, Ruger & Company, Inc. and Regions Bank (Incorporated by reference to Exhibit 99.1 to the Company’s Current Report on Form 8-K filed with the SEC on June 10, 2024). |
|
EXHIBIT INDEX (continued)
| |
|
|
| Exhibit 10.7 |
The Sturm, Ruger & Company, Inc. 2017 Stock Incentive Plan (incorporated by reference to Annex A of the Company’s Definitive Proxy Statement of Schedule 14A, filed with the SEC on March 27, 2017) |
|
| |
|
|
| Exhibit 10.8 |
The Sturm, Ruger & Company, Inc. 2023 Stock Incentive Plan (incorporated by reference to Annex A of the Company’s Definitive Proxy Statement of Schedule 14A, filed with the SEC on April 20, 2023).** |
|
| |
|
|
| Exhibit 10.9 |
Separation Agreement, dated as of December 21, 2023 by and between Sturm, Ruger, & Co., Inc. and Thomas P. Sullivan (Incorporated by reference to Exhibit 99.1 to the Company's Current Report on Form 8-K filed with the SEC on December 21, 2023).** |
|
| |
|
|
| Exhibit 10.10 |
Employment Agreement, dated as of January 15, 2025, by and between the Company and Todd W. Seyfert (Incorporated by reference to Exhibit 10.1 to the Company's Current Report on Form 8-K filed with the SEC on January 17, 2025). ** |
|
| |
|
|
| Exhibit 19.1 |
Sturm Ruger & Company, Inc. Insider Trading Policy |
|
| |
|
|
| Exhibit 23.1 |
Consent of RSM US LLP |
93 |
| |
|
|
| Exhibit 31.1 |
Certification of Chief Executive Officer Pursuant to Rule 13a-14(a) of the Exchange Act. |
94 |
| |
|
|
| Exhibit 31.2 |
Certification of Treasurer and Chief Financial Officer Pursuant to Rule 13a-14(a) of the Exchange Act. |
96 |
| |
|
|
| Exhibit 32.1 |
Certification of the Chief Executive Officer Pursuant to Rule 13a-14(b) of the Exchange Act and 18 U.S.C. Section 1350, as Adopted Pursuant to Section 906 of the Sarbanes-Oxley Act of 2002. |
98 |
| |
|
|
| Exhibit 32.2 |
Certification of the Treasurer and Chief Financial Officer Pursuant to Rule 13a-14(b) of the Exchange Act and 18 U.S.C. Section 1350, as Adopted Pursuant to Section 906 of the Sarbanes-Oxley Act of 2002. |
99 |
| |
|
|
| Exhibit 97 |
Executive Compensation Clawback Policy |
|
| |
|
|
| Exhibit 101.INS* |
Inline XBRL Instance Document– the instance document does not appear in the Interactive Data File because its XBRL tags are embedded within the Inline XBRL document. |
|
| |
|
|
| Exhibit 101.SCH* |
Inline XBRL Taxonomy Extension Schema Document |
|
| |
|
|
| Exhibit 101.CAL* |
Inline XBRL Taxonomy Extension Calculation Linkbase Document |
|
| |
|
|
| Exhibit 101.DEF* |
Inline XBRL Taxonomy Extension Definition Linkbase Document |
|
| |
|
|
| Exhibit 101.LAB* |
Inline XBRL Taxonomy Extension Label Linkbase Document |
|
| |
|
|
| Exhibit 101.PRE* |
Inline XBRL Taxonomy Extension Presentation Linkbase Document |
|
| |
|
|
| Exhibit 104* |
Cover Page Interactive Data File – the cover page interactive data file does not appear in the Interactive Data File because its XBRL tags are embedded within the Inline XBRL document. |
|
| |
|
|
| *Filed herewith |
|
|
| **Indicates management contract or compensatory plan or arrangement |
|
YEAR ENDED DECEMBER 31, 2024
STURM, RUGER & COMPANY, INC.
ITEMS 15(a)
FINANCIAL STATEMENT SCHEDULE
Sturm, Ruger & Company, Inc.
Item 15(a)--Financial Statement Schedule
Schedule II—Valuation and Qualifying Accounts
(In Thousands)
| COL. A | |
COL. B | | |
COL. C | | |
COL. D | | |
COL. E | |
| | |
| | |
ADDITIONS | | |
| | |
| |
| Description | |
Balance at
Beginning
of Period | | |
(1)
Charged
(Credited) to
Costs and
Expenses | | |
(2)
Charged to
Other
Accounts
–Describe | | |
Deductions | | |
Balance
at End
of
Period | |
| | |
| | |
| | |
| | |
| | |
| |
| Deductions from asset accounts: | |
| | | |
| | | |
| | | |
| | | |
| | |
| Allowance for doubtful accounts: | |
| | | |
| | | |
| | | |
| | | |
| | |
| Year ended December 31, 2024 | |
$ | 400 | | |
$ | — | | |
| | | |
$ | — | | |
$ | 400 | |
| Year ended December 31, 2023 | |
$ | 400 | | |
$ | — | | |
| | | |
$ | — | | |
$ | 400 | |
| Year ended December 31, 2022 | |
$ | 400 | | |
$ | — | | |
| | | |
$ | — | | |
$ | 400 | |
| | |
| | | |
| | | |
| | | |
| | | |
| | |
| Allowance for discounts: | |
| | | |
| | | |
| | | |
| | | |
| | |
| Year ended December 31, 2024 | |
$ | 1,164 | | |
$ | 12,241 | | |
| | | |
$ | 12,095 | (a) | |
$ | 1,310 | |
| Year ended December 31, 2023 | |
$ | 1,334 | | |
$ | 12,540 | | |
| | | |
$ | 12,710 | (a) | |
$ | 1,164 | |
| Year ended December 31, 2022 | |
$ | 1,169 | | |
$ | 13,849 | | |
| | | |
$ | 13,684 | (a) | |
$ | 1,334 | |
(a) Discounts taken
Yes
No
Yes
Yes
0000095029
false
FY
0000095029
2024-01-01
2024-12-31
0000095029
2024-06-30
0000095029
2025-02-10
0000095029
2024-12-31
0000095029
2023-12-31
0000095029
us-gaap:NonvotingCommonStockMember
2024-12-31
0000095029
us-gaap:NonvotingCommonStockMember
2023-12-31
0000095029
us-gaap:CommonStockMember
2024-12-31
0000095029
us-gaap:CommonStockMember
2023-12-31
0000095029
rgr:FirearmsMember
2024-01-01
2024-12-31
0000095029
rgr:FirearmsMember
2023-01-01
2023-12-31
0000095029
rgr:FirearmsMember
2022-01-01
2022-12-31
0000095029
rgr:UnaffiliatedCastingsMember
2024-01-01
2024-12-31
0000095029
rgr:UnaffiliatedCastingsMember
2023-01-01
2023-12-31
0000095029
rgr:UnaffiliatedCastingsMember
2022-01-01
2022-12-31
0000095029
2023-01-01
2023-12-31
0000095029
2022-01-01
2022-12-31
0000095029
us-gaap:CommonStockMember
2021-12-31
0000095029
us-gaap:AdditionalPaidInCapitalMember
2021-12-31
0000095029
us-gaap:RetainedEarningsMember
2021-12-31
0000095029
us-gaap:TreasuryStockCommonMember
2021-12-31
0000095029
2021-12-31
0000095029
us-gaap:RetainedEarningsMember
2022-01-01
2022-12-31
0000095029
us-gaap:AdditionalPaidInCapitalMember
2022-01-01
2022-12-31
0000095029
us-gaap:CommonStockMember
2022-01-01
2022-12-31
0000095029
us-gaap:TreasuryStockCommonMember
2022-01-01
2022-12-31
0000095029
us-gaap:CommonStockMember
2022-12-31
0000095029
us-gaap:AdditionalPaidInCapitalMember
2022-12-31
0000095029
us-gaap:RetainedEarningsMember
2022-12-31
0000095029
us-gaap:TreasuryStockCommonMember
2022-12-31
0000095029
2022-12-31
0000095029
us-gaap:RetainedEarningsMember
2023-01-01
2023-12-31
0000095029
us-gaap:AdditionalPaidInCapitalMember
2023-01-01
2023-12-31
0000095029
us-gaap:CommonStockMember
2023-01-01
2023-12-31
0000095029
us-gaap:TreasuryStockCommonMember
2023-01-01
2023-12-31
0000095029
us-gaap:CommonStockMember
2023-12-31
0000095029
us-gaap:AdditionalPaidInCapitalMember
2023-12-31
0000095029
us-gaap:RetainedEarningsMember
2023-12-31
0000095029
us-gaap:TreasuryStockCommonMember
2023-12-31
0000095029
us-gaap:RetainedEarningsMember
2024-01-01
2024-12-31
0000095029
us-gaap:AdditionalPaidInCapitalMember
2024-01-01
2024-12-31
0000095029
us-gaap:CommonStockMember
2024-01-01
2024-12-31
0000095029
us-gaap:TreasuryStockCommonMember
2024-01-01
2024-12-31
0000095029
us-gaap:CommonStockMember
2024-12-31
0000095029
us-gaap:AdditionalPaidInCapitalMember
2024-12-31
0000095029
us-gaap:RetainedEarningsMember
2024-12-31
0000095029
us-gaap:TreasuryStockCommonMember
2024-12-31
0000095029
us-gaap:SalesMember
us-gaap:CustomerConcentrationRiskMember
rgr:FirearmsMember
2024-01-01
2024-12-31
0000095029
us-gaap:SalesMember
us-gaap:CustomerConcentrationRiskMember
rgr:ExportSalesMember
2024-01-01
2024-12-31
0000095029
us-gaap:SalesMember
us-gaap:CustomerConcentrationRiskMember
rgr:CastingsSalesMember
2024-01-01
2024-12-31
0000095029
us-gaap:BuildingMember
2024-12-31
0000095029
us-gaap:MachineryAndEquipmentMember
2024-12-31
0000095029
us-gaap:ToolsDiesAndMoldsMember
2024-12-31
0000095029
rgr:CustomerOneMember
us-gaap:AccountsReceivableMember
us-gaap:CustomerConcentrationRiskMember
2024-01-01
2024-12-31
0000095029
rgr:CustomerTwoMember
us-gaap:AccountsReceivableMember
us-gaap:CustomerConcentrationRiskMember
2024-01-01
2024-12-31
0000095029
rgr:CustomerThreeMember
us-gaap:AccountsReceivableMember
us-gaap:CustomerConcentrationRiskMember
2024-01-01
2024-12-31
0000095029
rgr:CustomerFourMember
us-gaap:AccountsReceivableMember
us-gaap:CustomerConcentrationRiskMember
2024-01-01
2024-12-31
0000095029
rgr:CustomerOneMember
us-gaap:AccountsReceivableMember
us-gaap:CustomerConcentrationRiskMember
2023-01-01
2023-12-31
0000095029
rgr:CustomerTwoMember
us-gaap:AccountsReceivableMember
us-gaap:CustomerConcentrationRiskMember
2023-01-01
2023-12-31
0000095029
rgr:CustomerThreeMember
us-gaap:AccountsReceivableMember
us-gaap:CustomerConcentrationRiskMember
2023-01-01
2023-12-31
0000095029
us-gaap:LandImprovementsMember
2024-12-31
0000095029
us-gaap:LandImprovementsMember
2023-12-31
0000095029
us-gaap:BuildingAndBuildingImprovementsMember
2024-12-31
0000095029
us-gaap:BuildingAndBuildingImprovementsMember
2023-12-31
0000095029
us-gaap:MachineryAndEquipmentMember
2023-12-31
0000095029
us-gaap:ToolsDiesAndMoldsMember
2023-12-31
0000095029
rgr:TradeNameMember
2024-12-31
0000095029
us-gaap:CustomerRelationshipsMember
2024-12-31
0000095029
us-gaap:OtherAssetsMember
2024-12-31
0000095029
us-gaap:OtherAssetsMember
2023-12-31
0000095029
rgr:TradeAccountsPayableAndAccruedExpensesMember
2024-12-31
0000095029
rgr:TradeAccountsPayableAndAccruedExpensesMember
2023-12-31
0000095029
rgr:LeaseLiabilitiesMember
2024-12-31
0000095029
rgr:LeaseLiabilitiesMember
2023-12-31
0000095029
rgr:OperatingLeaseMember
2024-12-31
0000095029
2022-11-30
0000095029
rgr:S2022Q4DividendsMember
2022-11-30
2022-11-30
0000095029
2023-01-05
0000095029
rgr:S2022Q4DividendsMember
2023-01-05
2023-01-05
0000095029
2022-01-07
0000095029
2024-06-06
2024-06-06
0000095029
srt:ScenarioForecastMember
2025-01-01
2025-12-31
0000095029
rgr:JulyThreeToJulyThirtyMember
rgr:ThirdQuarter2022Member
2022-07-01
2022-09-30
0000095029
rgr:JulyThreeToJulyThirtyMember
rgr:ThirdQuarter2022Member
2022-09-30
0000095029
rgr:JulyThirtyoneToAugustTwentySevenMember
rgr:ThirdQuarter2022Member
2022-07-01
2022-09-30
0000095029
rgr:JulyThirtyoneToAugustTwentySevenMember
rgr:ThirdQuarter2022Member
2022-09-30
0000095029
rgr:AugustTwentyEightToOctoberOneMember
rgr:ThirdQuarter2022Member
2022-07-01
2022-09-30
0000095029
rgr:AugustTwentyEightToOctoberOneMember
rgr:ThirdQuarter2022Member
2022-09-30
0000095029
rgr:OctoberTwoToOctoberTwentyNineMember
rgr:FourthQuarter2022Member
2022-10-01
2022-12-31
0000095029
rgr:OctoberTwoToOctoberTwentyNineMember
rgr:FourthQuarter2022Member
2022-12-31
0000095029
rgr:OctoberThirtyToNovemberTwentySevenMember
rgr:FourthQuarter2022Member
2022-10-01
2022-12-31
0000095029
rgr:OctoberThirtyToNovemberTwentySevenMember
rgr:FourthQuarter2022Member
2022-12-31
0000095029
rgr:NovemberTwentySevenToDecemberThirtyOneMember
rgr:FourthQuarter2022Member
2022-10-01
2022-12-31
0000095029
rgr:NovemberTwentySevenToDecemberThirtyOneMember
rgr:FourthQuarter2022Member
2022-12-31
0000095029
rgr:OctoberOneToOctoberTwentyEightMember
rgr:FourthQuarter2023Member
2023-10-01
2023-12-31
0000095029
rgr:OctoberOneToOctoberTwentyEightMember
rgr:FourthQuarter2023Member
2023-12-31
0000095029
rgr:OctoberTwentyNineToNovemberTwentyFiveMember
rgr:FourthQuarter2023Member
2023-10-01
2023-12-31
0000095029
rgr:OctoberTwentyNineToNovemberTwentyFiveMember
rgr:FourthQuarter2023Member
2023-12-31
0000095029
rgr:NovemberTwentySixToDecemberThirtyOneMember
rgr:FourthQuarter2023Member
2023-10-01
2023-12-31
0000095029
rgr:NovemberTwentySixToDecemberThirtyOneMember
rgr:FourthQuarter2023Member
2023-12-31
0000095029
rgr:JanuaryOneToJanuaryTwentySevenMember
rgr:FirstQuarter2024Member
2024-01-01
2024-03-31
0000095029
rgr:JanuaryOneToJanuaryTwentySevenMember
rgr:FirstQuarter2024Member
2024-03-31
0000095029
rgr:JanuaryTwentyEightToFebruaryTwentyFourMember
rgr:FirstQuarter2024Member
2024-01-01
2024-03-31
0000095029
rgr:JanuaryTwentyEightToFebruaryTwentyFourMember
rgr:FirstQuarter2024Member
2024-03-31
0000095029
rgr:FebruaryTwentyFiveToMarchThirtyMember
rgr:FirstQuarter2024Member
2024-01-01
2024-03-31
0000095029
rgr:FebruaryTwentyFiveToMarchThirtyMember
rgr:FirstQuarter2024Member
2024-03-31
0000095029
rgr:MarchThirtyOneToAprilTwentySevenMember
rgr:SecondQuarter2024Member
2024-04-01
2024-06-30
0000095029
rgr:MarchThirtyOneToAprilTwentySevenMember
rgr:SecondQuarter2024Member
2024-06-30
0000095029
rgr:AprilTwentyEightToMayTwentyFiveMember
rgr:SecondQuarter2024Member
2024-04-01
2024-06-30
0000095029
rgr:AprilTwentyEightToMayTwentyFiveMember
rgr:SecondQuarter2024Member
2024-06-30
0000095029
rgr:MayTwentySixToJuneTwentyNineMember
rgr:SecondQuarter2024Member
2024-04-01
2024-06-30
0000095029
rgr:MayTwentySixToJuneTwentyNineMember
rgr:SecondQuarter2024Member
2024-06-30
0000095029
rgr:JuneThirtyToJulyTwentySevenMember
rgr:ThirdQuarter2024Member
2024-07-01
2024-09-30
0000095029
rgr:JuneThirtyToJulyTwentySevenMember
rgr:ThirdQuarter2024Member
2024-09-30
0000095029
rgr:JulyTwentyEightToAugustTwentyFourMember
rgr:ThirdQuarter2024Member
2024-07-01
2024-09-30
0000095029
rgr:JulyTwentyEightToAugustTwentyFourMember
rgr:ThirdQuarter2024Member
2024-09-30
0000095029
rgr:AugustTwentyFiveToSeptemberTwentyEightMember
rgr:ThirdQuarter2024Member
2024-07-01
2024-09-30
0000095029
rgr:AugustTwentyFiveToSeptemberTwentyEightMember
rgr:ThirdQuarter2024Member
2024-09-30
0000095029
rgr:SeptemberTwentyNineToOctoberTwentySixMember
rgr:FourthQuarter2024Member
2024-10-01
2024-12-31
0000095029
rgr:SeptemberTwentyNineToOctoberTwentySixMember
rgr:FourthQuarter2024Member
2024-12-31
0000095029
rgr:OctoberTwentySevenToNovemberTwentyThreeMember
rgr:FourthQuarter2024Member
2024-10-01
2024-12-31
0000095029
rgr:OctoberTwentySevenToNovemberTwentyThreeMember
rgr:FourthQuarter2024Member
2024-12-31
0000095029
rgr:NovemberTwentyThreeToDecemberThirtyOneMember
rgr:FourthQuarter2024Member
2024-10-01
2024-12-31
0000095029
rgr:NovemberTwentyThreeToDecemberThirtyOneMember
rgr:FourthQuarter2024Member
2024-12-31
0000095029
2024-10-01
2024-12-31
0000095029
rgr:StockIncentivePlan2017Member
2017-05-31
0000095029
rgr:StockIncentivePlan2023Member
2023-12-31
0000095029
rgr:StockIncentivePlan2023Member
2024-12-31
0000095029
srt:DirectorMember
rgr:DeferredStockMember
rgr:VestInJune2025Member
2024-01-01
2024-12-31
0000095029
srt:DirectorMember
rgr:DeferredStockMember
rgr:VestInJune2027Member
2024-01-01
2024-12-31
0000095029
srt:DirectorMember
rgr:DeferredStockMember
rgr:VestInJune2024Member
2023-01-01
2023-12-31
0000095029
srt:DirectorMember
rgr:DeferredStockMember
rgr:VestInJune2026Member
2023-01-01
2023-12-31
0000095029
srt:DirectorMember
rgr:DeferredStockMember
rgr:VestInMay2023Member
2022-01-01
2022-12-31
0000095029
srt:DirectorMember
rgr:DeferredStockMember
rgr:VestingInMay2025Member
2022-01-01
2022-12-31
0000095029
srt:DirectorMember
rgr:DeferredStockMember
rgr:VestInJune2027Member
2022-01-01
2022-12-31
0000095029
rgr:DeferredStockMember
2024-01-01
2024-12-31
0000095029
rgr:DeferredStockMember
2023-01-01
2023-12-31
0000095029
rgr:DeferredStockMember
2022-01-01
2022-12-31
0000095029
us-gaap:RestrictedStockUnitsRSUMember
2024-01-01
2024-12-31
0000095029
us-gaap:RestrictedStockUnitsRSUMember
2024-12-31
0000095029
srt:MinimumMember
us-gaap:RestrictedStockUnitsRSUMember
2024-01-01
2024-12-31
0000095029
srt:MaximumMember
us-gaap:RestrictedStockUnitsRSUMember
2024-01-01
2024-12-31
0000095029
us-gaap:RestrictedStockUnitsRSUMember
2023-01-01
2023-12-31
0000095029
us-gaap:RestrictedStockUnitsRSUMember
2023-12-31
0000095029
srt:MinimumMember
us-gaap:RestrictedStockUnitsRSUMember
2023-01-01
2023-12-31
0000095029
srt:MaximumMember
us-gaap:RestrictedStockUnitsRSUMember
2023-01-01
2023-12-31
0000095029
us-gaap:RestrictedStockUnitsRSUMember
2022-01-01
2022-12-31
0000095029
us-gaap:RestrictedStockUnitsRSUMember
2022-12-31
0000095029
srt:MinimumMember
us-gaap:RestrictedStockUnitsRSUMember
2022-01-01
2022-12-31
0000095029
srt:MaximumMember
us-gaap:RestrictedStockUnitsRSUMember
2022-01-01
2022-12-31
0000095029
rgr:LipseysMember
us-gaap:SalesRevenueNetMember
us-gaap:CustomerConcentrationRiskMember
2024-01-01
2024-12-31
0000095029
rgr:SportsSouthMember
us-gaap:SalesRevenueNetMember
us-gaap:CustomerConcentrationRiskMember
2024-01-01
2024-12-31
0000095029
rgr:DavidsonsMember
us-gaap:SalesRevenueNetMember
us-gaap:CustomerConcentrationRiskMember
2024-01-01
2024-12-31
0000095029
rgr:LipseysMember
us-gaap:SalesRevenueNetMember
us-gaap:CustomerConcentrationRiskMember
2023-01-01
2023-12-31
0000095029
rgr:DavidsonsMember
us-gaap:SalesRevenueNetMember
us-gaap:CustomerConcentrationRiskMember
2023-01-01
2023-12-31
0000095029
rgr:SportsSouthMember
us-gaap:SalesRevenueNetMember
us-gaap:CustomerConcentrationRiskMember
2023-01-01
2023-12-31
0000095029
rgr:LipseysMember
us-gaap:SalesRevenueNetMember
us-gaap:CustomerConcentrationRiskMember
2022-01-01
2022-12-31
0000095029
rgr:DavidsonsMember
us-gaap:SalesRevenueNetMember
us-gaap:CustomerConcentrationRiskMember
2022-01-01
2022-12-31
0000095029
rgr:SportsSouthMember
us-gaap:SalesRevenueNetMember
us-gaap:CustomerConcentrationRiskMember
2022-01-01
2022-12-31
0000095029
country:US
us-gaap:SalesRevenueNetMember
us-gaap:CustomerConcentrationRiskMember
2024-01-01
2024-12-31
0000095029
country:US
us-gaap:SalesRevenueNetMember
us-gaap:CustomerConcentrationRiskMember
2023-01-01
2023-12-31
0000095029
country:US
us-gaap:SalesRevenueNetMember
us-gaap:CustomerConcentrationRiskMember
2022-01-01
2022-12-31
0000095029
rgr:FirearmsMember
2024-01-01
2024-12-31
0000095029
rgr:FirearmsMember
2023-01-01
2023-12-31
0000095029
rgr:FirearmsMember
2022-01-01
2022-12-31
0000095029
rgr:CastingsMember
rgr:CastingsUnaffiliatedMember
2024-01-01
2024-12-31
0000095029
rgr:CastingsMember
rgr:CastingsUnaffiliatedMember
2023-01-01
2023-12-31
0000095029
rgr:CastingsMember
rgr:CastingsUnaffiliatedMember
2022-01-01
2022-12-31
0000095029
rgr:CastingsMember
rgr:IntersegmentMember
2024-01-01
2024-12-31
0000095029
rgr:CastingsMember
rgr:IntersegmentMember
2023-01-01
2023-12-31
0000095029
rgr:CastingsMember
rgr:IntersegmentMember
2022-01-01
2022-12-31
0000095029
rgr:CastingsMember
2024-01-01
2024-12-31
0000095029
rgr:CastingsMember
2023-01-01
2023-12-31
0000095029
rgr:CastingsMember
2022-01-01
2022-12-31
0000095029
rgr:EliminationsMember
2024-01-01
2024-12-31
0000095029
rgr:EliminationsMember
2023-01-01
2023-12-31
0000095029
rgr:EliminationsMember
2022-01-01
2022-12-31
0000095029
rgr:CorporatesMember
2024-01-01
2024-12-31
0000095029
rgr:CorporatesMember
2023-01-01
2023-12-31
0000095029
rgr:CorporatesMember
2022-01-01
2022-12-31
0000095029
rgr:FirearmsMember
2024-12-31
0000095029
rgr:FirearmsMember
2023-12-31
0000095029
rgr:FirearmsMember
2022-12-31
0000095029
rgr:CastingsMember
2024-12-31
0000095029
rgr:CastingsMember
2023-12-31
0000095029
rgr:CastingsMember
2022-12-31
0000095029
rgr:CorporatesMember
2024-12-31
0000095029
rgr:CorporatesMember
2023-12-31
0000095029
rgr:CorporatesMember
2022-12-31
0000095029
2024-01-01
2024-03-30
0000095029
2024-04-01
2024-06-29
0000095029
2024-07-01
2024-09-28
0000095029
2023-01-01
2023-04-01
0000095029
2023-04-05
2023-07-01
0000095029
2023-07-05
2023-09-30
0000095029
2023-10-01
2023-12-31
0000095029
rgr:NationalRifleAssociationMember
2024-01-01
2024-12-31
0000095029
rgr:NationalShootingSportsFoundationMember
2024-01-01
2024-12-31
0000095029
rgr:NationalRifleAssociationMember
2023-01-01
2023-12-31
0000095029
rgr:NationalRifleAssociationMember
2022-01-01
2022-12-31
0000095029
rgr:NationalShootingSportsFoundationMember
2023-01-01
2023-12-31
0000095029
rgr:NationalShootingSportsFoundationMember
2022-01-01
2022-12-31
0000095029
2021-01-01
2021-12-31
0000095029
rgr:TrademarkLitigationMember
2024-01-01
2024-12-31
0000095029
rgr:TrademarkLawsuitMember
2024-01-01
2024-12-31
0000095029
rgr:TraditionalProductLiabilityLawsuitMember
2024-01-01
2024-12-31
0000095029
rgr:MunicipalLawsuitMember
2024-01-01
2024-12-31
0000095029
rgr:UnfairTradePracticesMember
2024-01-01
2024-12-31
0000095029
rgr:TraditionalProductLiabilityLawsuitMember
2023-01-01
2023-12-31
0000095029
rgr:MunicipalLawsuitMember
2023-01-01
2023-12-31
0000095029
rgr:UnfairTradePracticesMember
2023-01-01
2023-12-31
0000095029
rgr:NegligenceLawsuitMember
2023-01-01
2023-12-31
0000095029
rgr:TraditionalProductLiabilityLawsuitMember
2022-01-01
2022-12-31
0000095029
rgr:MunicipalLawsuitMember
2022-01-01
2022-12-31
0000095029
rgr:NegligenceLawsuitMember
2022-01-01
2022-12-31
0000095029
rgr:ProductLiabilityReserveMemberMember
2021-12-31
0000095029
rgr:ProductLiabilityReserveMemberMember
2022-01-01
2022-12-31
0000095029
rgr:ProductLiabilityReserveMemberMember
2022-12-31
0000095029
rgr:ProductLiabilityReserveMemberMember
2023-01-01
2023-12-31
0000095029
rgr:ProductLiabilityReserveMemberMember
2023-12-31
0000095029
rgr:ProductLiabilityReserveMemberMember
2024-01-01
2024-12-31
0000095029
rgr:ProductLiabilityReserveMemberMember
2024-12-31
0000095029
rgr:AccruedLegalExpenseMember
2022-01-01
2022-12-31
0000095029
rgr:InsurancePremiumExpenseMember
2022-01-01
2022-12-31
0000095029
rgr:TotalProductLiabilityExpenseMember
2022-12-31
0000095029
rgr:AccruedLegalExpenseMember
2023-01-01
2023-12-31
0000095029
rgr:InsurancePremiumExpenseMember
2023-01-01
2023-12-31
0000095029
rgr:TotalProductLiabilityExpenseMember
2023-12-31
0000095029
rgr:AccruedLegalExpenseMember
2024-01-01
2024-12-31
0000095029
rgr:InsurancePremiumExpenseMember
2024-01-01
2024-12-31
0000095029
rgr:TotalProductLiabilityExpenseMember
2024-12-31
0000095029
us-gaap:SubsequentEventMember
2025-02-14
0000095029
rgr:JohnACosentinoJrMember
2024-10-01
2024-12-31
0000095029
rgr:JohnACosentinoJrMember
2024-12-31
iso4217:USD
xbrli:shares
iso4217:USD
xbrli:shares
xbrli:pure
rgr:segments
Sturm, Ruger & Company, Inc.
Insider Trading Policy
The purpose of this Insider Trading Policy (this
“Policy”) is both to inform you of your legal responsibilities and to make clear that the misuse of sensitive information
is contrary to Company policy and will be dealt with severely. The violation of any of the policies and rules in this Policy could result
in the civil or criminal penalties described above and termination of your employment or other relationship with the Company. This Policy
applies to all Company officers, employees, directors, their family members and other persons living in their households, and trusts and
other entities (including charitable organizations) over which they have or share voting or investment control.
Each director, officer, and employee has a duty
to cooperate in any investigation or other effort by the Company to respond to a report of a suspected violation of this Policy and the
Company will not tolerate any efforts to cover up a violation or otherwise impede an investigation or corrective action. Any such conduct
is itself a violation of this Policy.
As an essential part of your work for or with
the Company, many of you use or have access to material nonpublic information about the Company or its suppliers, customers, and other
business partners. Those of you who possess or monitor such information hold a special position of trust and confidence toward it.
While it is not possible to identify in advance
all information that will be deemed to be material, some illustrations of such information would include: earnings, results of operations,
dividend actions, mergers and acquisitions, major discoveries, major new products, developments regarding customers, suppliers, or business
partners, changes in auditors or an auditor notification that the Company may no longer rely on an auditor’s report, events regarding
the Company’s stock, including repurchase plans, changes to the rights of securities holders, and public and private sales of additional
stock, financial condition, material litigation, regulatory issues, cash flows, significant advances in research, major personnel changes,
labor situations, major shutdowns, unusual gains or losses in major operations, the early termination of a Company insider trading window,
and major marketing changes. If you are considering purchasing or selling securities of the Company (or some other company) because of
some piece of information concerning a potential or pending, but unannounced, event or development, it is likely material.
On occasion, it may be necessary for legitimate
Company-related business reasons to disclose material nonpublic information to persons outside the Company. This might include, for example,
commercial bankers, investment bankers, or companies seeking to engage in a joint venture, merger, or common investment, or other joint
goal with the Company. In such circumstances, the information must not be conveyed until an express, written agreement has been reached
that such information is not to be used for trading purposes and may not be further disclosed other than for legitimate business reasons
and only as permitted pursuant to the terms of such agreement.
From time to time, the Company receives inquiries
concerning factual matters that could affect the market for the Company’s securities from financial analysts, shareholders, reporters,
and others outside the Company. In order to guard against the release of material nonpublic information, such inquiries should be referred
to the Company’s General Counsel.
If material nonpublic information is disclosed
by any Company director, officer, or employee in violation of this Policy, any person making or discovering that disclosure must immediately
report all relevant facts to the Company’s General Counsel for a decision regarding appropriate remedial steps.
The Company has adopted the following guidelines
for Company officers, directors, and employees who know of material nonpublic information and are contemplating securities transactions.
These guidelines also apply to the family members and other persons living in the household of any Company officer, director, or employee,
and any trust, entity, or group owned or controlled by any of the foregoing persons, and any other entity (including charitable organizations)
or group where any of the foregoing persons has or shares with others the power to decide whether to buy or sell Company securities:
1.
An appropriate method of purchases or sales is through a periodic investment plan adopted by a director, officer, or employee at
a time when such director, officer or employee is not in possession of material nonpublic information and pursuant to which such person
makes purchases or sales under an established written plan administered by a broker, where the timing of each transaction is outside
the control of the officer, director, or employee, and that otherwise satisfies the requirements of SEC Rule 10b5-1. (See Rule
10b5-1 Plans, described more fully below.)
2.
Officers, directors, and employees are generally permitted to buy or sell stock in the Company for a thirty (30) day period
beginning on the fourth trading day after the Company’s Annual Report on Form 10-K or any Quarterly Report on Form 10-Q has been
filed with the SEC, provided that prior to engaging in any transaction an officer or director must contact the Company’s General
Counsel to notify them of the potential transactions and make sure that there are no important developments pending which need to be made
public before they may trade. This trading “window” will generally remain open until the earliest of the following to occur:
Officers and directors are required to check with
the Company’s General Counsel to determine if the trading “window” for a period is closed. Moreover, officers, directors,
and employees should consider the following before purchasing or selling the Company’s securities:
1.
whether they are aware of a development of major importance that is expected to reach the appropriate time for announcement within
the next few months, or
2.
recent earnings, dividends, or other important developments that have not yet appeared in the press or been publicly disclosed
by the Company.
As noted above, these guidelines also apply to the family members
and other persons living in the household of any Company officer, director, or employee, and any trust, entity, or group owned or controlled
by any of the foregoing persons, and any other entity or group where any of the foregoing persons has or shares with others the power
to decide whether to buy or sell Company securities.
If you have any questions at all as to whether a transaction
that you wish to engage in is prohibited by this Policy, you should consult with the Company’s General Counsel.
Rule 10b5-1 plans provide a safe harbor to insiders
who purchase or sell securities while in possession of material nonpublic information. Because Rule 10b5-1 plans and related transactions
are complex and the related legal requirements for Rule 10b5-1 plans were comprehensively revised by the SEC in 2022, we urge you to contact
counsel before adopting, modifying, or terminating a Rule 10b5-1 plan. The Company will allow certain otherwise prohibited transactions
to be made provided that they are made in compliance with SEC Rule 10b5-1.
In accordance with Rule 10b5-1, the Company will
permit the purchase or sale of Company securities outside of a trading window or while an insider is in possession of material nonpublic
information if the sale is made pursuant to a plan that qualifies for the “affirmative defenses” under Rule 10b5-1 (as described
below). The Company reserves the right to prohibit transactions that comply with Rule 10b5-1 if it believes they are prohibited under
any other law, order, rule, or regulation.
Rule 10b5-1 provides that any purchase or sale
of securities while an insider is in possession of material nonpublic information is illegal, without any need to show that the information
was a motivating factor in making the sale. Because the definition of material nonpublic information is so vague, insiders are frequently
unsure whether information they are aware of might later be deemed material. Rule 10b5-1 abolishes any distinction between “use”
and “possession” of material nonpublic information and increases the risks for insiders who engage in securities transactions
at a time when they arguably know material nonpublic information. Rule 10b5-1, however, establishes exceptions (i.e., “affirmative
defenses”) that allow insiders to trade under certain defined circumstances irrespective of the material nonpublic information within
their possession. These affirmative defenses are described below and are attached hereto as Exhibit A.
An insider may trade if, before becoming aware
of the material nonpublic information, that person:
1.
Entered into a binding contract to purchase or sell the security, provided instructions to another person to execute the trade
for the instructing person’s account, or adopted a written plan for trading securities;
2.
Demonstrates that the contract, instructions or plan either (1) expressly specified the amount, price, and date, (2) provided a
written formula or algorithm for determining amounts, prices, and dates of purchases or sales, or (3) did not permit the person to exercise
any subsequent influence over how, when or whether to effect purchases or sales; and
3.
Demonstrates that the purchase or sale that occurred was pursuant to the prior contract, instruction or plan and that he or she
did not alter or deviate from the prior contract, instruction, or plan.
The SEC refers to these exceptions as “affirmative
defenses” because the burden will be strictly on the insider to prove compliance. The key to complying with Rule 10b5-1 is to adopt
a highly specific, written trading plan that does not leave the insider any subsequent discretion as to the amount or timing of the sales
(a “10b5-1 Plan”), and then adhere strictly to that 10b5-1 Plan. The defense to liability will be lost if the 10b5-1 Plan
is terminated or altered at a time when the individual is in possession of material nonpublic information. Departing from the 10b5-1 Plan
in any way (including by selling “additional” shares not originally specified in the 10b5-1 Plan) will be considered an alteration
of the 10b5-1 Plan. If you decide to adopt such a 10b5-1 Plan, you must adhere to the following:
1.
Deliver a copy of the 10b5-1 Plan (signed and dated by you) to the Company’s General Counsel for his or her review and
approval at least ten (10) days prior to its adoption and, if you are an officer or director, provide the General Counsel with a description
of all material terms of such 10b5-1 Plan, including (i) the date on which such 10b5-1 Plan is or will be adopted, (ii) the duration
of such 10b5-1 Plan, and (iii) the aggregate number of Company securities that may be purchased or sold under such 10b5-1 Plan.
2.
Deliver to the Company’s General Counsel a copy of the 10b5-1 Plan signed by your broker, trustee or other party involved
in the 10b5-1 Plan or other acknowledgment of their intent to follow the 10b5-1 Plan.
3.
The 10b5-1 Plan must be adopted by you and delivered to the Company’s General Counsel during a period that is not a blackout
period and when you do not otherwise possess any material nonpublic information.
4.
The 10b5-1 Plan must have a term (start and end date). The 10b5-1 Plan must not commence until after the Company’s receipt
of your signed 10b5-1 Plan.
5.
The 10b5-1 Plan must have a term of at least six (6) months.
6.
For any 10b5-1 Plan adopted by an officer or director, no transactions can be effectuated under the 10b5-1 Plan during a “cooling
off” period with a duration equal to the later of (i) ninety (90) days after the 10b5-1 Plan is adopted and (ii) two (2) business
days after the Company’s financial results for the fiscal quarter in which the 10b5-1 Plan is adopted, provided that the “cooling
off” period should not exceed one hundred twenty (120) days. For any 10b5-1 Plan adopted by any employee who is not an officer,
the “cooling off” period must be at least thirty (30) days. A “cooling off” period of equal duration will also
be required if you make any material modification to any 10b5-1 Plan.
7.
Changes to a 10b5-1 Plan must be avoided during the term of such 10b5-1 Plan. Any change must be made only during an open window
period and while you are not otherwise in possession of any material nonpublic information. The following changes to a 10b5-1 Plan are
deemed to constitute a termination of such 10b5-1 Plan and the adoption of a new 10b5-1 Plan (that will, at a minimum, require you to
comply with a new “cooling off” period before transacting under such 10b5-1 Plan): (i) any change to the amount, price, or
timing of the purchase or sale of Company securities subject to a 10b5-1 Plan, and (ii) any modification to a 10b5-1 Plan that changes
the price or date on which purchases or sales of Company securities are to be executed, including the substitution or removal of the broker
executing trades pursuant to the 10b5-1 Plan.
8.
You must enter into the 10b5-1 Plan in good faith, not in an attempt to circumvent the securities laws or this Policy, and must
act in good faith with respect to the 10b5-1 Plan. Each 10b5-1 Plan entered into by any director or officer must contain a representation
by such director or officer certifying, at the time of adoption of the 10b5-1 Plan, that such director or officer (i) is not aware of
any material nonpublic information and (ii) is adopting the 10b5-1 Plan in good faith and not as part of a plan or scheme to evade Rule
10b5-1.
9.
You generally cannot have more than one 10b5-1 Plan in effect at a time. If you wish to have multiple 10b5-1 Plans in effect at
the same time (including sequential 10b5-1 Plans that go into effect after the expiration of a prior 10b5-1 Plan) you must provide copies
of the 10b5-1 Plans to the Company’s General Counsel at least fifteen (15) days prior to the adoption of any such 10b5-1 Plan for
review and approval and ensure that such 10b5-1 Plans qualify for the limited circumstances under Rule 10b5-1 in which an insider may
maintain multiple 10b5-1 Plans.
10.
You generally cannot adopt any 10b5-1 Plan designed to purchase or sell all Company securities subject to the 10b5-1 Plan in a
single transaction (a “single-trade plan”) if you have adopted another “single-trade plan” in the prior twelve
(12) month period.
Note that the Company’s acceptance, or the
General Counsel’s approval, of a 10b5-1 Plan does NOT mean that the 10b5-1 Plan meets the requirement of Rule 10b5-1, nor does it
mean you will be insulated from insider trading liability or liability under other securities regulations. You are ultimately responsible
for your own compliance with Rule 10b5-1 and other applicable state and federal securities laws. The Company has no obligation to monitor
your trading activities (whether to ensure you are complying with your 10b5-1 Plans or otherwise). However, the Company reserves the right
to halt a transaction that it determines fails to meet the terms of the 10b5-1 Plan, Rule 10b5-1, or this Policy.
In addition, any additional charges that the Company
incurs as a result of your adoption of a 10b5-1 Plan or Non-10b5-1 Plan will be borne by you.
Section 16 of the Securities Exchange Act of 1934,
as amended, requires that any profit realized by a director, officer, or holder of 10% or more of the Company’s securities (each
a “Section 16 Insider”) from a purchase and sale of any equity securities of the Company within a period of less than six
(6) months be disgorged to the Company. To monitor compliance with this rule, Section 16 Insiders must publicly report their beneficial
ownership of equity securities of the Company through regular filings with the SEC on Forms 3, 4, or 5, depending on the circumstances.
All directors and officers are required to immediately report all transactions involving Company equity securities (whether made pursuant
to a 10b5-1 Plan or otherwise) to the Company’s General Counsel and Chief Financial Officer.
Section 16(a) generally requires each Section
16 Insider to report changes in his or her “beneficial ownership” of equity securities of the Company (i.e., common stock,
RSUs, and options exercisable for common stock) by (i) electronically filing a Form 4 with the SEC within two (2) business days after
the date of the transaction that effected the change in beneficial ownership and (ii) with respect to certain exempt transactions and
other transactions that were not contemporaneously reported on Form 4, electronically filing a Form 5 with the SEC within forty-five (45)
days after the end of each fiscal year of the Company. Beginning in 2023, the universe of transactions that can be reported on a deferred
basis on Form 5 has been narrowed: for example, gifts of Company securities must be reported on Form 4 within two (2) business days following
the date of such gifts. Directors and officers should consult with the Company’s General Counsel if they are engaging in a transaction
involving Company securities that they believe is not required to be immediately disclosed on Form 4.
For reporting purposes, a Section 16 Insider is
the beneficial owner of any securities in which the Section 16 Insider has a “pecuniary interest.” Any opportunity to profit
from a transaction in the securities will create a pecuniary interest in those securities. In addition to securities that are owned by
the Section 16 Insider directly or held in “street name” for the Section 16 Insider’s account, a Section 16 Insider
will generally be deemed to have a pecuniary interest in, among others, securities (i) owned by any family member sharing the same address,
(ii) owned by a corporation, partnership, trust or other entity controlled by the Section 16 Insider (generally to the extent of the Section
16 Insider’s proportionate economic interest in such entity), or (iii) which may be acquired upon the exercise of stock options
or the conversion of convertible securities owned.
Though most RSU and restricted stock grants to
directors and officers under the Company’s stock incentive plans will be exempt under Section 16(b) pursuant to Rule 16b-3, they
nevertheless generally must be reported on Form 4 within two (2) business days of the grant. Similarly, the exercise of an option must
be reported on a Form 4 within (2) two business days of the date of exercise, and the sale of common stock acquired upon an option exercise
or RSU vesting must be reported on a Form 4 within two (2) business days of the date of sale.
Section 16(b) of the Exchange Act provides that
any profit realized by a Section 16 Insider of the Company from any purchase and sale, or sale and purchase, of any equity securities
of the Company within any period of less than six (6) months may be recovered in a suit instituted by the Company or by a stockholder
on behalf of the Company. Accordingly, no Section 16 Insider should engage in both a purchase and a sale of Company equity securities
within any six (6) month period. Professional plaintiffs routinely review filings by insiders under Section 16(a) and threaten or institute
litigation to force companies to recover “short-swing” profits and to pay the plaintiffs’ legal fees.
The purchase or sale of any Company securities
that are beneficially owned by a Section 16 Insider for purposes of Section 16(a) (such as stock held in street name or owned by the
spouse or minor child of such director or officer) is generally considered to be a purchase or sale by such director or officer for purposes
of Section 16(b).
Before buying or selling stock or adopting, modifying, or terminating
a 10b5-1 Plan, please ask yourself these questions:
If there is any unresolved question in your mind
as to the applicability or interpretation of this Policy’s terms or the propriety of any desired action, the matter must be discussed
with the Company’s Legal Department prior to trading, disclosing information, or adopting, modifying, or terminating any 10b5-1
Plan or Non-10b5-1 Plan.
(1)(i) Subject to paragraph (c)(1)(ii), a person’s
purchase or sale is not on the basis of material nonpublic information if the person making the purchase or sale demonstrates that:
(C) The purchase or sale that occurred was
pursuant to the contract, instruction, or plan. A purchase or sale is not “pursuant to a contract, instruction, or plan” if,
among other things, the person who entered into the contract, instruction, or plan altered or deviated from the contract, instruction,
or plan to purchase or sell securities (whether by changing the amount, price, or timing of the purchase or sale), or entered into or
altered a corresponding or hedging transaction or position with respect to those securities.
(A) the contract, instruction, or plan
to purchase or sell securities was given or entered into in good faith and not as part of a plan or scheme to evade the prohibitions of
this section, and the person who entered into the contract, instruction, or plan has acted in good faith with respect to the contract,
instruction or plan;
(B) If the person who entered into the
contract, instruction, or plan is: (1) a director or officer of the issuer, no purchases or sales occur until expiration of a cooling-off
period consisting of the later of: (i) Ninety days after the adoption of the contract, instruction, or plan or (ii) Two business days
following the disclosure of the issuer’s financial results in a Form 10–Q or Form 10–K for the completed fiscal quarter
in which the plan was adopted . . . that discloses the issuer’s financial results (but, in any event, this required cooling-off
period is subject to a maximum of 120 days after adoption of the contract, instruction, or plan); or (2) not the issuer and not a director
or officer of the issuer, no purchases or sales occur until the expiration of a cooling-off period that is 30 days after the adoption
of the contract, instruction or plan;
(C) If the person who entered into a
plan as described in paragraph (c)(1)(i)(A)(3) of this section is a director or officer of the issuer of the securities, such director
or officer included a representation in the plan certifying that, on the date of adoption of the plan: (1) the individual director or
officer is not aware of any material nonpublic information about the security or issuer; and (2) the individual director or officer is
adopting the plan in good faith and not as part of a plan or scheme to evade the prohibitions of this section;
(D) The person (other than the issuer)
who entered into the contract, instruction, or plan has no outstanding (and does not subsequently enter into any additional) contract,
instruction, or plan that would qualify for the affirmative defense under paragraph (c)(1) of this section for purchases or sales of the
issuer’s securities on the open market; except that: (1) for purposes of this paragraph (c)(1)(ii)(D), a series of separate contracts
with different broker-dealers or other agents acting on behalf of the person (other than the issuer) to execute trades thereunder may
be treated as a single ‘‘plan,’’ provided that the individual constituent contracts with each broker-dealer or
other agent, when taken together as a whole, meet all of the applicable conditions of and remain collectively subject to the provisions
of this rule, including that a modification of any individual contract acts as modification of the whole contract, instruction of plan,
as defined in paragraph (c)(1)(iv) of this section. The substitution of a broker-dealer or other agent acting on behalf of the person
(other than the issuer) for another broker-dealer that is executing trades pursuant to a contract, instruction or plan shall not be a
modification of the contract, instruction, or plan (as defined in paragraph (c)(1)(iv) of this section) as long as the purchase or sales
instructions applicable to the substitute and substituted broker are identical with respect to the prices of securities to be purchased
or sold, dates of the purchases or sales to be executed, and amount of securities to be purchased or sold; and (2) the person (other than
the issuer) may have one later-commencing contract, instruction, or plan for purchases or sales of any securities of the issuer on the
open market under which trading is not authorized to begin until after all trades under the earlier commencing contract, instruction,
or plan are completed or expired without execution; provided, however, that if the first trade under the later commencing contract, instruction,
or plan is scheduled during the Effective Cooling-Off Period, the later commencing contract, instruction, or plan may not rely on this
paragraph (c)(1)(ii)(D)(2). For purposes of this paragraph (c)(1)(ii)(D)(2), ‘‘Effective Cooling-Off Period’’
means the cooling off period that would be applicable under paragraph (c)(1)(ii)(B) of this section with respect to the later commencing
contract, instruction, or plan if the date of adoption of the later commencing contract, instruction, or plan were deemed to be the date
of termination of the earlier-commencing contract, instruction, or plan; and (3) a contract, instruction, or plan providing for an eligible
sell-to-cover transaction shall not be considered an outstanding or additional contract, instruction, or plan under paragraph (c)(1)(ii)(D)
of this section, and such eligible sell-to-cover transaction shall not be subject to the limitation under paragraph (c)(1)(ii)(D) of this
section. A contract, instruction, or plan provides for an eligible sell-to-cover transaction where the contract, instruction, or plan
authorizes an agent to sell only such securities as are necessary to satisfy tax withholding obligations arising exclusively from the
vesting of a compensatory award, such as restricted stock or stock appreciation rights, and the insider does not otherwise exercise control
over the timing of such sales; and
(E) With respect to persons (other than
the issuer), if the contract, instruction, or plan does not provide for an eligible sell-to-cover transaction as described in paragraph
(c)(1)(ii)(D)(3) of this section and is designed to effect the open-market purchase or sale of the total amount of securities as a single
transaction, the person who entered into the contract, instruction, or plan has not during the prior 12-month period adopted a contract,
instruction, or plan that: (1) was designed to effect the open market purchase or sale of all of the securities covered by such prior
contract, instruction or plan, in a single transaction; and (2) would otherwise qualify for the affirmative defense under paragraph (c)(1)
of this section.
(2) A person other than a natural
person also may demonstrate that a purchase or sale of securities is not “on the basis of material nonpublic information if the
person demonstrates that:
(iv) Any modification or change to the
amount, price, or timing of the purchase or sale of the securities underlying a contract, instruction, or written plan as described in
paragraph (c)(1)(i)(A) of this section is a termination of such contract, instruction, or written plan, and the adoption of a new contract,
instruction, or written plan. A plan modification, such as the substitution or removal of a broker that is executing trades pursuant to
a Rule 10b5–1 arrangement on behalf of the person, that changes the price or date on which purchases or sales are to be executed,
is a termination of such plan and the adoption of a new plan.
We consent to the incorporation by reference in the Registration Statement
(No. 333-272443) on Form S-8 of Sturm, Ruger & Company, Inc. of our reports dated February 19, 2025, relating to the consolidated financial
statements, the financial statement schedule and the effectiveness of internal control over financial reporting of Sturm, Ruger &
Company, Inc, appearing in this Annual Report on Form 10-K of Sturm, Ruger & Company, Inc. for the year ended December 31, 2024.
I, Christopher J. Killoy, certify that:
Christopher J. Killoy
I, Thomas A. Dineen, certify that:
Thomas A. Dineen
Certification Pursuant to 18 U.S.C. Section 1350,
In connection with the Annual Report on Form 10-K
of Sturm, Ruger & Company, Inc. (the “Company”) for the period ended December 31, 2024, as filed with the Securities and
Exchange Commission on the date hereof (the “Report”), I, Christopher J. Killoy, Chief Executive Officer of the Company, hereby
certify, pursuant to 18 U.S.C. Section 1350, as adopted pursuant to Section 906 of the Sarbanes-Oxley Act of 2002, that, to the best of
my knowledge:
A signed original of this statement has been provided
to the Company and will be retained by the Company and furnished to the Securities and Exchange Commission or its staff upon request.
Certification Pursuant to 18 U.S.C. Section 1350,
In connection with the Annual Report on Form 10-K
of Sturm, Ruger & Company, Inc. (the “Company”) for the period ended December 31, 2024, as filed with the Securities and
Exchange Commission on the date hereof (the “Report”), I, Thomas A. Dineen, Senior Vice President, Treasurer and Chief Financial
Officer of the Company, hereby certify, pursuant to 18 U.S.C. Section 1350, as adopted pursuant to Section 906 of the Sarbanes-Oxley Act
of 2002, that, to the best of my knowledge:
A signed original of this statement has been provided
to the Company and will be retained by the Company and furnished to the Securities and Exchange Commission or its staff upon request.
