Bitcoin Price Enters Correction Phase On Its Path To Explode Above $110,000
27 Dicembre 2024 - 4:00PM
NEWSBTC
The Bitcoin price is still in a correction phase under
$100,000, as it is currently down by 1.93% in the past 24 hours.
Nonetheless, crypto analyst Titan of Crypto is sure that the
leading cryptocurrency is still maintaining its trajectory to the
$110,000 mark. According to the analyst, Bitcoin at $110,000 is
inevitable, although there remains the possibility of more price
declines in the short term. Bitcoin Price $110,000 Path And Current
Correction Phase Bitcoin fell short of the $110,000 mark when it
peaked at $108,135 on December 17. However, the cryptocurrency has
been on a notable correction path since then and is currently about
12% below this price level. Interestingly, the Bitcoin price even
corrected to $92,600 on December 23, which translated to a 14.36%
decline in five days from the $108,135 all-time high. Related
Reading: Analyst Says XRP Price Will Outperform Bitcoin And
Ethereum, Reveals ‘Secret Under The Hood’ Although the Bitcoin
price has recovered a bit since then, it has extended its
correction below the $100,000 psychological threshold without any
sign of a strong break to the upside. However, Titan of
Crypto reaffirmed his long-term bullish stance on Bitcoin, stating
that the $110,000 price level is “inevitable.” According to his
analysis, Bitcoin is only undergoing a correction phase, a
necessary consolidation before its next upward movement.
Although the correction has largely held up above $90,000, there is
still a possibility of a break below during this consolidation
phase. With this in mind, Titan of Crypto highlighted that if
Bitcoin were to experience further declines, the $87,000 mark could
represent the “maximum pain.” This is the lowest threshold that the
Bitcoin price can go to in order to keep the bullish sentiment
alive among Bitcoin holders. Technical Analysis Shows Cup And
Handle Pattern In Play The technical analysis is based off of
Bitcoin’s price action after breaking out of the neckline of a cup
and handle pattern. According to the chart below, this cup and
handle pattern played out throughout the 2022 bear market, the 2023
recovery, and the 2024 bull market. Recent bullish price action in
October and November saw the Bitcoin price breaking above the
neckline, which opened up the stage for a bullish run. In a prior
post immediately after the breakout, Titan of Crypto highlighted a
price target of around $110,000, although noting the possibility of
a correction before reaching the target. This correction has played
out exactly as intended with the recent price decline in the past
two weeks. Related Reading: Ethereum Total Value Locked Reaches
Highest Level Since 2022 After Crossing $90 Billion, Will Price
Follow? At the time of writing, Bitcoin is trading at $95,906.
Reaching the $110,000 target would translate to a 15% return on
investment from the current price. In another analysis posted
on social media platform X, the analyst hinted at the possibility
of $120,000 being the peak for Bitcoin this cycle based on
Fibonacci Circle analysis. This price target dwarfs in comparison
to predictions from other analysts, with projections ranging from
$250,000 to $1 million. Featured image created with Dall.E, chart
from Tradingview.com
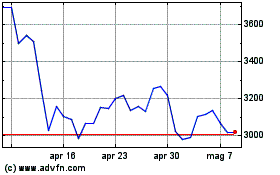
Grafico Azioni Ethereum (COIN:ETHUSD)
Storico
Da Nov 2024 a Dic 2024

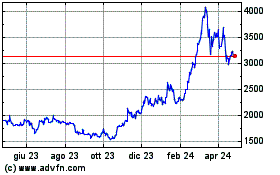
Grafico Azioni Ethereum (COIN:ETHUSD)
Storico
Da Dic 2023 a Dic 2024
